After you enable log collection for Web Application Firewall (WAF) protected objects, you can query and analyze their log data, and use the results to generate charts, create alerts, and more.
Prerequisites
The log service for WAF is enabled. For more information, see Enable or disable log service.
A protected object exists (your web business is already integrated with WAF). For more information, see Overview.
Log delivery is enabled for your WAF protected objects. For more information, see Manage log delivery status.
Query and analyze logs
-
Log on to the Web Application Firewall 3.0 console. From the top menu bar, select the resource group and region (Chinese Mainland or Outside Chinese Mainland) for the WAF instance.
In the left-side navigation pane, choose .
At the top-left of the Log Service page, select the protected object whose logs you want to query.
ImportantLog collection must be enabled for the protected object (the Status switch is turned on). Otherwise, WAF cannot collect its log data. If log collection is not enabled for the selected protected object, search for the object on the current page, click its name, and turn on the Status switch to enable log collection.
On the Log Query tab, use a query and analysis statement to query and analyze WAF log data.
Enter a query statement in the query editor.
Query statements use the syntax specific to Alibaba Cloud Simple Log Service (SLS). For more information, see Search syntax and functions. Your query statement can use fields from WAF logs as query fields. For a list of supported fields, see Log fields.
If you are not familiar with the query syntax, we recommend using Advanced Search. Expand Advanced Search above the query editor, set your search conditions, and click Search. A matching query statement is automatically generated in the query editor. The following table describes the search conditions available in Advanced Search.
Search condition
Description
IP
The IP address of the client that sent the request.
Request ID
A unique identifier that WAF generates for a client request. WAF provides this ID when it returns a block page or a slider CAPTCHA response. You can use the request ID to analyze and troubleshoot issues.
Rule ID
The ID of the WAF protection rule that was matched. You can find the rule ID on the Protection Rule page, or from match records and statistics on the Security Reports page. For more information, see Security reports.
Status Code Returned from Origin Server
The HTTP status code that the origin server returns for a request forwarded by WAF.
Status Code Returned from WAF
The HTTP status code that WAF returns to the client.
Protection Module
The WAF protection module that was matched. For more information about WAF protection modules and how to configure their rules, see Protection configuration overview.
To calculate or analyze the query results, append an analysis statement after the existing query statement in the query editor. If you only need to query for logs that meet specific criteria, you can skip this step.
Use a pipe character (|) to separate the query statement from the analysis statement. Analysis statements use standard SQL-92 syntax. For more information, see Overview of log query and analysis.
Use the time picker to set a time range for the logs you want to query.
Click Search & Analyze.
The query and analysis results (WAF logs matching your query conditions) appear at the bottom of the page, including a log distribution histogram and the Raw Logs, Graph, and LogReduce tabs. You can use these results to perform quick analysis, generate charts, set up alerts, and more. For details, see Query & Analysis page.
Common query examples
The following examples show common query and analysis scenarios for WAF logs. Set the time range using the time picker at the top of the console; you do not need to include time filter conditions in the query statement.
Replace the domain names, IP addresses, and other values in the following examples with your actual values.
Query the top 10 access IPs:
host:example.com |SELECT real_client_ip,COUNT(*) as c group by real_client_ip order by c desc limit 10Query the top 10 access URLs:
host:example.com |SELECT request_path,COUNT(*) as c group by request_path order by c desc limit 10Query the URLs accessed by a specific IP (when a domain is under CC attack, the targeted endpoints are usually concentrated):
host:example.com and real_client_ip:1.2.3.4 |SELECT request_path,COUNT(*) as c group by request_path order by c desc limit 10Query the top 10 IPs accessing a specific endpoint (during an attack, malicious IPs typically rank at the top):
host:example.com and request_path: "/login.php" |SELECT real_client_ip,COUNT(*) as c group by real_client_ip order by c desc limit 10Query status codes (use abnormal status codes to check whether your business is running normally):
host:example.com|select status, upstream_status,COUNT(*) as c GROUP by status, upstream_status order by c desc limit 10Find IPs that hit the CC protection module:
host:example.com and final_plugin:cc |select real_client_ip,COUNT(*) as c group by real_client_ip order by c desc limit 10
Export query results
After you run a query, you can click Download Log on the Raw Logs tab to export the raw log data from the current query results as a CSV file.
The Graph tab does not support direct download of the data table.
Recommendations for large-scale log analysis
When the volume of WAF log data is large (for example, over one million records), we recommend against exporting all raw logs for local processing. Instead, use the SQL analysis feature on the Log Query page to perform aggregate calculations in the cloud, and download only the results.
For example, to count the number of hits for each protection rule:
* | SELECT matched_host, final_action, COUNT(*) as c GROUP BY matched_host, final_action ORDER BY c DESC LIMIT 1000To count the request volume for each domain within a specific time range:
* | SELECT host, COUNT(*) as pv GROUP BY host ORDER BY pv DESC LIMIT 100Use SQL aggregate functions such as GROUP BY, COUNT, and SUM to perform calculations in the cloud. This significantly improves analysis efficiency for large datasets and avoids timeout or oversized file issues that can occur when exporting all raw logs.
Query & Analysis page
Page overview
Histogram
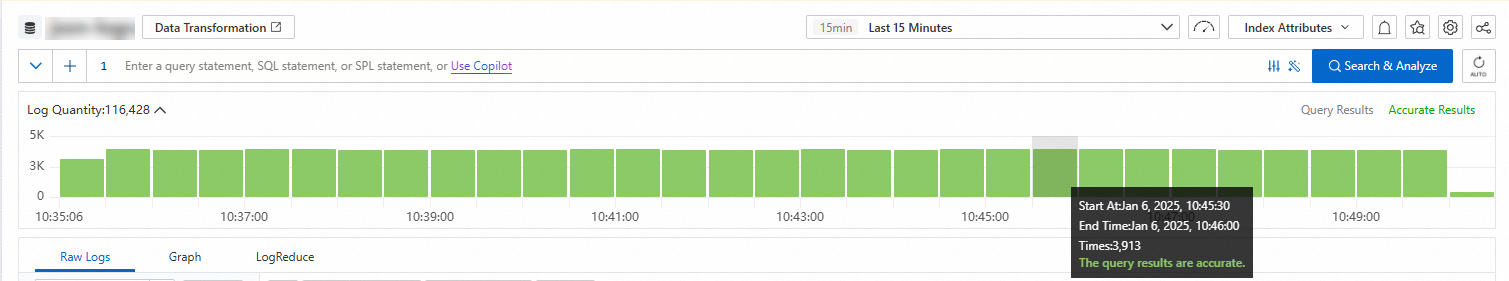
-
Hover over a green block to view its time range and hit count.
-
Double-click a green block to drill into a finer time granularity. Results for that time range appear on the Raw Logs tab.
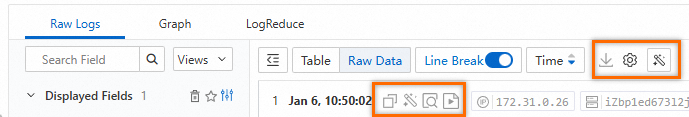
Raw logs
-
Log details
-
Click Table or Raw Data to switch the log display format.
-
 > Download Log: Download logs to your computer. Download logs.
 -
 > JSON Settings: Set the display type and level for JSON logs.
 -
> Event Settings: Configure events for raw logs.
-
 : Copy the log content.
 -
 : Use SLS Copilot to summarize information and find errors based on log content.
 -
 : View a log entry in context within its original file. Available only for Logtail-collected logs. Contextual query.
 -
 : Monitor logs in real time and extract key information. Available only for Logtail-collected logs. LiveTail.
-
-
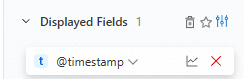
Displayed fields
-
In the Displayed Fields section, click the
 icon next to a field to remove it from Displayed Fields. The field no longer appears in logs on the right.
 -
 : Save the current field selection to favorites. After you specify the fields to display in Area 5, select a saved view from the drop-down list above Area 4.
 -
 > Tag Settings: Set a field as a system tag.
 -
> Alias: If you enable this feature, field names are replaced by their aliases. Fields without aliases keep their original names. Set field aliases in Create indexes.
-
-
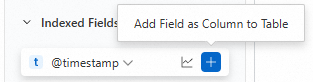
Index fields
-
In the Indexed Fields section, click the
 icon next to a field to add it to Displayed Fields. The field then appears in logs on the right.
 -
 : View the Basic Distribution and Statistical Metrics of the field. Field settings.
-
Graph
A graph displays the results that are rendered by Simple Log Service based on a query and analytic statement. Simple Log Service supports tables, line charts, column charts, and more. Statistical charts. View results on the Graph tab. 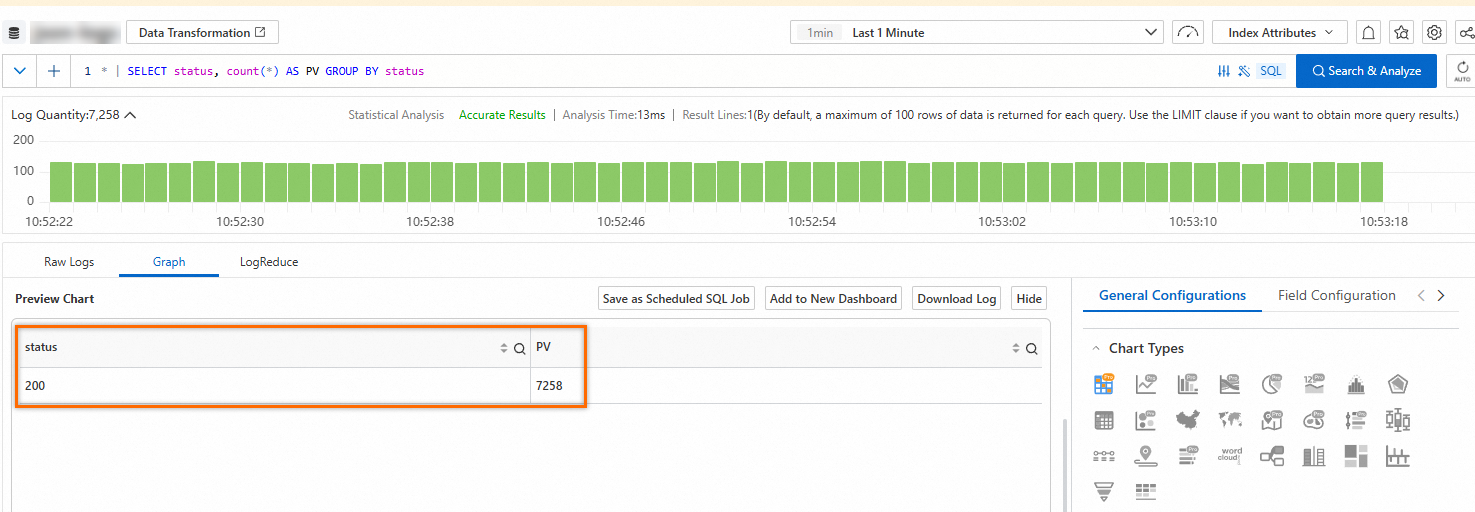
Other features on this tab:
-
Add to New Dashboard: A dashboard is a real-time data analysis board provided by Simple Log Service. Save query and analysis results as a chart to a dashboard. Click Add to New Dashboard to add a chart. Visualization overview.
-
Save as Scheduled SQL Job: Simple Log Service periodically analyzes data, stores aggregated data, and projects or filters data. Scheduled SQL.
-
Interaction Occurrences: Drill down into data by adjusting dimension hierarchy and analysis granularity. Add an interaction to a dashboard for drill-down analysis.
LogReduce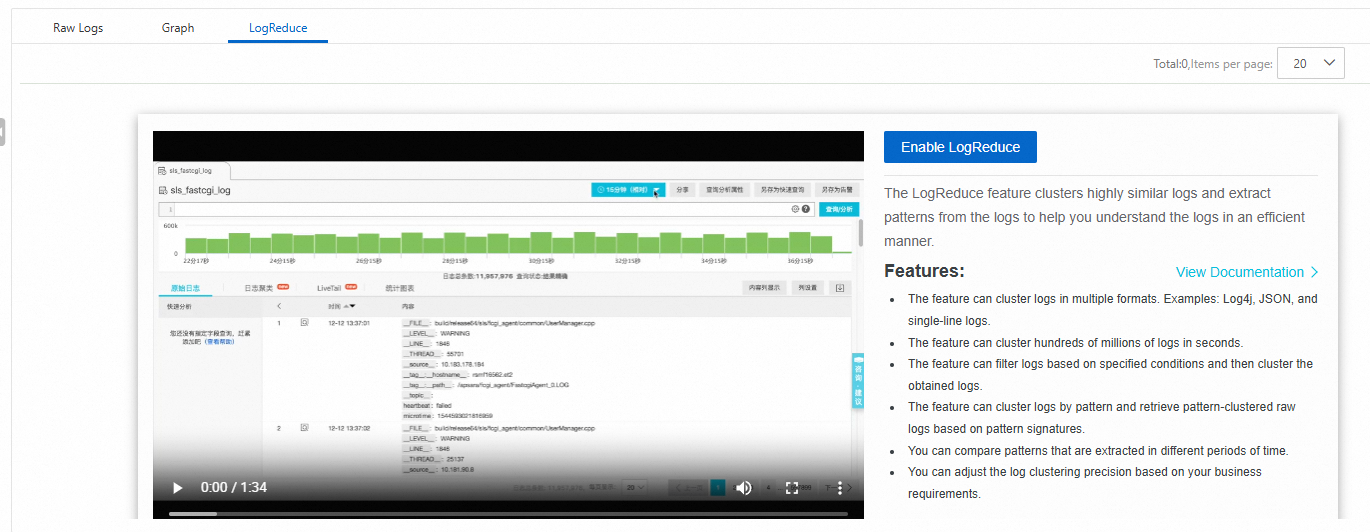
On the LogReduce tab, click Enable LogReduce to aggregate highly similar logs during collection. LogReduce.
SQL enhancement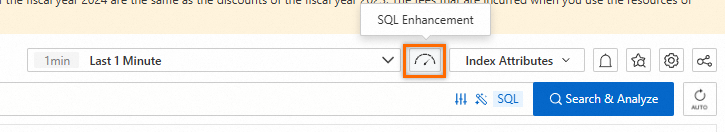
Click the ![]() icon in the upper-right corner to enable Dedicated SQL for the current session. Dedicated SQL allocates additional computing resources to analyze larger data volumes per query. To enable Dedicated SQL by default: High-performance, fully accurate query and analysis (Dedicated SQL).
icon in the upper-right corner to enable Dedicated SQL for the current session. Dedicated SQL allocates additional computing resources to analyze larger data volumes per query. To enable Dedicated SQL by default: High-performance, fully accurate query and analysis (Dedicated SQL).
Alerting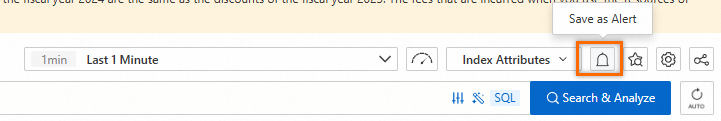
Click the  icon in the upper-right corner and select Save as Alert to create an alert rule based on the query and analysis results. Get started with alerting.
Saved search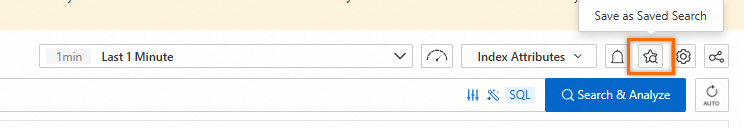
Click the  icon in the upper-right corner to Save as Saved Search the current query and analysis statement. Use saved searches to quickly re-run frequent queries. Saved Search.
Share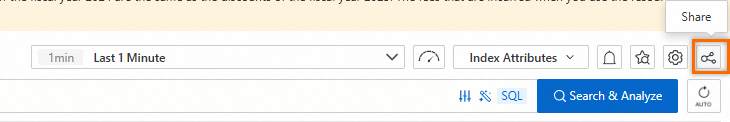
Click the  icon in the upper-right corner to copy the URL of the current page and share it. Embed and share console pages.