You can configure CloudMonitor to push alerts for high-severity API security events, to help you respond to online risks promptly. However, API security events are classified into three severity levels: low, medium, and high. CloudMonitor alone cannot send alerts for all severity levels. This topic describes how to use Simple Log Service (SLS) to create multi-level alerts.
Solution overview
After you enable the log delivery feature for API security, all API security events are recorded and stored in real time. You can use SLS query statements to create alert rules based on the log data of API security alerts and send alert notifications through the following two methods:
Method 1: Use the native notification feature of Simple Log Service to push alerts directly.
Method 2: Combine Simple Log Service with CloudMonitor and use the event subscription feature of CloudMonitor to push alerts.
Prerequisites
SLS is activated.
If you plan to use CloudMonitor for notifications, make sure CloudMonitor is activated.
Prepare a destination Logstore for API security log delivery.
NoteThe log subscription feature does not support using Logstores that are automatically created by Simple Log Service or Logstores that you name
waf-logstore,wafng-logstore, orwafnew-logstoreas destinations for log subscriptions.
Step 1: Enable log delivery and create an index
Deliver API security attack event information to a Logstore in Simple Log Service. This allows you to use SLS features to create alerts for different attack event levels.
Log on to the Web Application Firewall 3.0 console. In the top menu bar, select the resource group and region for the WAF instance (Chinese Mainland or Outside Chinese Mainland).
In the left navigation bar, select .
On the API Security page, click the Log Subscription Configurations sub-tab on the Policy Configurations tab.
In the Attack Event Information section, click Configure.
In the subscription configuration panel, specify the region, project, and name of the destination Logstore for log delivery.
Ensure that the status for Attack Event Information is set to Enabled.
To use the
event_levelfield in SQL queries for Query and Analysis when you create alerts in Simple Log Service, first enable an index as prompted. For more information, see Create an index.
You are charged for the cloud resources that you create in Simple Log Service, such as projects and indexes. For billing details, see Billing overview.
You may incur fees after creating a project or Logstore, even if no log subscription task is enabled. To avoid unexpected charges, delete any Logstores you no longer need. For more information, see Why am I charged even if I only create projects and Logstores?
Step 2: Create an SLS alert rule
Create log-based alert rules to monitor and handle different levels of API security events.
Create an alert rule
On the left side of the console, click the alert button
 . On the Alert Center tab, click Create Alert. The Create Alert page opens on the right.
Click Add next to Query and Statistics to go to the Query and Statistics page.
In Query and Statistics, on the Advanced page, select the target Logstores.
Enter a query statement and select a Query Time Range.
Filter data by risk level
You can use the following query statements to filter logs and obtain logs whose risk level is high, medium, or low:
/*Filter for high-risk data*/
select event_level,COUNT(*) AS CNT WHERE event_level='high'

/*Filter for medium-risk data*/
select event_level,COUNT(*) AS CNT WHERE event_level='medium'

/*Filter for low-risk data*/
select event_level,COUNT(*) AS CNT WHERE event_level='low'
This step allows you to use custom query and analysis statements to filter results for various risk levels.
After you enter a query statement and click Confirm at the bottom, you are returned to the Create Alert page, where the saved query statement is displayed in the Query and Statistics section.
Select the trigger conditions and severity for the rule. The Severity is required when you configure CloudMonitor notifications. We recommend that you select a severity level based on the event_level of the alert filter condition. For example, if the event_level is high, select a high severity level.
The preceding tutorial covers the functionality required for this example. You can configure parameters such as Check Frequency, Trigger Condition, Group Evaluation, Recovery Notification, Add Label, and Add Annotation based on your business needs. For more information, see How to create a log alert monitoring rule. Additionally, if you use CloudMonitor to push notifications, the severity in the trigger condition corresponds to the event level in the subscription policy.
Select a destination.
For now, do not enable any destinations. You will configure this in Step 3.
Click OK. You can see the new rule on the Alert Rules page. This completes the alert rule configuration in Simple Log Service.
Step 3: Configure alert push notifications
Method 1: SLS push
If you choose this method, you will use the alerting and notification features of SLS to push alerts for API security events.
Configure notification objects
Configure the recipients for your notifications.
On the current page, click the Notification Objects tab.
On the Users sub-tab, click Create to open the Add User page.
The panel includes fields such as Identifier, Name, and Mobile, as well as toggles for Receive Text Message, Receive Phone Call, and Enable.
In the Add User panel, enter the user's information and ensure that the toggles for Enable, Receive Text Message, and Receive Phone Call are enabled.
Click OK and refresh the page to confirm that the new user has been added.
Configure an alert template
If you want notifications to include details like the instance ID that triggered the alert, the alert rule name, or the alert severity, you can customize the notification content in a content template.
On the Alert Center page, select . On the Alert Template tab, click Create.
In the pop-up Content Template page, you can customize the Send Content. This will be the content format of the push notifications that you receive.
For example, on the SMS tab, you can enter the following template variables in the Content field:
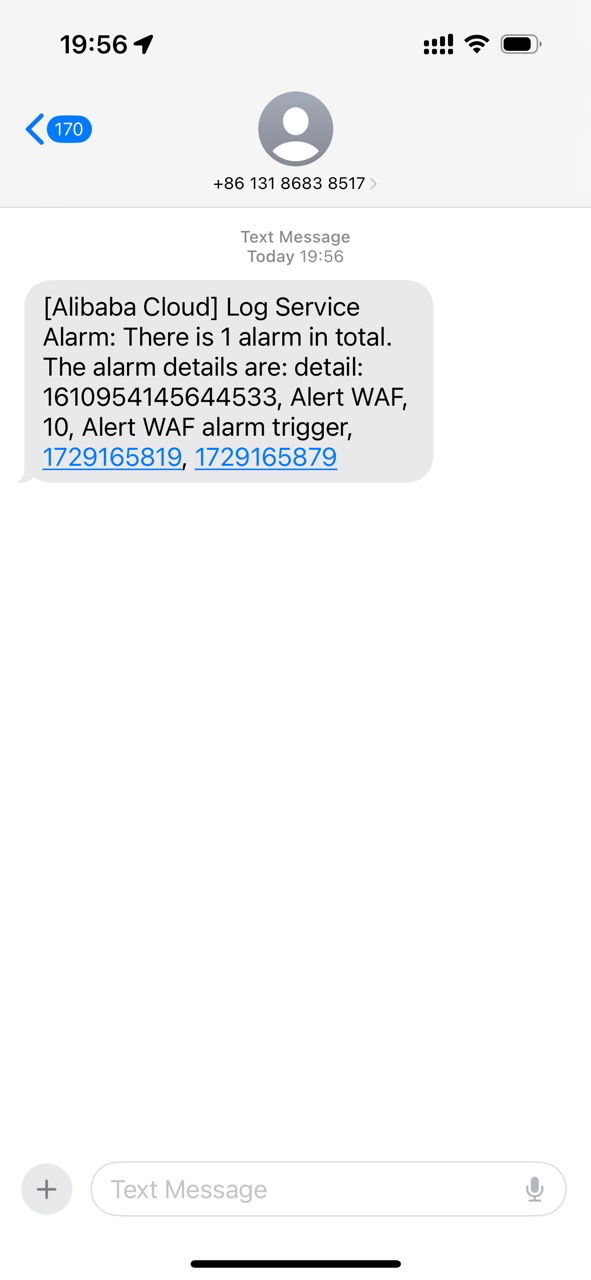
detail:{{ alert.aliuid }}, {{ alert.alert_name }}, {{ alert.severity }}, {{ alert.annotations.title }}, {{ alert.fire_time }}, {{ alert.alert_time }}.NoteThis example shows only a few template variables for reference. For more variables, see the full list of alert template variables.
After clicking Confirm, refresh the page to confirm that the content template was added successfully.
Select a destination
Find the rule you just created and click Edit in the Actions column.
Scroll to the bottom of the page. For the destination, select SLS Notification and turn on the Enable toggle.
After you enable SLS notifications, you must select an Alert Policy. Typically, in Minimalist mode, you only need to configure the push channel, select static recipients, add alert notification contacts, and select an appropriate content template. In this example, select Minimalist mode, the recipients, and a content template to complete a basic alert policy configuration.
NoteSimple Mode allows you to send alerts by editing channels, alert recipients, content templates, and sending periods.
Standard Mode allows you to push alerts by selecting a system-defined action policy or creating a new custom action policy.
Advanced Mode sends alerts by selecting an Action Policy and an Alert Policy.
ImportantTo learn about the notification channels supported by SLS, see Notification channels. If you select SMS or voice calls as a channel, additional fees apply. For billing details, see Pay-by-feature billable items.
Click OK to save the changes.
If you have more complex configuration requirements for your business scenario, see Destination - SLS notification.
Enable SLS push
Log on to the Simple Log Service console.
In the Projects section, click the target project.
On the left side of the console, click the alert icon
. On the Alert Center tab, click the Alert Rules sub-tab and confirm that the rule status is Starting.
Method 2: CloudMonitor push
If you choose this method, you will combine SLS alerts with CloudMonitor notifications to send API security alerts.
1. Set the destination for SLS alerts
Find the rule you just created and click Edit in the Actions column.
Scroll to the bottom of the page. Under Destination, select CloudMonitor Event Center and turn on the switch. Click Confirm to save the changes.
2. Create alert contacts and groups
CloudMonitor can only push notifications to contact groups. Therefore, you must add the desired recipients to a contact group.
2.1 Create an alert contact
Log on to the CloudMonitor console.
In the left navigation bar, select .
On the Alert Contacts tab, click Create Alert Contact.
In the Set Alert Contact panel, enter the alert contact's name, mobile number, email address, and Webhook URL, and leave the other parameters at their default values.
After you click Confirm, you are returned to the Alert Contacts panel, where you can confirm that the alert contact was created successfully.
2.2 Create an alert contact group
Click the Alert Contact Group tab.
On the Alert Contact Group tab, click Add Contact Group.
In the Add Contact Group panel, enter a name for the alert contact group, and select existing alert contacts.
Click OK.
3. Create a notification configuration
Prerequisites: You have already created an alert contact and an alert contact group.
Return to the CloudMonitor console.
In the left navigation bar, select .
On the Upgrade strategy page, click the Create policy panel, and enter the Name and select the Contact Group.
Click OK.
4. Create an event subscription
Return to the CloudMonitor console.
In the left navigation bar, select .
On the Subscription Policy tab, click Create Subscription Policy.
On the Create Subscription Policy page, set the parameters for the subscription policy.
Parameter
Description
Basic information
Enter a name for the subscription policy.
Alert Subscription
For Subscription Type, select System Event.
For Product, select Simple Log Service.
Event Type multiple selection (Firing, Resolve)
NoteFiring indicates that an alert is in the triggered state and corresponds to specific event names.
CRITICAL alert event
INFO alert event
WARN alert event
Resolved indicates that the alert has been resolved and corresponds to a specific event name.
Alert recovery event
Event name: Select one or more of the following: AlertEvent:CRITICAL, AlertEvent:INFO, AlertEvent:RESOLVED, or AlertEvent:WARN.
For Event Level, select Critical.
NoteSince the trigger condition in Step 2 was set to High, the corresponding Event Level is Critical. If you set a different trigger condition severity, you must also select the corresponding event level based on the following mapping:
A trigger condition with a severity of Critical or High maps to an Event Level of Critical.
A trigger condition with a severity of Low or Medium maps to an Event Level of Warning.
A trigger condition with a severity of Report maps to an Event Level of Info.
For Event Content, enter the name of the alert rule that you created in Step 2: Create an SLS alert rule.
Neither Application grouping nor Event Resources is set
Combined Noise Reduction
Use the default value.
Notification
Select your target notification configuration, and for Custom Notification Method, use the default notification method.
ImportantCloudMonitor provides a free quota that includes SMS alerts. If you require voice call notifications, go to the CloudMonitor console and activate the pay-as-you-go service in the Basic CloudMonitor module. For billing details, see Pay-as-you-go for Basic CloudMonitor.
Push and Integration
No configuration is required.
For the Alert Subscription settings, see the parameter descriptions above.
NoteThe steps provided are an example of one way to implement push notifications. You can adjust the configuration based on your business requirements. For more information, see Create a subscription policy.
At the bottom of the Create Subscription Policy page, click the Submit button. You are automatically redirected to the Event Subscription page. The policy that you just submitted is successfully created, and its status is Starting.
Verification
After completing the preceding steps, you have finished configuring alert push notifications. You can verify the alerts by checking the notifications received by the recipient.
View CloudMonitor push notifications
Open the CloudMonitor console. In the left navigation bar, select . Verify the pushed notification information.
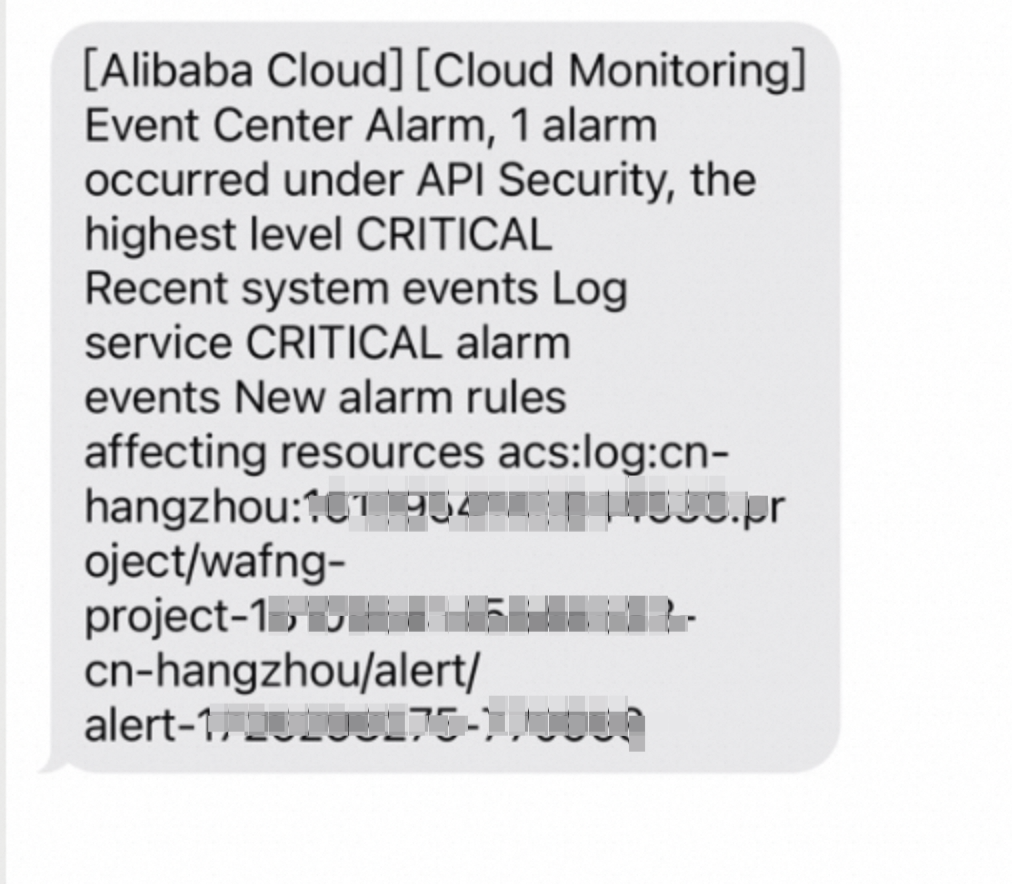
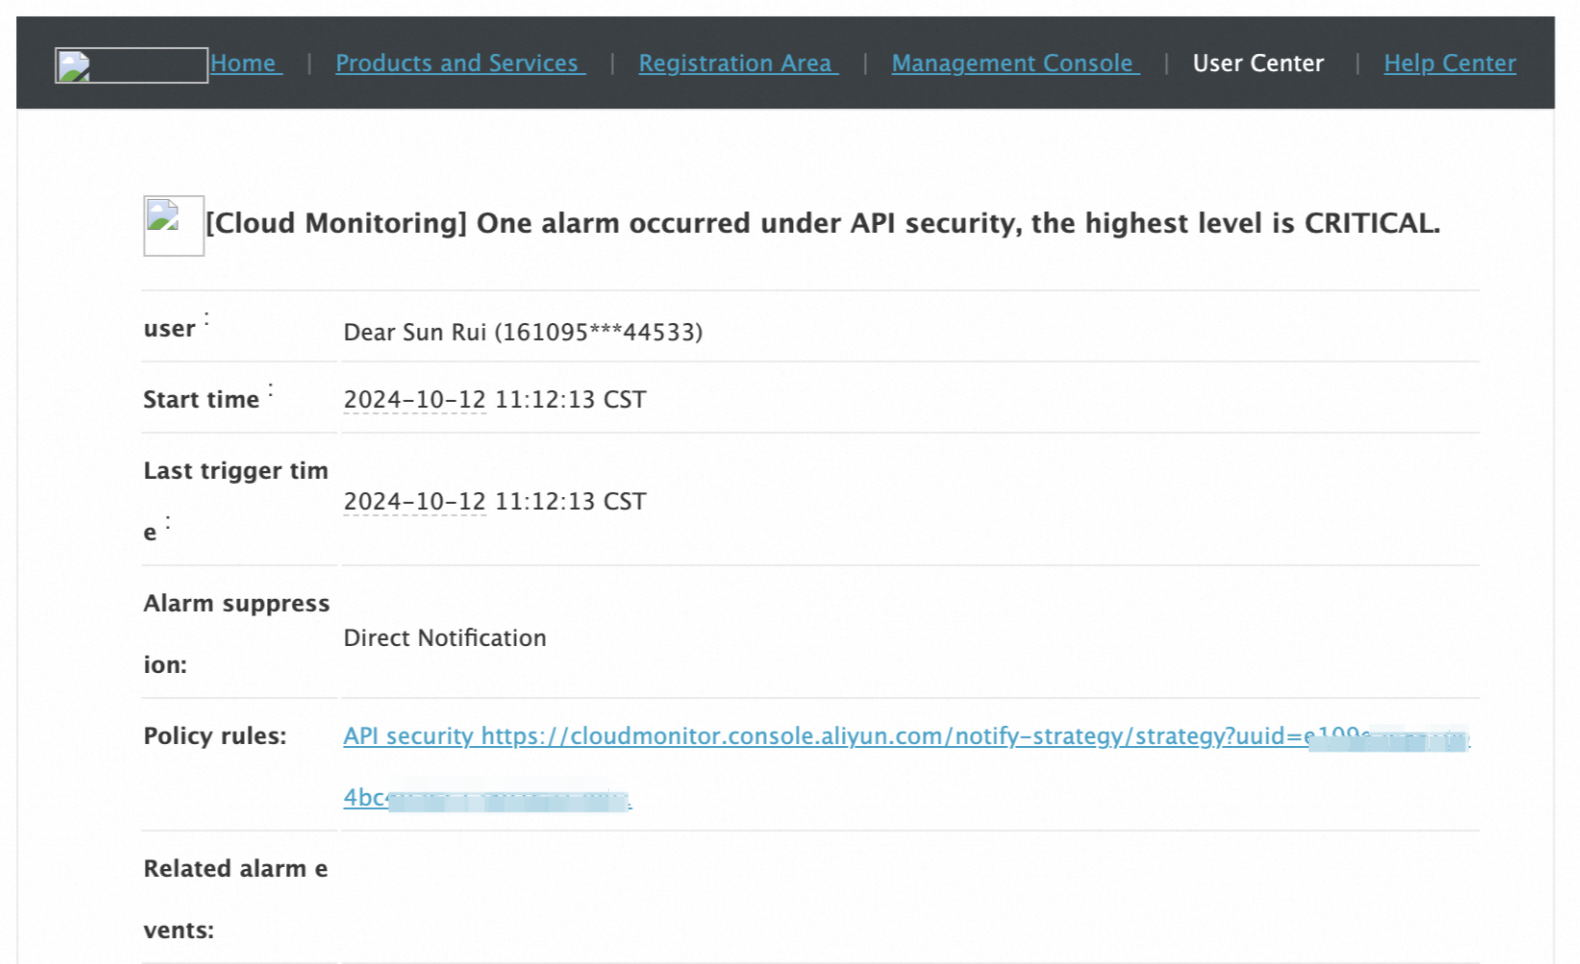
You can see the triggered alert notification records, such as a system event alert from Simple Log Service with a severity of Critical.
Verify that the notification was received.
SMS
Email
Voice call
The call log on the iPhone shows an incoming call from Xiamen, Fujian, with the number (0592) 339 6177.
View SLS push notifications
1. On the Alert Monitoring Rule sub-tab, click a rule to go to the Alert Overview page and view the Alert History in the statistical reports.
2. Compare the console with the receiving end. The format of the received message must match the content template, and the message content must match the content in the Alert History.
The Alert History displays records of triggered alerts, including information such as Alert ID, Alert Name (for example, Alert WAF), Execution Time, Trigger Condition, and Execution Result (for example, Success). The Triggered? column shows true, indicating that the alert was successfully triggered.