The Overview page is your security monitoring dashboard for WAF. Use it to:
Review traffic volume, queries per second (QPS), and bandwidth trends for the past 30 days
Track how many requests each protection module has intercepted
Investigate urgent vulnerability notifications and see which domain names are affected
Analyze threat events by attack source, type, and tool
The Overview page shows aggregated statistics and trend data. For log-level attack details, go to Security Report (per-module summaries) or Log Service (raw logs) after you identify a threat here.
Prerequisites
Before you begin, ensure that you have:
Domain names added to WAF — see Add a domain name to WAF
Query data on the Overview page
When you log in to the WAF console, you are directed to an interface based on where your WAF instance is deployed: instances in the Chinese mainland open in the China (Hangzhou) region, and instances outside the Chinese mainland open in the Singapore region.
Log in to the WAF console. In the top navigation bar, select the resource group and the region (Chinese Mainland or Outside Chinese Mainland) where your WAF instance is deployed.
In the left-side navigation pane, click Overview.
At the top of the Overview page, set a domain name filter and a time range.
Setting Default Options Domain name All (data for all domain names added to WAF) Select a specific domain name Time range Today Intervals: 10 seconds, 30 seconds, 60 seconds, 5 minutes. Presets: Yesterday, Today, 7 Days, 30 Days
The Overview page has four sections:
Urgent vulnerabilities — protection rules for the latest publicly disclosed vulnerabilities, with affected domain names
Protection result statistics — request counts intercepted by each protection module
Request analysis charts — traffic trends, bot traffic percentage, client type distribution, and top clients, URLs, and IPs
Threat event analysis — attack events blocked by WAF, with source IPs, target URLs, attack types, and tools
Urgent vulnerabilities
The Urgent Vulnerability section displays updated WAF protection rules for the most recent security vulnerabilities disclosed on the Internet.
Click a rule to open the Details panel. The panel shows:
Domain names affected by the vulnerability
Vulnerability details
Information about the protection rules
Protection result statistics
This section shows the total number of requests WAF received and the number of requests that triggered each protection module: Web Intrusion Prevention, HTTP Flood Protection, Scan Protection, Access Control, and Blocked Bot Attacks.
Click the number below a module to go to the Security Report page and view detailed attack information. For more information, see View security reports.
Click the ![]() icon below the statistics to expand detailed data:
icon below the statistics to expand detailed data:
All domain names: the top 5 domain names for each module are displayed.
A specific domain name: a trend chart for the statistical data is displayed.
Request analysis charts
Request trend charts
The trend charts show traffic data across four tabs: Requests, QPS, Bandwidth, and Response Code. Time granularity is accurate to the second, so you can monitor real-time traffic at second-level resolution.
Click a tab to switch the trend chart. Click a legend item below the chart to show or hide that module's trend line.
Requests
Shows total requests alongside the number of requests that triggered Web Intrusion Prevention, HTTP Flood Protection, Scan Protection, Access Control, and Bot Management.
QPS
Shows queries per second (QPS) for all requests, QPS for web intrusion prevention, QPS for HTTP flood protection, QPS for scan protection, QPS for access control, and QPS for blocked bot attacks.
In the upper-right corner of the chart, toggle between Average and Peak QPS.
Bandwidth
Shows inbound and outbound bandwidth trends.
Response Code
Shows error codes returned to clients and error codes returned to WAF. Error codes tracked include 5XX, 405, 499, 302, and 444.
In the upper-right corner, toggle between WAF to Client and Origin Server to WAF.
Traffic analysis
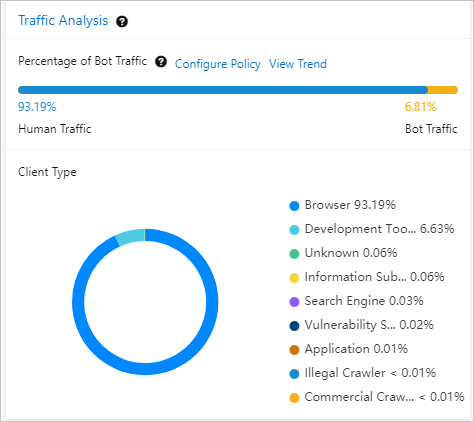
The Traffic Analysis section breaks down traffic into two views:
Percentage of bot traffic
Shows the split between human traffic (from browsers and applications) and bot traffic (from all other client types) for the selected domain name.
If bot traffic is abnormally high, click Configure Policy to set up Bot Management rules. After configuring, click View Trend to open the Bot Management tab in Security Report and check protection effectiveness. For more information, see Configure anti-crawler rules for websites.
Client type distribution
Shows the distribution of client types in a pie chart. Common types include browsers, script tools, search engines, and scanners.
Click the ![]() icon next to Traffic Analysis to see descriptions of each client type. Click a slice in the pie chart to drill down into the subtype distribution for that client type.
icon next to Traffic Analysis to see descriptions of each client type. Click a slice in the pie chart to drill down into the subtype distribution for that client type.
Request analysis ranking charts
The ranking charts display the top 10 results across three tabs:
Top 10 Clients: client types that initiated the most requests
URL Requests: URLs that received the most requests
Top IP: source IP addresses of the most requests
Threat event analysis
The Threat Event Analysis section shows attack events on your website and the attacks blocked by WAF.
Click an event name to open the event details panel, which includes threat intelligence and handling suggestions. The Top 5 Attacks sub-section lets you pivot the data across five dimensions:
| Tab | What it shows |
|---|---|
| Source IP Address | Top 5 source IP addresses of attacks |
| Target | Top 5 URLs that received the most attacks |
| Attack Type | Top 5 attack types (for example, SQL injection, cross-site scripting (XSS)) |
| Attack Date | Top 5 dates with the most attacks |
| Attack Tool | Top 5 tools used in attacks (for example, cURL, postman-runtime) |
To investigate an event in depth, click View Log next to the event name to open Log Service and query the raw logs. For more information, see Query logs.
What's next
Respond to a flagged threat event: use the Top 5 Attacks tabs to identify the attack source, then create or adjust a protection rule in Access Control or Bot Management.
Investigate bot traffic anomalies: click Configure Policy in the Percentage of Bot Traffic section.
Review detailed attack logs: navigate to Security Report or Log Service.