Use Log Service for WAF to search, filter, and analyze WAF traffic logs in real time. Query results surface blocked requests, attack origins, and triggered protection rules — so you can investigate incidents, tune rules, and act on findings without leaving the console.
Prerequisites
Before you begin, ensure that you have:
-
Log Service for WAF enabled. For setup instructions, see Get started with the Log Service for WAF feature
Query and analyze logs
-
Log on to the WAF console. In the top navigation bar, select the resource group and the region where your WAF instance is deployed (Chinese Mainland or Outside Chinese Mainland).
-
In the left-side navigation pane, choose Security Operations > Log Service.
-
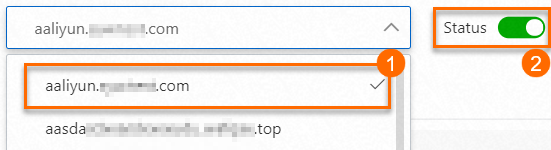
Select a domain name from the drop-down list, then turn on Status to enable log collection for that domain name. The drop-down list (labeled 1 in the figure) shows only domain names protected by WAF. If the domain name you need is missing, add it to WAF first. See Tutorial.
-
On the Log Search tab, build and run a query.
-
Enter a query statement in the search box (labeled 1 in the figure). Query statements use Log Service search syntax. For syntax details, see Search syntax. For the full list of WAF log fields you can use as query conditions, see Log fields supported by WAF. If you prefer a guided approach, expand Advanced Search above the search box, fill in the conditions, and click Search. The console generates the query statement for you. The following conditions are available:
Search condition
Description
IP
IP address of the client that sent the request
Request ID
Unique ID that WAF assigns to each request. WAF includes this ID on error pages and slider CAPTCHA pages, so you can trace specific requests during troubleshooting.
Rule ID
ID of the WAF protection rule that matched the request. Find rule IDs on the Security Report page or under System Management > Protection Rule Group.
Server Response Code
HTTP status code the origin server returned to WAF
Status Code Returned by WAF
HTTP status code WAF returned to the client
Protection Features
Type of WAF protection rule that matched the request. For rule types and configuration, see Overview.
-
(Optional) To compute or aggregate the results, append an analytic statement after a vertical bar (
|). Analytic statements use standard SQL-92 syntax. For details, see Overview of log query and analysis. Skip this step if you only need to view matching log entries. -
Set the time range using the time selector (labeled 2 in the figure).
-
Click Search & Analyze (labeled 3 in the figure).

-
Results appear in the log histogram and on the Raw Logs and Graph tabs below. For practical query examples, see Query and analysis examples.
Manage query results
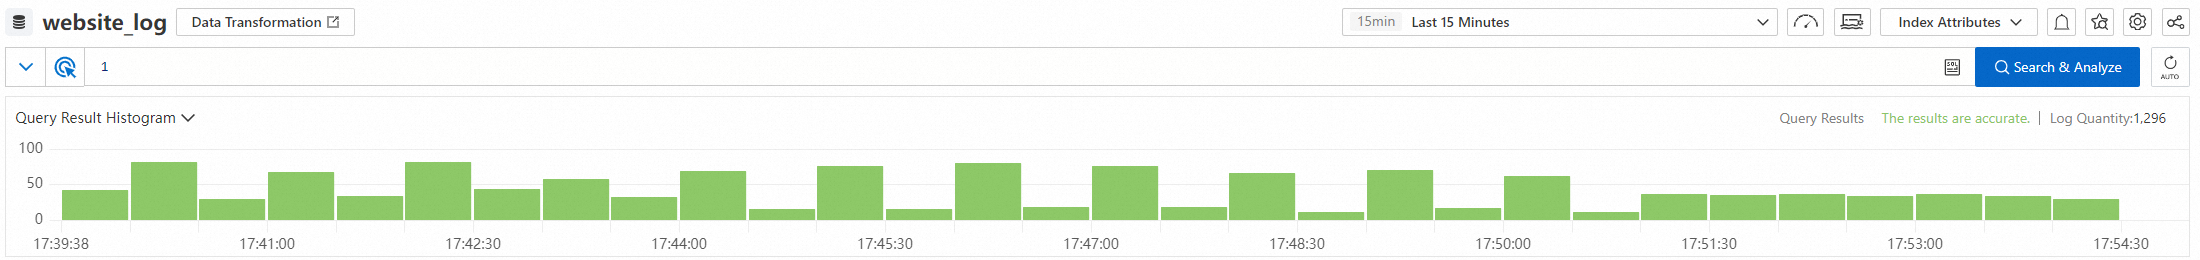
Log histogram
The log histogram shows how queried logs are distributed across time.
-
Hover over a green rectangle to see the time range it represents and the number of logs in that range.
-
Click a green rectangle to drill into a finer time breakdown and view matching entries on the Raw Logs tab.
Raw Logs
The Raw Logs tab shows individual log entries.
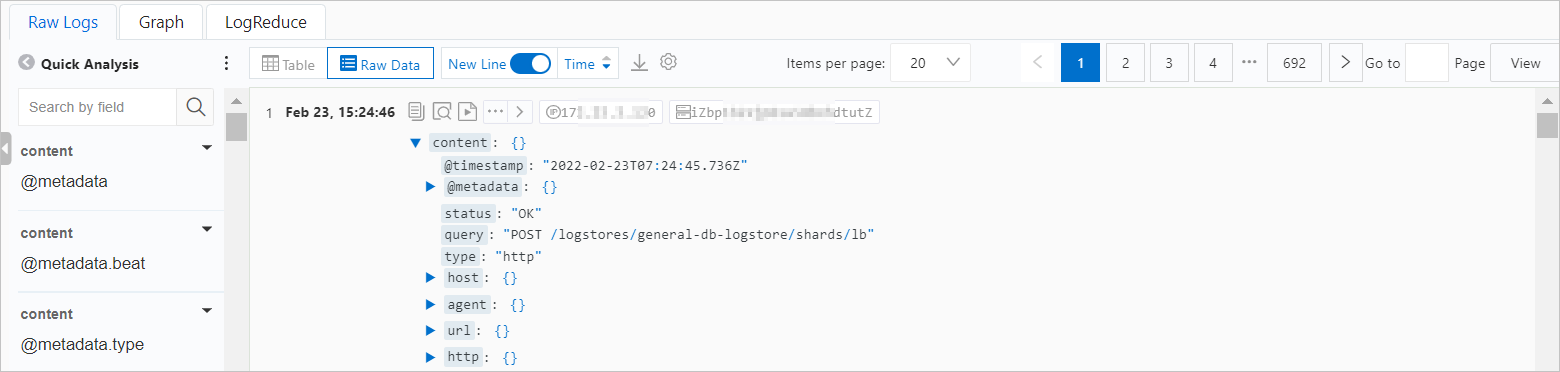
Quick analysis
Click the ![]() icon to toggle between field names and field aliases. Aliases are set when you configure indexes. For example, if you set
icon to toggle between field names and field aliases. Aliases are set when you configure indexes. For example, if you set host_name's alias to host, the Quick Analysis list shows host when aliases are enabled.
If a field has no alias, its name is always shown, regardless of the alias display setting.
For more information, see Quick analysis.
View and download logs
| Action | How |
|---|---|
| Switch between table and raw views | Click Table or Raw Data |
| Copy a log entry | Click the |
| View tag details | Click the |
| Toggle multi-line display | Click New Line |
| Sort by time | Click Time |
| Download logs | Click the |
| Configure display settings | Click the |
Graph
The Graph tab visualizes analytic results. It requires an analytic statement (SQL-92) in your query.
| Action | How |
|---|---|
| Change the chart type | Select a chart type from the chart picker. For available types, see Chart configurations. |
| Preview the chart | Preview the chart after you change the chart type |
| Add to a dashboard | Click Add to New Dashboard |
| Download logs | Click Download Log. Options: Download Log in Current Page, Download All Logs with Cloud Shell, Download All Logs Using Command Line Tool. See Download logs. |
To fine-tune a chart, use the following settings:
| Setting | Description |
|---|---|
| General Configurations | Global settings for the chart, such as the color scheme applied to all query statement results |
| Field Configuration | Per-query-statement or per-column display settings, such as a custom color scheme for a single query result |
| Configure an interaction occurrence | Drill-down behavior for a query result or a data column, enabling fine-grained analysis |
LogReduce
On the LogReduce tab, click Enable LogReduce to cluster similar log entries and surface patterns. For details, see LogReduce.
Act on query results
After you find what you need in the logs, you can take the following actions without leaving the console:
| Action | How |
|---|---|
| Create an alert | Choose Save as Alert > New Alert. Log Service evaluates the rule on a schedule and sends a notification each time the trigger condition is met. For configuration details, see Configure an alert rule. |
| Add a chart to a dashboard | On the Graph tab, click Add to New Dashboard. |
| Download logs for offline analysis | Click the download icon on the Raw Logs tab or Download Log on the Graph tab. See Download logs. |
Key log fields
The following fields are frequently used in WAF log queries. For the complete field reference, see Log fields supported by WAF.
| Field | Description | Possible values |
|---|---|---|
final_plugin |
Protection feature that acted on the request | waf (Protection Rules Engine), acl (IP address blacklist and custom protection policies), cc (HTTP flood protection and custom protection policies) |
final_action |
Action taken on the request | block, and others depending on rule configuration |
real_client_ip |
Client's originating IP address. If a proxy is in use or the IP header is invalid, the value is -. In that case, fall back to remote_addr. |
IP address or - |
remote_addr |
IP address that connected to WAF | IP address |
matched_host |
Domain name matched by the request | Domain name string |
host |
Requested domain name | Domain name string |
request_path |
Request path | Path string |
request_method |
HTTP request method | GET, POST, PUT, DELETE, and so on |
status |
HTTP status code WAF returned to the client | HTTP status code |
upstream_status |
HTTP status code the origin server returned to WAF | HTTP status code |
querystring |
Query string of the request | URL-encoded string |
http_user_agent |
User agent of the client | User agent string |
Query and analysis examples
The following examples cover common security investigation scenarios. Each example uses a search statement (before the |) and an analytic statement (after the |).
Blocked requests by protection feature, per 15 minutes
Shows the number of requests blocked by each protection feature in 15-minute intervals.
* |
SELECT
  time_series(__time__, '15m', '%H:%i', '0') as time,
  COUNT_if(final_plugin = 'waf') as "wafmodule",
  COUNT_if(final_plugin = 'acl') as "aclmodule",
  COUNT_if(final_plugin = 'cc') as "httpfloodmodule"
GROUP by
  time
ORDER by
  time
Protection feature breakdown by domain
Shows how many times each protection feature was triggered, grouped by domain name.
* |
SELECT
  count(*) as times,
  host,
  final_plugin
GROUP by
  host,
  final_plugin
ORDER by
  times desc
Queries per second (QPS), per 15 minutes
* |
SELECT
  time_series(__time__, '15m', '%H:%i', '0') as time,
  count(*) / 900 as QPS
GROUP by
  time
ORDER by
  time
Domains most targeted by HTTP flood attacks
and acl_action :block |
SELECT
  count(*) as times,
  host
GROUP by
  host
ORDER by
  times desc
Request details per second (latest 10)
Returns time, domain, path, method, WAF status code, origin server status code, and query string for the most recent requests.
* |
SELECT
  date_format(date_trunc('second', __time__), '%H:%i:%s') as time,
  host,
  request_path,
  request_method,
  status,
  upstream_status,
  querystring
LIMIT
  10
Latest 10 blocked attacks on a specific domain
Replace your_domain_name with the actual domain name.
matched_host: your_domain_name
and final_action: block |
SELECT
  time,
  real_client_ip,
  http_user_agent
ORDER by
  time desc
LIMIT
  10
Days elapsed since the last blocked attack on a specific domain
The result is rounded to one decimal place.
matched_host: your_domain_name
and final_action: block |
SELECT
  time,
  round((to_unixtime(now())-__time__) / 86400, 1) as "days_passed",
  real_client_ip,
  http_user_agent
ORDER by
  time desc
LIMIT
  10
Attack trend by day
Uses date_trunc to group attack timestamps by day. For details on this function, see Date and time functions.
matched_host: your_domain_name
and final_action: block |
SELECT
  date_trunc('day', __time__) as dt,
  count(1) as PV
GROUP by
  dt
ORDER by
  dt
Attack breakdown by country
Uses ip_to_country to map client IP addresses to countries. When real_client_ip is - (proxy in use or invalid IP header), the query falls back to remote_addr.
matched_host: your_domain_name
and final_action: block |
SELECT
  ip_to_country(
    if(real_client_ip = '-', remote_addr, real_client_ip)
  ) as country,
  count(1) as "Number of attacks"
GROUP by
  country
Attack breakdown by province
Uses ip_to_province to map client IP addresses to provinces. For details on this function, see IP functions.
matched_host: your_domain_name
and final_action: block |
SELECT
  ip_to_province(
    if(real_client_ip = '-', remote_addr, real_client_ip)
  ) as province,
  count(1) as "Number of attacks"
GROUP by
  province
What's next
-
Log fields supported by WAF — reference for all queryable log fields
-
Configure an alert rule — set up notifications when attack thresholds are exceeded
-
Download logs — export logs for offline analysis