The playback quality dashboard uses instrumentation data reported by ApsaraVideo Player SDK to provide core metrics such as playback failure rate, fast startup rate, and rebuffering rate, giving you a comprehensive overview of video playback quality and viewer engagement.
Prerequisites
Before you use the playback quality dashboard, make sure the following prerequisites are met:
-
Use ApsaraVideo Player SDK. Ensure that your license is valid and that the log reporting feature is enabled. This feature is enabled by default. The playback quality dashboard supports ApsaraVideo Player SDK for Native V7.6.0 or later and ApsaraVideo Player SDK for Web V2.33.0 or later. Download ApsaraVideo Player SDK.
-
Optional: We recommend passing the
traceIdparameter when you create a player. You can then use single-point tracing to locate a specific user or device, analyze their playback behavior, and quickly identify issues such as playback exceptions. For more information, see Quick start for Android, Quick start for iOS, and Web player API reference.
Features
The playback quality dashboard includes the Trends, Quality of Service (QoS), and Quality of Experience (QoE) modules. The following table describes the metrics in each module.
|
Module |
Description |
Included metrics |
|
Metric Trends |
Displays real-time data and period-over-period comparisons of video playback metrics within the last year, helping you monitor fluctuations in key indicators. |
All metrics from the Quality of Service (QoS) and Quality of Experience (QoE) modules. |
|
Quality of Service (QoS) |
Monitors video playback service quality. |
Includes fast startup rate, slow startup rate, time to first frame, average seek duration, playback failure rate, startup failure rate, error count per 100 seconds, rebuffering rate by count, rebuffering duration per 100 seconds, and rebuffering count per 100 seconds. |
|
Quality of Experience (QoE) |
Tracks viewer experience metrics. |
Includes views, actual views, completions, completion rate, 5-second bounce rate, unique viewers, average watch duration per user, average views per user, average completions per user, average watch duration, average video duration, average startup bitrate, and average playback bitrate. |
For detailed descriptions of these metrics, see Data metrics.
View metric trends
-
Log in to the ApsaraVideo VOD console.
-
In the left-side navigation pane, choose Data Center > Playback Quality (New).
-
On the Metric Trends tab, configure the query conditions.
The following table describes the available query conditions.
Note-
In the General Configurations section, confirm the license region, which is your business operations region. The default is Chinese mainland, Hong Kong, Macao, and Taiwan.
-
In the application list, select Sample Demo to view its preset sample data.
Condition
Description
Application
Search for or select an application under your account from the drop-down list.
Client type
The type of client. Valid values: Web and Native.
OS type
Select an OS type from the drop-down list. By default, data for all OS types is displayed. The supported OS types are:
-
Web client: Android, iOS, HarmonyOS, Windows, macOS, and Linux.
-
Native client: Android, iOS, and HarmonyOS.
Metric selection
Select the data metrics to view from the drop-down list. All 23 metrics from the QoS and QoE modules are available. By default, eight metrics are selected, including fast startup rate, time to first frame, playback failure rate, and views.
Time range
This feature supports period-over-period comparison. You can specify a custom time range or select Last 7 Days, Last 14 Days, or Last 30 Days.
NoteThe default time range is the last 7 days. You can query data from the last year. A single query can span a maximum of one month.
Granularity
The available granularity options vary based on the selected time range:
-
If the time range is within 3 days, you can select 5 minutes, 1 hour, or 1 day.
-
If the time range is between 3 and 7 days, you can select 1 hour or 1 day.
-
If the time range is longer than 7 days, you can only select 1 day.
-
-
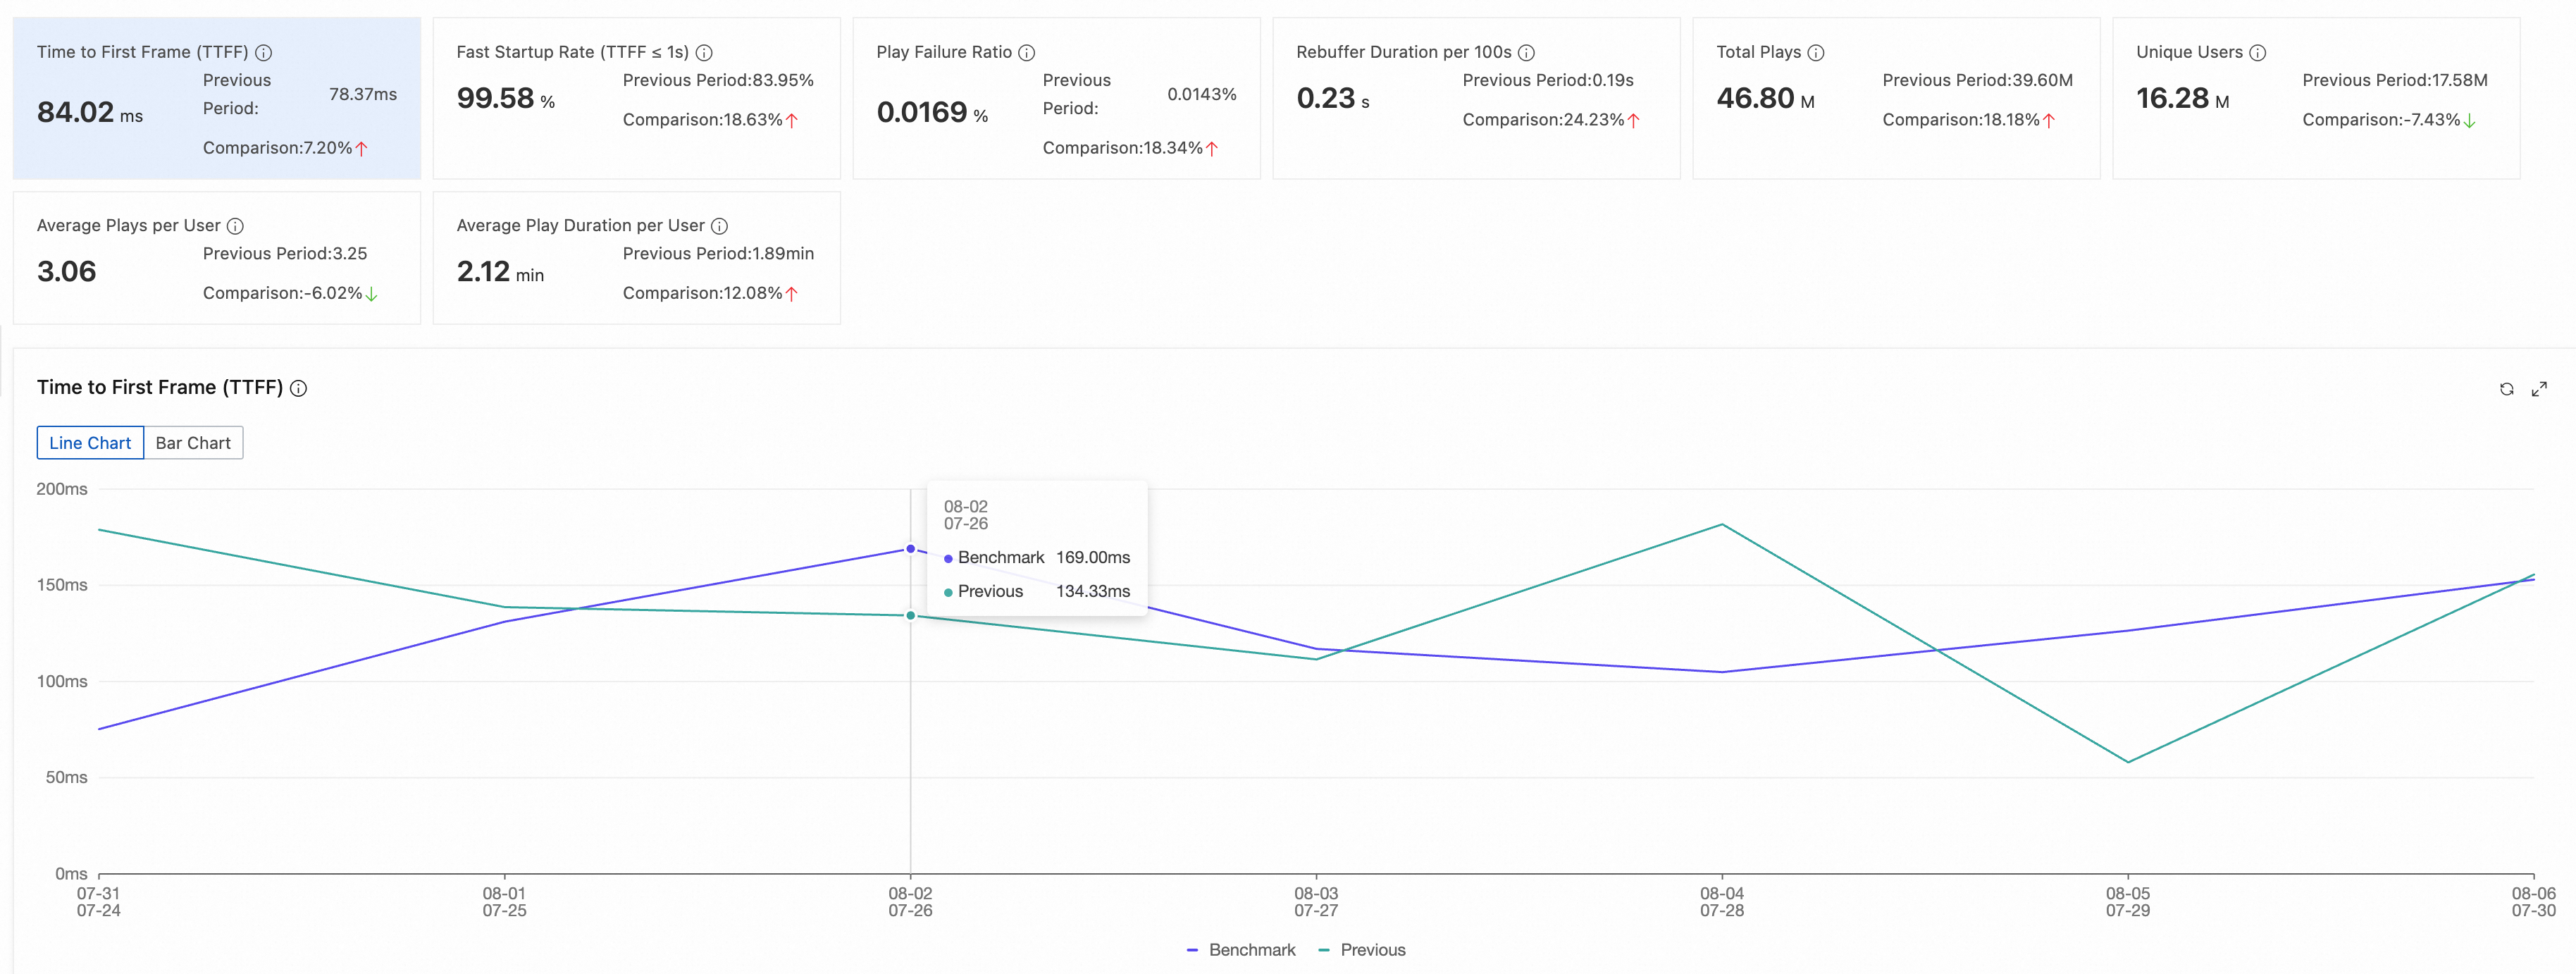
Click Query. The real-time data, period-over-period data, and data comparisons for the selected metrics are displayed on cards. You can also click a card to view its data in a chart below the card section.
View QoS and QoE data
-
Log in to the ApsaraVideo VOD console.
-
In the left-side navigation pane, choose Data Center > Playback Quality (New).
-
Click the Quality of Service (QoS) or Quality of Experience (QoE) tab.
-
Configure the query conditions.
Condition
Description
Application
Search for or select an application under your account from the drop-down list.
Client type
The type of client. Valid values: Web and Native.
OS type
Select an OS type from the drop-down list. By default, data for all OS types is displayed. The supported OS types are:
-
Web client: Android, iOS, HarmonyOS, Windows, macOS, and Linux.
-
Native client: Android, iOS, and HarmonyOS.
Metric selection
The available metrics vary based on the selected tab:
-
Quality of Service (QoS): You can view 10 metrics, including fast startup rate, time to first frame, and playback failure rate. By default, all metrics are selected.
-
Quality of Experience (QoE): You can view 13 metrics, including views, completions, and unique viewers. By default, all metrics are selected.
Time range
You can specify a custom time range or select Last 7 Days, Last 14 Days, or Last 30 Days.
NoteThe default time range is the last 7 days. You can query data from the last year. A single query can span a maximum of one month.
Granularity
The available granularity options vary based on the selected time range:
-
If the time range is within 3 days, you can select 5 minutes, 1 hour, or 1 day.
-
If the time range is between 3 and 7 days, you can select 1 hour or 1 day.
-
If the time range is longer than 7 days, you can only select 1 day.
Dimension Selection lets you group and analyze data by dimensions such as OS type and application version. You can select up to three dimensions at a time.
Dimension
Description
Application version
The version of the current application.
SDK version
The version of the ApsaraVideo Player SDK that is integrated into the application. Supported versions are Native V7.6.0 or later and Web V2.33.0 or later.
Encoding format
The encoding method used for the video file. Valid values:
-
H.264
-
H.265
-
H.266
Video format
The container format used for the video file. Valid values:
-
MP4
-
HLS
-
DASH
-
FLV
-
MOV
-
MKV
Hardware decoding
Whether hardware decoding is used. Valid values: Yes and No.
Network type
The network type used by the device. Valid values:
-
NoActive
-
Wi-Fi
-
5G
-
4G
-
3G
-
2G
-
Mobile
Carrier
The carrier used by the device. The following 11 carriers are supported:
-
CMCC
-
TELECOM
-
UNICOM
-
BROADCAST
-
OTHER_CN
-
OVERSEAS
-
GEHUA
-
DR_PENG
-
TOPWAY
-
CERNET
-
TIETONG
Resolution
The resolution of the video. Valid values:
-
FD
-
LD
-
SD
-
HD
-
2K
-
4K.
For more information, see Media asset parameters.
Domain name
The domain name of the server that hosts the video content.
Province
Filters the playback data to a specific province.
Error code
The error code generated during a playback issue. For more information, see Error codes for mobile clients.
-
-
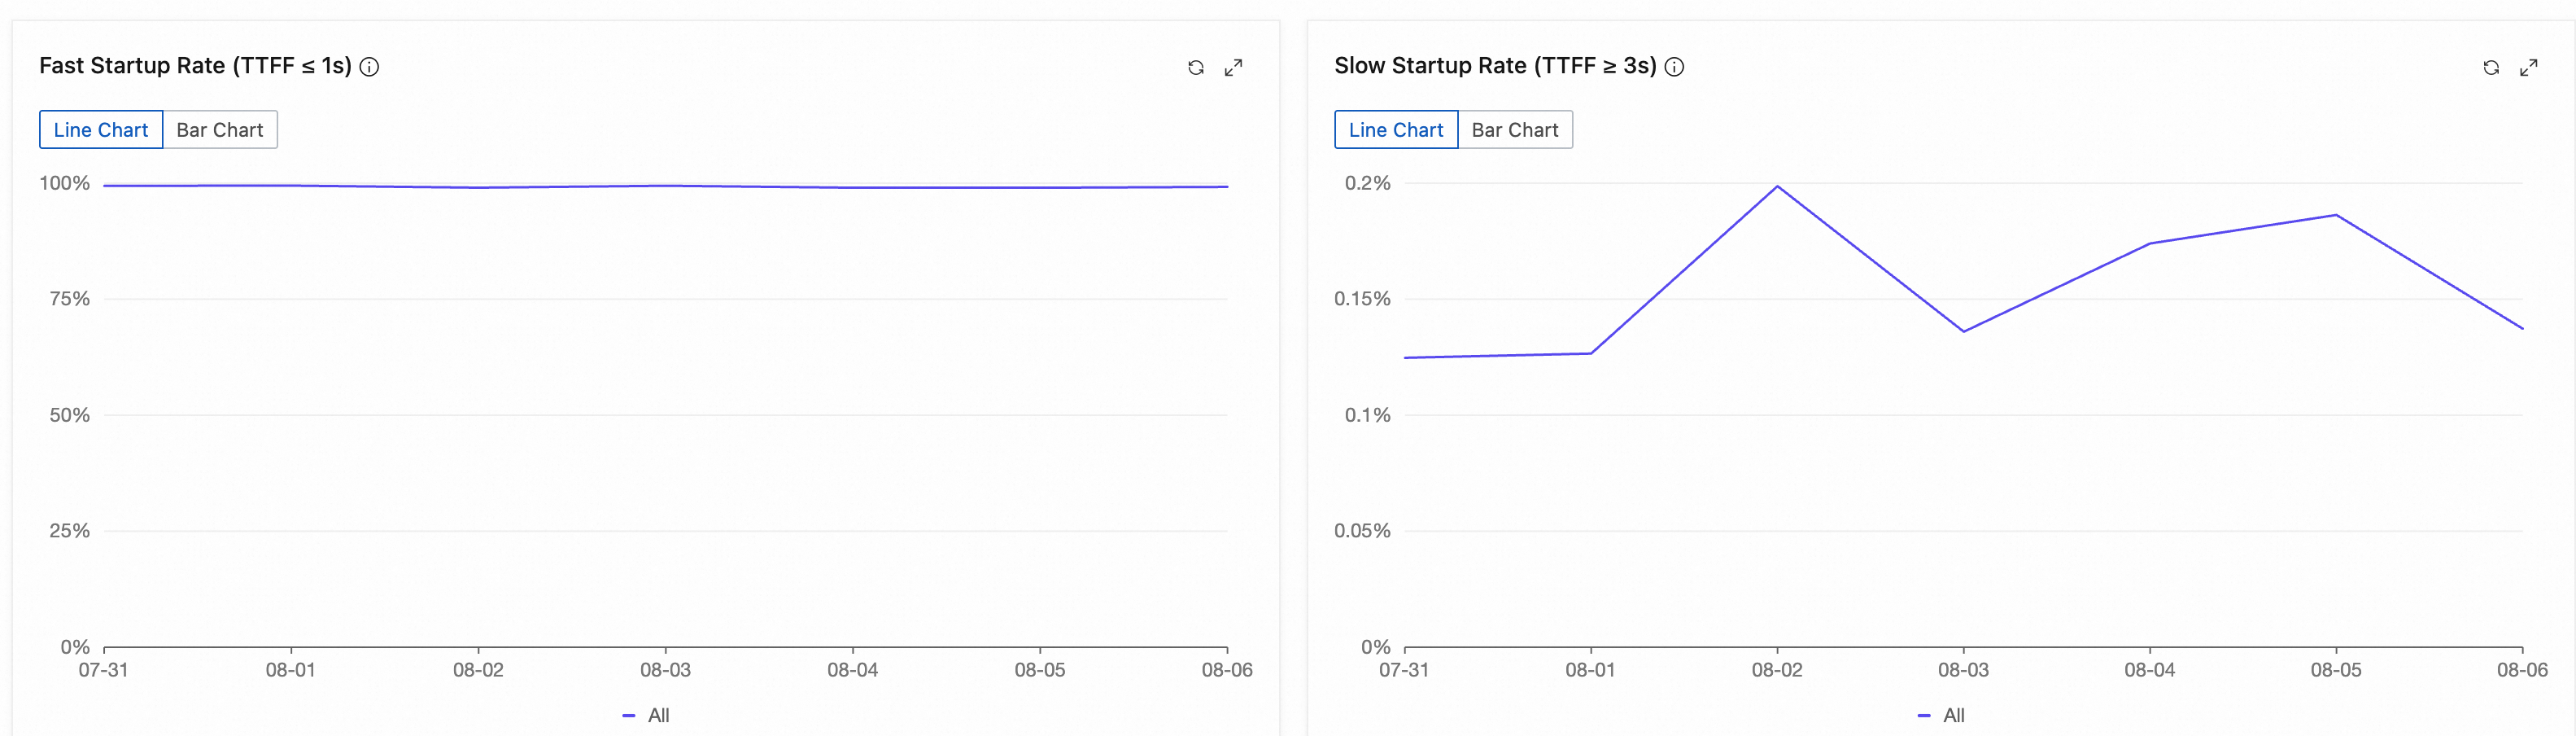
Click Query. The real-time data for the selected metrics is displayed in charts. You can also switch chart styles, refresh a single chart, and zoom in on a chart for a detailed view.
New and legacy version comparison
The new version of the playback quality dashboard expands on the legacy version with optimized and additional metrics for more comprehensive monitoring.
-
Metric trends: A new Metric Trends module supports period-over-period analysis of data at multiple granularities. The General Configurations module allows you to select a business region for fine-grained regional data analysis.
-
QoS metrics: In addition to the original core metrics such as playback failure rate, fast startup rate, and rebuffering rate, the new version adds more granular metrics for deeper playback performance analysis.
-
QoE metrics: Provides deeper insights into user experience, such as completion rate and average watch duration per user, helping your operations team better understand viewer behavior.
The new version also supports filtering data by multiple dimensions such as client type, OS type, resolution, and network type. You can define custom filter conditions including SDK version, video format, and hardware decoding for more detailed analysis.
✔️: Supported
❌: Not supported
—: Not applicable
|
Feature |
Metric |
Legacy monitoring |
New monitoring |
|
Quality of Service (QoS) |
❌ |
✔️ |
|
|
❌ |
✔️ |
||
|
✔️ |
✔️ |
||
|
❌ |
✔️ |
||
|
❌ |
✔️ |
||
|
❌ |
✔️ |
||
|
❌ |
✔️ |
||
|
❌ |
✔️ |
||
|
❌ |
✔️ |
||
|
❌ |
✔️ |
||
|
Quality of Experience (QoE) |
✔️ |
✔️ |
|
|
✔️ |
✔️ |
||
|
❌ |
✔️ |
||
|
❌ |
✔️ |
||
|
❌ |
✔️ |
||
|
✔️ |
✔️ |
||
|
❌ |
✔️ |
||
|
✔️ |
✔️ |
||
|
❌ |
✔️ |
||
|
❌ |
✔️ |
||
|
✔️ |
✔️ |
||
|
❌ |
✔️ |
||
|
❌ |
✔️ |