This document describes the definitions and calculation methods for the Quality of Service (QoS) and Quality of Experience (QoE) metrics on the playback quality dashboard.
How it works
The playback quality dashboard uses instrumentation data reported by the ApsaraVideo Player SDK. The following diagram shows the instrumentation logic.
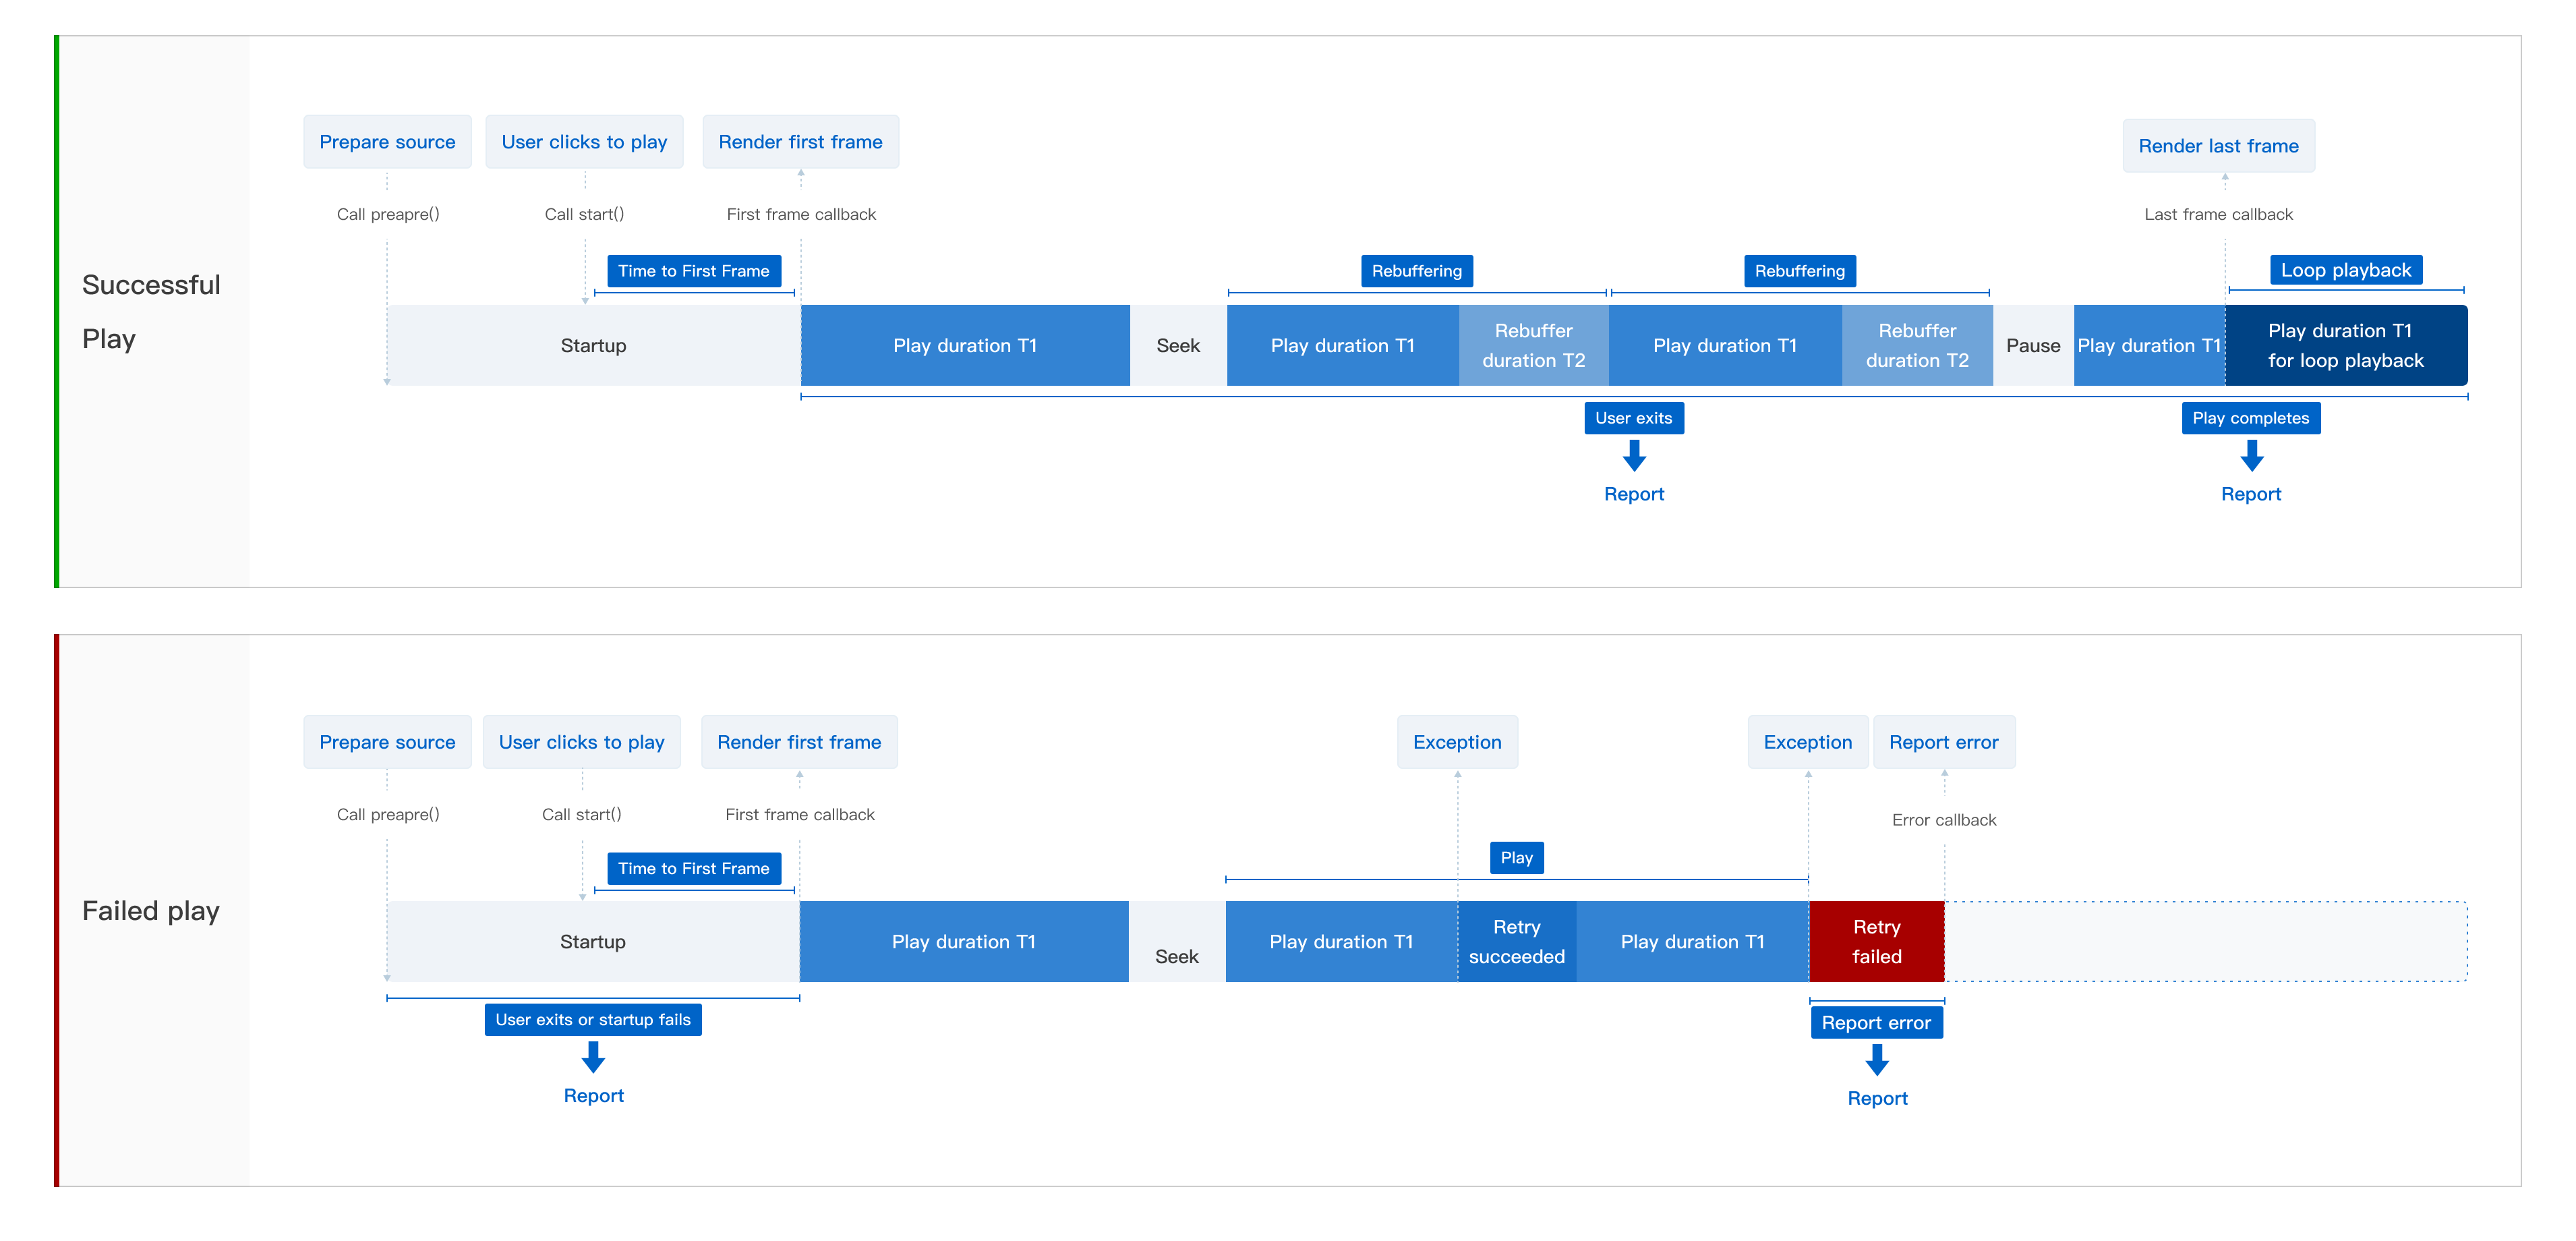
In the ApsaraVideo Player SDK for web, player initialization is equivalent to the
prepare()method, and theplay()method is equivalent to thestart()method.When you use autoplay by calling
setAutoPlay(true), playback starts as soon as the video source is ready. This is equivalent to a user clicking Play.The
prepare()method can run in the background. Actual playback is triggered by thestart()method.
Scenario | Reporting trigger | Metric description |
Successful playback |
|
|
Playback failure |
|
|
Core metrics
To quickly assess user experience and service health, focus on the most representative and impactful core metrics. This ensures that data drives efficient decision-making rather than causing information overload. You should monitor and optimize the following core metrics over the long term.
Core metrics include the following:
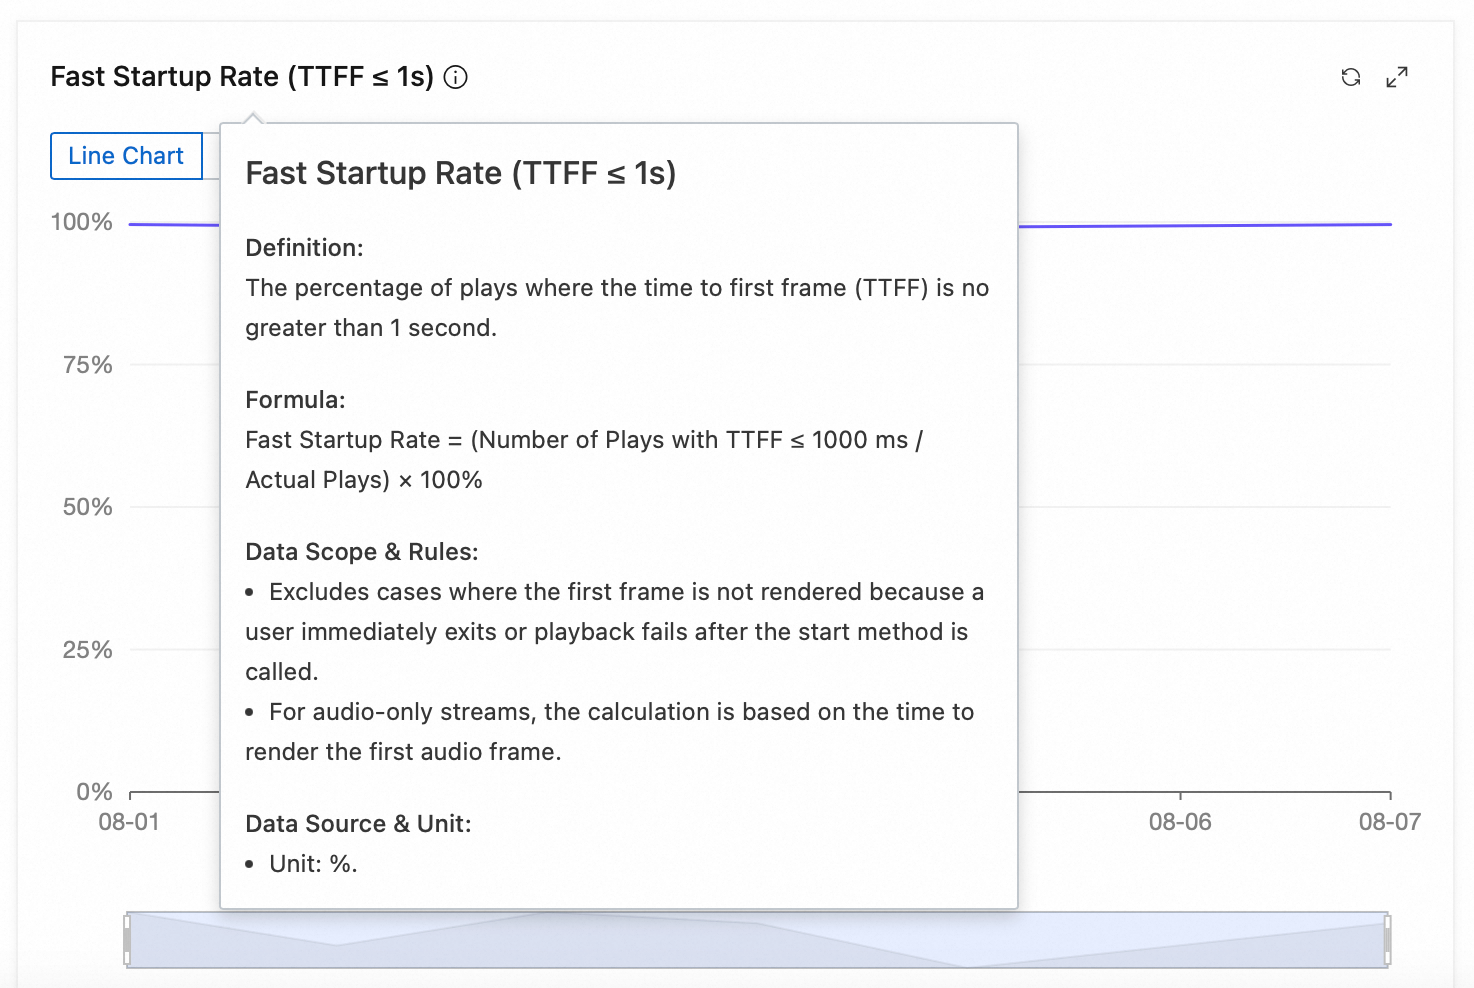
Fast startup rate: Measures the loading speed of the first frame. It is a core metric for evaluating the first-frame experience and directly affects user perception and retention. It is the primary metric for optimizing the playback experience.
Play failure ratio: Reflects the playback success rate. It is a core reference for judging the availability and stability of the playback service. Abnormal fluctuations can easily lead to user churn.
Rebuffer count rate: Assesses playback smoothness. Rebuffering issues affect the user's viewing experience and overall satisfaction. This is a key factor for optimizing the playback experience and improving user retention.
QoS metrics
You can view the metric definitions and detailed descriptions in the tooltips on the metric cards.
Performance metrics (Fast startup rate, Slow startup rate, Time to First Frame, Average seek duration)
In a video playback quality monitoring system, performance metrics are fundamental to evaluating the user experience. The four performance metrics, fast startup rate, slow startup rate, time to first frame, and average seek duration, directly reflect the performance of playback startup and control. Optimizing these metrics can significantly improve service smoothness and increase user engagement and satisfaction.
Fast startup rate
Slow startup rate
Time to First Frame
Average seek duration
Error metrics (Play failure ratio, Non-start ratio, Error count per 100s)
In a video playback quality monitoring system, error metrics are core indicators for assessing service availability and system stability. The three metrics, play failure ratio, non-start ratio, and error count per 100s, can accurately quantify various abnormal player behaviors. By efficiently monitoring and promptly responding to abnormal metrics, you can effectively ensure the user's viewing experience and improve the reliability and health of the platform's services.
Play failure ratio
Non-start ratio
Error count per 100s
Rebuffering metrics (Rebuffer count rate, Rebuffer duration per 100s, Rebuffer count per 100s)
In the playback quality monitoring system, rebuffering metrics reflect playback smoothness, which is important for user retention. The three metrics, rebuffer count rate, rebuffer duration per 100s, and rebuffer count per 100s, provide a comprehensive view of playback smoothness. Continuously monitoring and optimizing these metrics improves the playback experience, reduces interruptions, and increases user satisfaction.
Rebuffer count rate
Rebuffer duration per 100s
Rebuffer count per 100s
QoE metrics
You can view the metric definitions and detailed descriptions in the tooltips on the metric cards.

Viewing behavior metrics (Total plays, Actual plays, Completion count, Completion rate, 5-second bounce ratio)
In the playback quality monitoring system, viewing behavior metrics measure user engagement and content consumption depth. They are a key reference for evaluating content popularity, user stickiness, and business conversion efficiency. The five metrics, total plays, actual plays, completion count, completion rate, and 5-second bounce ratio, help businesses effectively plan content and optimize products.
Total plays
Actual plays
Completion count
Completion rate
5-second bounce ratio
User metrics (Unique users, Average play duration per user, Average plays per user, Average completion per user)
In the playback quality monitoring system, user metrics reflect overall user activity, content consumption habits, and engagement. Monitoring the four metrics, unique users, average play duration per user, average plays per user, and average completion per user, provides deep insights into content reception, user activity, and platform engagement.
Unique users
Average play duration per user
Average plays per user
Average completion per user
Average metrics (Average play duration, Average video duration, Average bitrate per start, Average bitrate per play)
In the playback quality monitoring system, average metrics are key reference data for evaluating user viewing behavior, content characteristics, and playback quality. By continuously tracking the four metrics, average play duration, average video duration, average bitrate per start, and average bitrate per play, you can comprehensively reflect the user's single-session viewing depth and the quality level of video playback.