Flow logs of virtual private clouds (VPCs) collect and record inbound and outbound traffic for elastic network interfaces (ENIs). Use flow logs for performance monitoring, troubleshooting, and cost optimization.
How it works

Flow logs support traffic collection at three levels, ENI, vSwitch, or VPC. If you create a flow log for a VPC or vSwitch, the system collects traffic from all associated ENIs within the VPC or vSwitch, including ENIs that are created after the flow log is created.
The system aggregates traffic information into flow log entries within each capture window, which is 10 minutes by default, and delivers the entries to Simple Log Service.
Each flow log entry records a 5-tuple network stream within a specific capture window. This includes the source and destination IP addresses, source and destination ports, and protocol. The following is an example:
eni-id | direction | srcaddr | srcport | protocol | dstaddr | dstport | ... |
eni-xxx | in | 10.0.0.1 | 53870 | 6 | 10.0.0.2 | 80 | ... |
eni-xxx | out | 10.0.0.2 | 80 | 6 | 10.0.0.1 | 53870 | ... |
For more information about all fields and their descriptions, see Log fields.
To reduce costs, collect traffic only from specific paths. The following paths are available:
Traffic to the Internet through an IPv4 gateway
Traffic through a NAT Gateway
Traffic through a VPN Gateway
Traffic through a transit router (TR)
Traffic to Alibaba Cloud services through a gateway endpoint
Traffic to an Express Connect circuit through a virtual border router (VBR)
Traffic through an Express Connect Router (ECR)
Traffic through a Gateway Load Balancer (GWLB) endpoint
Traffic to the Internet
Internet-facing Classic Load Balancer (CLB) is not supported.
The following are common use cases for flow logs:
Network monitoring: Monitor VPC throughput and performance, analyze traffic and trends for resources within a VPC, troubleshoot issues, and check the effectiveness of security groups or network ACLs.
Traffic cost reduction: Analyze transmission data to optimize traffic costs. For example, you can retrieve traffic data from a VPC to other regions, public IP addresses, or on-premises data centers and other cloud networks. You can also identify ECS instances within the VPC that generate high traffic volumes.
Network security analysis: In the event of a security incident, analyze inbound and outbound traffic information to identify suspicious IP addresses or investigate intrusion records.
Limits
Before using the flow log feature for the first time, perform the following operations:
On the Flow Log page, click Activate Now. If you have created flow log instances during the public preview, you still need to click Activate Now to view and manage these instances.
On the Flow Log page, click Authorize Now, and then click Authorize. This operation automatically creates a Resource Access Management (RAM) role named
AliyunVPCLogArchiveRoleand a RAM policy namedAliyunVPCLogArchiveRolePolicy. VPC uses this role and policy by default to access Simple Log Service and ensure that flow logs are written to the service.Activate Simple Log Service on the Simple Log Service product page.
After enabling flow logs, the first traffic capture for a newly created ENI may be delayed, typically by less than 10 minutes.
Flow logs do not support collecting Manage multicast traffic.
Manage flow logs
Console
Create a flow log
Go to the Flow Log page in the VPC console. Click Create a flow log. In the Create a flow log panel, configure the following parameters:
Collection Configuration:
Region: Select the region of the resource you want to monitor.
Resource Type and Resource Instance: Set the collection type to ENI, vSwitch, or VPC. If you select VPC or vSwitch, the system monitors the traffic of all ENIs within the selected resource.
Data Transfer Type: Select whether to capture traffic that is allowed or rejected by access control rules, such as security group and network ACL rules.
IP Version: Select IPv4 to capture only IPv4 traffic, or Dual-stack to capture both IPv4 and IPv6 traffic. The following regions support IPv6: China (Hangzhou), China (Shanghai), China (Qingdao), China (Beijing), China (Hohhot), China (Shenzhen), Singapore, US (Silicon Valley), and US (Virginia).
Sampling Interval (Minutes): The duration of the capture window for aggregating traffic information. Set the interval to 1, 5, or 10 minutes. A shorter interval generates flow logs more frequently, letting you locate issues faster. A longer interval provides less timely data but reduces the number of log entries and saves costs.
For example, for a TCP session that maintains a persistent connection, a 1-minute window produces 60 log records per hour, while a 10-minute window produces only 6 log records.
If multiple flow log instances in a VPC collect traffic from the same ENI, the shortest sampling interval among all instances is used as the actual capture window.
Sampling Path: Select specific collection scenarios to reduce usage costs. Deselect the default All Scenarios option first.
You can select traffic that passes through the following network elements: IPv4 Gateway, NAT Gateway, VPN Gateway, Transit Routers (TRs), Gateway Endpoint, virtual border router (VBR), Express Connect Router (ECR), Gateway Load Balancer (GWLB) Endpoint, and traffic to the Internet.
Analysis and Delivery: Deliver to Simple Log Service or NIS Traffic Analyzer. If you choose Simple Log Service, you must select it at creation time. Once turned off, it can’t be turned on again.
Deliver to Log Service:
Select a project and a Logstore. For the first flow log, we recommend clicking Create Project and Create Logstore to isolate the data. To consolidate multiple flow logs for centralized analysis, select the same Logstore.
Enable Log Analysis Report: This feature automatically Create indexes and Quickly create a dashboard for the LogStore that contains your flow logs. This lets you perform SQL and visualization analysis on them. When enabled, this feature Billable items of the pay-by-feature billing model for the SLS product.
Enable NIS Traffic Analysis: Pick an NIS Traffic Analyzer to run traffic analysis. If nothing appears in the drop-down list, create an analyzer first. Ensure the analyzer Sampling Interval is higher than that of the flow log.
After creating the flow log, traffic collection starts automatically. You can then Analyze flow logs.
Start or stop a flow log
On the Flow Log page in the VPC console, find the target flow log and click Start or Stop in the Actions column.
After you stop a flow log, VPC no longer charges flow log generation fees. However, Simple Log Service continues to Billing for storing the existing flow logs.
Delete a flow log
On the Flow Log page in the VPC console, find the target flow log, and in the Actions column, click Delete.
After deleting a flow log, VPC no longer charges flow log generation fees. However, Simple Log Service continues to Billing for storing the existing flow logs. To stop all charges, you must Manage a Logstore in the Simple Log Service console.
API
Before creating a flow log, make sure you have activated the flow log feature and created a project and a Logstore in SLS:
Call OpenFlowLogService to enable the flow log feature.
Call CreateProject to create a project, and call CreateLogStore to create a Logstore.
After you meet these prerequisites, you can perform the following operations:
Call CreateFlowLog to create a flow log, and optionally call CreateIndex to create an index.
Call DeactiveFlowLog to stop a flow log.
Call ActiveFlowLog to start a flow log.
Call DeleteFlowLog to delete a flow log.
Terraform
Resources: alicloud_log_project, alicloud_log_store, alicloud_vpc_flow_log
# Specify the region where you want to create the flow log.
provider "alicloud" {
  region = "cn-hangzhou"
}

# Specify the description of the project, and the names of the Logstore and flow log.
variable "name" {
  default = "vpc-flowlog-example"
}

# Generate a random number to create a project name.
resource "random_uuid" "example" {
}

# Create a Simple Log Service project.
resource "alicloud_log_project" "example" {
  project_name = substr("tf-example-${replace(random_uuid.example.result, "-", "")}", 0, 16)
  description  = var.name
}

# Create a Simple Log Service Logstore.
resource "alicloud_log_store" "example" {
  project_name          = alicloud_log_project.example.project_name
  logstore_name         = var.name
  shard_count           = 3
  auto_split            = true
  max_split_shard_count = 60
  append_meta           = true
}

# Create a VPC flow log.
resource "alicloud_vpc_flow_log" "example" {
  flow_log_name        = var.name
  log_store_name       = alicloud_log_store.example.logstore_name
  description          = var.name
  traffic_path         = ["all"] # Collect traffic from all scenarios.
  project_name         = alicloud_log_project.example.project_name
  resource_type        = "VPC" # The resource type is VPC.
  resource_id          = "vpc-bp1ekmgzch0bo3hxXXXXXX" # The ID of the VPC.
  aggregation_interval = "1" # The capture window is 1 minute.
  traffic_type         = "All" # Collect all traffic, regardless of whether it is allowed or rejected by access control.
}
Analyze flow logs
Analyzing flow logs helps you monitor network performance, troubleshoot issues, optimize traffic costs, and perform network security analysis.
Console
Custom analysis through Logstore
Go to the Flow Log page in the VPC console. In the Simple Log Service column of the target flow log, click the Logstore to open the details page. On this page, you can:
View the details of flow log entries in Raw Logs.
Enter a statement to query and analyze logs.

Analysis using templates on Flow Log Center
The Flow Log Center provides a set of visualization templates to help you analyze VPC flow logs. The templates support VPC policy statistics, ENI traffic statistics, and traffic statistics between CIDR blocks.
Go to the Flow Log Center and click Add in the upper-right corner.
In the Create Instance panel, enter an Instance Name, select the Project and Logstore that contain the existing flow log, and click OK.
After you create an instance, click its instance ID in the Flow Log Center. On the Flow Log Details page, you can view and analyze the flow log information.

The Monitoring Center provides the following dashboards and custom query features:
Overview: Displays trends for accepted and rejected flow logs and for inbound and outbound traffic, the total number of packets and bytes for each VPC and ENI, and the geographical distribution of source and destination IP addresses.
Policy Statistics: Displays trends for accepted and rejected connections, statistics for accepted and rejected connections based on 5-tuple, which is a collection of a source IP, source port, protocol type, destination IP, and destination port.
Accept: Traffic that is allowed by security groups and network ACLs.
Reject: Traffic that is rejected by security groups and network ACLs.
ENI Traffic: Displays the inbound and outbound traffic for ENIs.
Inter-ECS Traffic: Traffic between ECS instances.
Custom Query: For more information, see Get started.
Enable inter-domain analysis (optional): On the Flow Log Details page, click CIDR Block Settings. Then, on the CIDR Block Settings tab, turn on the Inter-Domain Analysis switch.
After enabling the inter-domain analysis feature, the system automatically creates a data transformation task. This task generates VPC flow logs that include CIDR block details for analyzing traffic between CIDR blocks. The data transformation feature Billable items of the pay-by-feature billing model.
Simple Log Service has multiple predefined CIDR blocks, as shown in the following figure. To analyze traffic between CIDR blocks, enable the inter-domain analysis feature. You can also add custom CIDR blocks based if necessary.

The Inter-Domain Analysis feature provides the following dashboards and custom queries:
Inter-domain Traffic: Traffic between CIDR blocks.
ECS-to-Domain Traffic: Traffic from ECS instances to destination CIDR blocks.
Threat Intelligence: Displays threat intelligence about the source and destination IP addresses.
Custom Query: Query and analyze VPC flow logs that include CIDR block information.
API
Call GetLogsV2 to query and analyze flow logs.
Examples
Below are four typical use cases of flow logs.
Source IPs

As shown in the figure, assume that you have created a web server that is accessible from the Internet over port 80 and you have used security group rules to restrict access from source IPs.
You can create a flow log to query the source IPs that access port 80 and count the access requests that are allowed or rejected by the security group.
Create a flow log
For Resource Instance, select the web server's ENI.
Set Data Transfer Type to All Traffic.
To configure delivery, select Deliver to Log Service and Enable Log Analysis Report.
Retain the default values for other parameters.
Analyze the flow logs
Query and analysis statement
Filter source IPs that access port 80 of 10.0.0.1, and display the number of times each IP is allowed and rejected by the security group:
dstaddr:10.0.0.1 AND dstport:80 | SELECT -- Filter logs where the destination IP address is 10.0.0.1 and the destination port is 80.
srcaddr,
SUM(CASE WHEN action = 'ACCEPT' THEN 1 ELSE 0 END) AS accept_count, -- Count 1 for each ACCEPT (allowed) action.
SUM(CASE WHEN action = 'REJECT' THEN 1 ELSE 0 END) AS reject_count -- Count 1 for each REJECT (denied) action.
FROM log
GROUP BY srcaddr -- Group by source IP address.
ORDER BY accept_count + reject_count DESC -- Sort the results in descending order based on the total number of allowed and denied actions.
Preview

As shown in the figure, the
srcaddrcolumn displays the source IPs that access port 80. Theaccept_countandreject_countcolumns show the flow log entries for each source IP allowed and rejected by the security group within the query time range.Five source IPs accessed port 80: 120.26.XX.XX, 121.43.XX.XX, 154.212.XX.XX, 176.65.XX.XX, and 198.235.XX.XX.
All requests from 120.26.XX.XX were allowed, while all requests from the other public IP addresses were rejected.
Ttraffic between ECS instances
Item | ECS instances in a VPC | ECS instances in different VPCs |
Diagram |  |  |
Description | Assume that you have deployed three ECS instances in one VPC, and there is traffic between the ECS instances. Use the flow log feature to analyze the traffic rate and trends between the ECS instances. | You have two VPCs in different regions, and each VPC has multiple ECS instances. The two VPCs are connected using a VPC peering connection. The peering connection is billed on a pay-as-you-go basis for Cloud Data Transfer (CDT). You notice that the inter-region data transfer fee has significantly increased. Use flow logs to identify the ECS instances that generate high volumes of traffic and reduce traffic costs. |
Flow log configuration |
|
|
Query and statement | Query the traffic rate trends between ECS1 and other ECS instances: | Query the session traffic rate trends between the two VPCs: |
Preview |
The traffic rate from 10.0.0.1 to 10.0.0.2 is the highest, at approximately 1.4 Mbps. The traffic rate from 10.0.0.1 to 10.0.0.3 is the second highest, at approximately 700 Kbps. Other traffic accounts for a small proportion. |
As shown in the figure, the traffic from 10.0.0.1 to 172.16.0.1 is a traffic spike of approximately 6 Mbps. |


Internet NAT gateway traffic

You have multiple ECS instances in a region. All instances are deployed in the same vSwitch and access the Internet through the SNAT feature of an Internet NAT gateway.
You notice that the volume of NAT traffic to the Internet has significantly increased, which causes slow server responses. Use flow logs to identify the ECS instances that generate a high proportion of the traffic.
Create a flow log
For Resource Instance, select
vSwitch 2, the vSwitch for the Internet NAT gateway.In the delivery configuration, select Deliver to Log Service and Enable Log Analysis Report.
Retain the default values for other parameters.
Filter specific traffic paths
To filter traffic on specific paths, you must specify conditions in the query statement:
Diagram
No.
Filter method

1
Filter traffic from an ECS instance to the NAT gateway: Set
directionto in andsrcaddrto the private IP address of the ECS instance.2
Filter traffic from the NAT gateway to the Internet: Set
directionto out andsrcaddrto the private IP address of the NAT gateway.3
Filter traffic from the Internet to the NAT gateway: Set
directionto in anddstaddrto the private IP address of the NAT gateway.4
Filter traffic from the NAT gateway to an ECS instance: Set
directionto out anddstaddrto the private IP address of the ECS instance.Analyze the flow logs
Query and analysis statement
On the path from an ECS instance to the NAT gateway, analyze traffic to a specific public IP address:
direction: 'in' and srcaddr: 10.0.0.* and dstaddr: 120.26.XX.XX | select -- Filter logs of ECS instances that access a specific public IP address. date_format(from_unixtime(__time__ - __time__% 60), '%H:%i:%S') as time, srcaddr, -- Convert the UNIX timestamp to a readable time format. sum(bytes*8/60) as bandwidth -- Convert bytes to bits and divide by the 1-minute capture window. group by time,srcaddr -- Group by time and source IP address. order by time asc -- Sort by time in ascending order. limit 100 -- Display the first 100 results.Preview

As shown in the figure, on the path from the ECS instance to the NAT gateway, the traffic rate from 10.0.0.1 (ECS1) to the public IP address 120.26.XX.XX is the highest, at approximately 12 Kbps.
Traffic in Express Connect circuit

An enterprise uses two VPCs in an Alibaba Cloud region to deploy different services. It connects its on-premises data center to Alibaba Cloud using an Express Connect circuit and CEN.
The IT department plans to use flow logs to monitor and analyze how traffic from different services in the VPCs uses the Express Connect circuit. This analysis helps with network resource planning and performance improvements.
Create a flow log
Create two flow logs that deliver data to the same Logstore. The key parameters for each flow log are as follows:
For Resource Instance, under VPC, select VPC1 and VPC2.
Set Sampling Path to Traffic Through Transit Routers.
In the delivery configuration, select Deliver to Log Service, choose the same Logstore for both flow logs, and select Enable Log Analysis Report.
Retain the default values for other parameters.
Analyze the flow logs
Query and analysis statement
Analyze the proportion of traffic that flows to the on-premises data center:
action: ACCEPT and srcaddr: 192.168.* and dstaddr:10.1.* | WITH vpc1_traffic AS ( SELECT date_trunc('minute',__time__) AS minute, SUM(bytes*8/(case WHEN "end"-start=0 THEN 1 else "end"-start end)) AS total_vpc1_traffic FROM log WHERE srcaddr LIKE '192.168.20.%' GROUP BY date_trunc('minute',__time__) ), vpc2_traffic AS ( SELECT date_trunc('minute',__time__) AS minute, SUM(bytes*8/(case WHEN "end"-start=0 THEN 1 else "end"-start end)) AS total_vpc2_traffic FROM log WHERE srcaddr LIKE '192.168.10.%' GROUP BY date_trunc('minute',__time__) ) SELECT COALESCE(vpc1_traffic.minute, vpc2_traffic.minute) AS minute, (COALESCE(vpc1_traffic.total_vpc1_traffic, 0) * 100/ NULLIF((COALESCE(vpc1_traffic.total_vpc1_traffic, 0) + COALESCE(vpc2_traffic.total_vpc2_traffic, 0)), 0)) AS vpc1_percentage, (COALESCE(vpc2_traffic.total_vpc2_traffic, 0) * 100/ NULLIF((COALESCE(vpc1_traffic.total_vpc1_traffic, 0) + COALESCE(vpc2_traffic.total_vpc2_traffic, 0)), 0)) AS vpc2_percentage FROM vpc1_traffic FULL OUTER JOIN vpc2_traffic ON vpc1_traffic.minute = vpc2_traffic.minute ORDER BY minutePreview
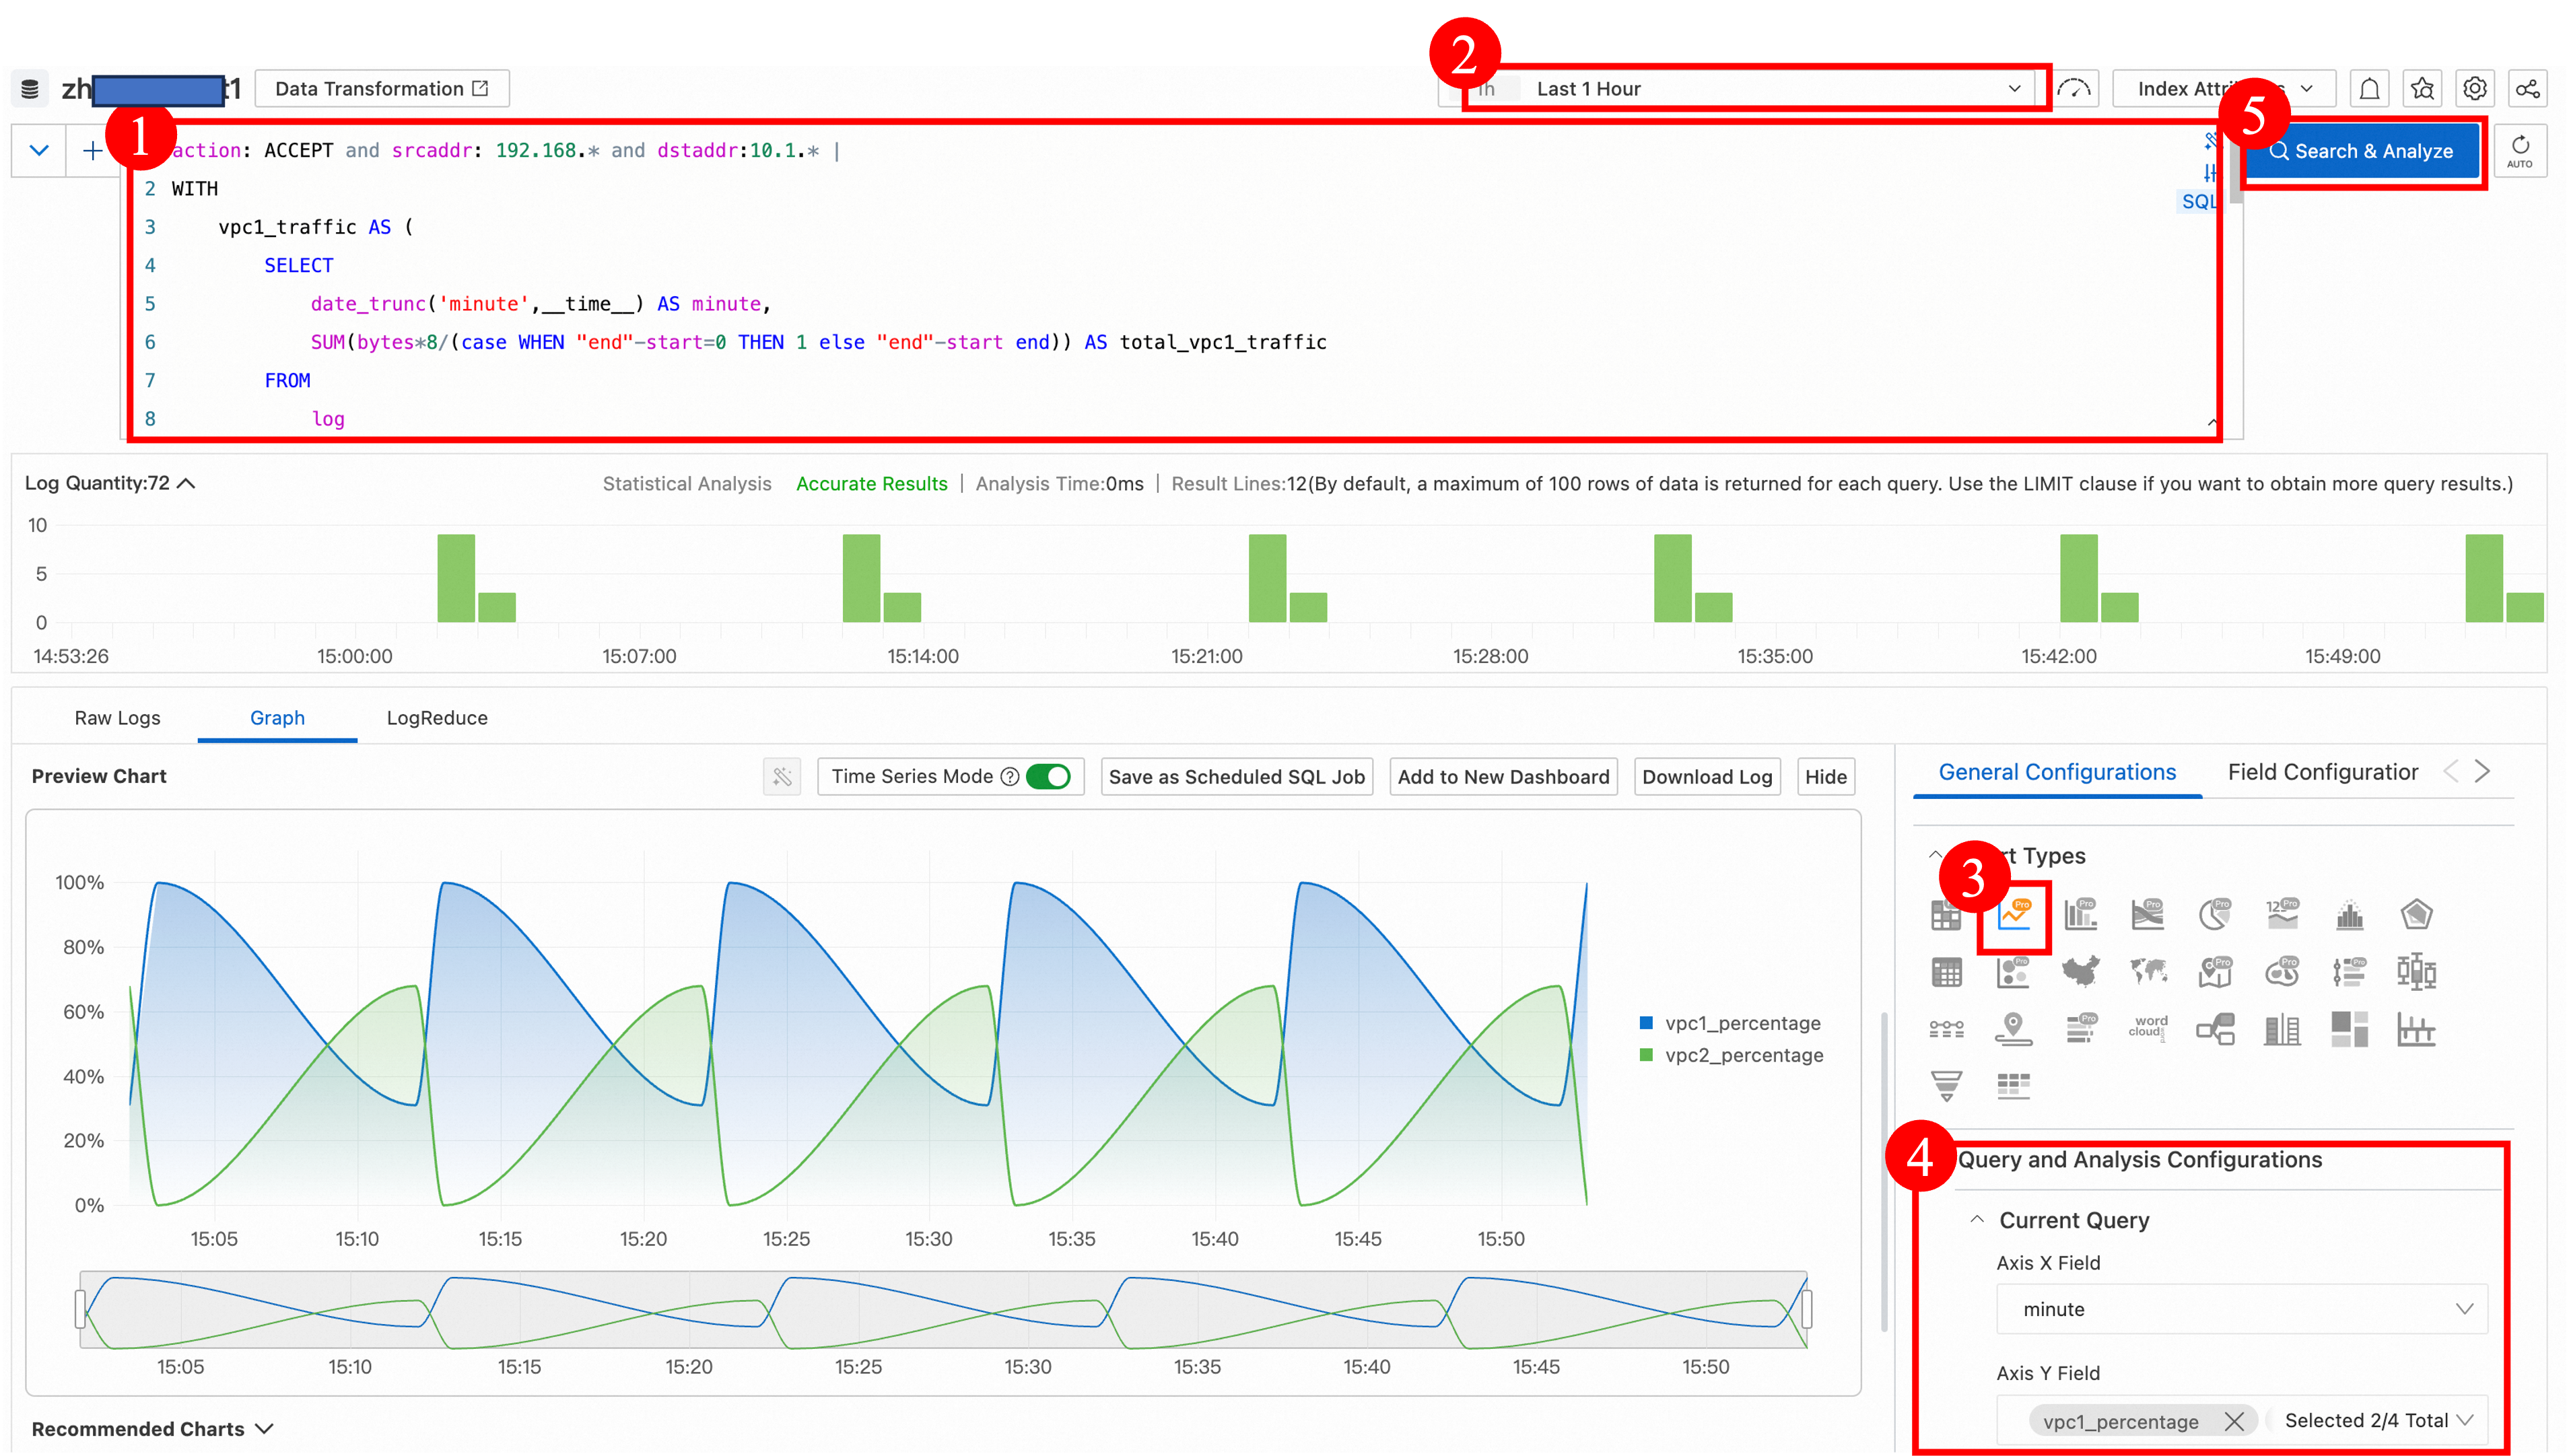
During the period from 14:50 to 15:50, the proportion of traffic from VPC1 that flows to the on-premises data center is high.
More information
Log fields
The following table describes the fields in an entry.
The value of inapplicable fields is displayed as -.Field | Description |
version | The flow log version. The version of all log entries is |
account-id | The ID of the Alibaba Cloud account. |
eni-id | The ID of the ENI. |
vm-id | The ID of the ECS instance to which the ENI is attached. |
vswitch-id | The ID of the vSwitch to which the ENI belongs. |
vpc-id | The ID of the VPC to which the ENI belongs. |
type | The traffic type. Valid values: IPv4 and IPv6. The following regions support the collection of Dual-stack traffic: China (Hangzhou), China (Shanghai), China (Qingdao), China (Beijing), China (Hohhot), China (Shenzhen), Singapore, US (Silicon Valley), and US (Virginia). |
protocol | The IANA protocol number of the traffic. Examples of common protocol numbers: 1 for ICMP, 6 for TCP, and 17 for UDP. |
srcaddr | The source IP address. |
srcport | The source port. |
dstaddr | The destination IP address. |
dstport | The destination port. |
direction | The traffic direction:
|
action | Whether the access is allowed by a security group or network ACL:
|
packets | The number of packets. |
bytes | The number of bytes. |
start | The time when the first packet was received in the capture window. The format is UNIX timestamp. |
end | For a persistent connection, this is the time when the capture window ends. For a short-lived connection, this is the time when the connection is closed. The format is UNIX timestamp. |
tcp-flags | The TCP flags represented in decimal, which reflect the combination of flags such as SYN, ACK, and FIN in the TCP protocol. A flow log entry in the capture window may correspond to multiple TCP packets. This value is the result of a For example, if a TCP session has two packets in a capture window with SYN (2) and SYN-ACK (18) flags, the TCP flag field recorded in the log is 18 (2 | 18 = 18). The following are some TCP flags and their decimal values:
For more information about TCP flags, such as the meanings of SYN, FIN, ACK, and RST flags, see RFC: 793. |
log-status | The log record status:
|
traffic_path | The scenario where the traffic occurs:
|
The following sections provide examples of flow log entries:
Allowed traffic
In this example, the Alibaba Cloud account ID is 1210123456****** and the VPC flow log version is 1. During the 1-minute interval between 17:10:20 and 17:11:20 on July 12, 2024, the ENI eni-bp166tg9uk1ryf****** allowed the following outbound traffic:
The source address 172.31.16.139 and port 1332 transmitted 10 packets to the destination address 172.31.16.21 and port 80 over TCP (6 indicates TCP). The total size of the packets is 2,048 bytes. The log status is normal, and no exceptions occurred.
{
  "account-id": "1210123456******",
  "action": "ACCEPT",
  "bytes": "2048",
  "direction": "out",
  "dstaddr": "172.31.16.21",
  "dstport": "80",
  "end": "1720775480",
  "eni-id": "eni-bp166tg9uk1ryf******",
  "log-status": "OK",
  "packets": "10",
  "protocol": "6",
  "srcaddr": "172.31.16.139",
  "srcport": "1332",
  "start": "1720775420",
  "tcp-flags": "22",
  "traffic_path": "-",
  "version": "-",
  "vm-id": "1",
  "vpc-id": "-",
  "vswitch-id": "vpc-bp1qf0c43jb3maz******"
}
Rejected traffic
In this example, the Alibaba Cloud account ID is 1210123456****** and the VPC flow log version is 1. During the 10-minute interval between 10:20:00 and 10:30:00 on July 15, 2024, the ENI eni-bp1ftp5sm9oszt****** rejected the following inbound traffic:
The source address 172.31.16.139 and port 1332 transmitted 20 packets to the destination address 172.31.16.21 and port 80 over TCP (6 indicates TCP). The total size of the packets is 4,208 bytes. The log status is normal, and no exceptions occurred.
{
  "account-id": "1210123456******",
  "action": "REJECT",
  "bytes": "4208",
  "direction": "in",
  "dstaddr": "172.31.16.21",
  "dstport": "80",
  "end": "1721010600",
  "eni-id": "eni-bp1ftp5sm9oszt******",
  "log-status": "OK",
  "packets": "20",
  "protocol": "6",
  "srcaddr": "172.31.16.139",
  "srcport": "1332",
  "start": "1721010000",
  "tcp-flags": "22",
  "traffic_path": "-",
  "version": "-",
  "vm-id": "1",
  "vpc-id": "-",
  "vswitch-id": "vpc-bp1qf0c43jb3maz******"
}
No data
In this example, the Alibaba Cloud account ID is 1210123456****** and the VPC flow log version is 1. During the 3-minute period from 10:52:20 to 10:55:20 on July 15, 2024, no traffic data (NODATA) was recorded for the ENI eni-bp1j7mmp34jlve******.
{
  "account-id": "1210123456******",
  "action": "-",
  "bytes": "-",
  "direction": "-",
  "dstaddr": "-",
  "dstport": "-",
  "end": "1721012120",
  "eni-id": "eni-bp1j7mmp34jlve******",
  "log-status": "NODATA",
  "packets": "-",
  "protocol": "-",
  "srcaddr": "-",
  "srcport": "-",
  "start": "1721011940",
  "tcp-flags": "-",
  "traffic_path": "-",
  "version": "-",
  "vm-id": "1",
  "vpc-id": "-",
  "vswitch-id": "vpc-bp1qf0c43jb3maz******"
}
Skipped records
In this example, the Alibaba Cloud account ID is 1210123456****** and the VPC flow log version is 1. During the 3-minute period from 16:20:30 to 16:23:30 on July 12, 2024, data records for the ENI eni-bp1dfm4xnlpruv****** were skipped (SKIPDATA).
{
  "account-id": "1210123456******",
  "action": "-",
  "bytes": "-",
  "direction": "-",
  "dstaddr": "-",
  "dstport": "-",
  "end": "1720772610",
  "eni-id": "eni-bp1dfm4xnlpruv******",
  "log-status": "SKIPDATA",
  "packets": "-",
  "protocol": "-",
  "srcaddr": "-",
  "srcport": "-",
  "start": "1720772430",
  "tcp-flags": "-",
  "traffic_path": "-",
  "version": "-",
  "vm-id": "1",
  "vpc-id": "-",
  "vswitch-id": "vpc-bp1qf0c43jb3maz******"
}
Billing
Billing items
The billing for flow logs includes flow log generation fees, service fees, and (if enabled) Traffic Analyzer traffic processing, analysis, and storage fees.

Log generation fees
The billing cycle and bill generation cycle are both 1 hour. Bills are typically generated 3 to 4 hours after a billing cycle ends. The exact time that a bill is issued is determined by the system.
This fee is billed based on the monthly volume of logs collected in each region and uses a tiered pricing model. Each Alibaba Cloud account receives a free quota of 5 GB per month in each region.
Monthly log volume
Price (USD/GB)
0 TB to 10 TB (inclusive)
0.37
10 TB to 30 TB (inclusive)
0.185
30 TB to 50 TB (inclusive)
0.074
More than 50 TB
0.037
Log service fee: Charged by Simple Log Service after flow logs are delivered. This fee includes Billing overview.
Two billing methods are available, pay-by-data-volume and pay-by-feature. If you create a flow log in the VPC console and choose to create a new Logstore, the pay-by-feature billing method is used by default.
Traffic Analyzer fee: Charges, including traffic processing, analysis, and storage fees, apply after flow logs are delivered to Traffic Analyzer and are billed by NIS.
Billing examples
Example 1
Assume that you enable the flow log feature at 00:00:00 on September 1, 2022 in a region. From 00:00:00 on September 1, 2022 to 00:00:00 on October 1, 2022, a total of 3 GB of logs are delivered to Simple Log Service.
Each Alibaba Cloud account has a free quota of 5 GB per month for flow log generation fees. Therefore, your total flow log fee for the month is equal to the Simple Log Service fee.
Example 2
You enable the flow log feature at 00:00:00 on September 1, 2022 in the China (Shanghai) region. From 00:00:00 on September 1, 2022 to 00:00:00 on October 1, 2022, 100 GB of logs are delivered to Simple Log Service.
The flow log generation fee for the month is (100 - 5) × 0.37 = USD 35.15. The total flow log fee for the month is USD 35.15 + Simple Log Service fee.
Example 3
You enable the flow log feature at 00:00:00 on September 1, 2022 in the China (Beijing) region. From 00:00:00 on September 1, 2022 to 00:00:00 on October 1, 2022, 60 TB of logs are delivered to Simple Log Service.
The flow log generation fee is calculated based on the tiered pricing model:
0 TB to 10 TB (inclusive): (10 × 1024 - 5) × 0.37 = USD 3,786.95
10 TB to 30 TB (inclusive): 20 × 1024 × 0.185 = USD 3,788.8
30 TB to 50 TB (inclusive): 20 × 1024 × 0.074 = USD 1,515.52
More than 50 TB: 10 × 1024 × 0.037 = USD 378.88
The total flow log generation fee for the month is 3,786.95 + 3,788.8 + 1,515.52 + 378.88 = USD 9,470.15. The total fee for the month is USD 9,470.15 + Simple Log Service fee.
Overdue payments and top-ups
Supported regions
Area | Regions |
Asia Pacific - China | China (Hangzhou), China (Shanghai), China (Qingdao), China (Beijing), China (Zhangjiakou), China (Hohhot), China (Ulanqab), China (Shenzhen), China (Heyuan), China (Guangzhou), China (Chengdu), China (Hong Kong), and China (Fuzhou - Local Region, Closing Down) |
Asia Pacific - Others | Japan (Tokyo), South Korea (Seoul), Singapore, Malaysia (Kuala Lumpur), Indonesia (Jakarta), Philippines (Manila), and Thailand (Bangkok) |
Europe & Americas | Germany (Frankfurt), UK (London), US (Silicon Valley), and US (Virginia) |
Middle East | UAE (Dubai) and SAU (Riyadh - Partner Region) |
Quotas
Quota name | Description | Default limit | Adjustable |
vpc_quota_flowlog_inst_nums_per_user | Flow log instances per account. | 10 | Yes. Go to the Quota Management page or Quota Center to request a quota increase. |
FAQ
How long are VPC flow logs retained?
VPC flow logs are automatically delivered to Simple Log Service and are subject to its data retention policy.
If you select Enable Log Analysis Report when you create a VPC flow log, the default data retention period for the Logstore is 7 days. Otherwise, the default retention period is 300 days.
You can Manage a Logstore in the Simple Log Service console and modify it as needed.