Prometheus's built-in time series database is single-node, with limited scalability and reliability. By using TSDB for InfluxDB® as a remote storage backend, Prometheus can offload read and write operations to a managed, high-performance store without changing your existing monitoring setup.
How it works
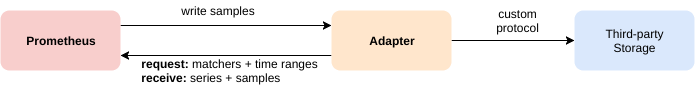
Prometheus uses protocol buffers (protobuf) over HTTP to communicate with remote storage systems. TSDB for InfluxDB® implements two HTTP endpoints that accept Prometheus's native read and write protocol directly—no additional adapter is needed:
-
/api/v1/prom/read -
/api/v1/prom/write
When Prometheus scrapes a target or runs a query, it forwards the data to these endpoints. TSDB for InfluxDB® stores the data using its own retention policy engine and responds to read requests in the format Prometheus expects.
Prerequisites
Before you begin, ensure that you have:
-
A TSDB for InfluxDB® instance
-
A database and an account on the instance. See Manage user accounts and databases
-
Prometheus installed. See the Prometheus download page
Configure Prometheus
The steps below use Linux as the example operating system. The same configuration applies to other operating systems.
Step 1: Add remote storage endpoints to prometheus.yml
Open the prometheus.yml configuration file with a text editor such as Vim. Add the following lines to the end of the file:
remote_write:
  - url: "https://ts-1234abcd.influxdata.rds.aliyuncs.com:3242/api/v1/prom/write?db=prometheus&u=prom&p=mypassword"

remote_read:
  - url: "https://ts-1234abcd.influxdata.rds.aliyuncs.com:3242/api/v1/prom/read?db=prometheus&u=prom&p=mypassword"
Replace the placeholder values before saving:
| Placeholder | Description | Example |
|---|---|---|
ts-1234abcd.influxdata.rds.aliyuncs.com |
Public endpoint of your TSDB for InfluxDB® instance | ts-bp1xxxxxx.influxdata.rds.aliyuncs.com |
prometheus (the db= value) |
Name of the database you created | prometheus |
prom (the u= value) |
Username of your database account | |
mypassword (the p= value) |
Password of your database account |
Step 2: Start Prometheus
Save the configuration file and start Prometheus:
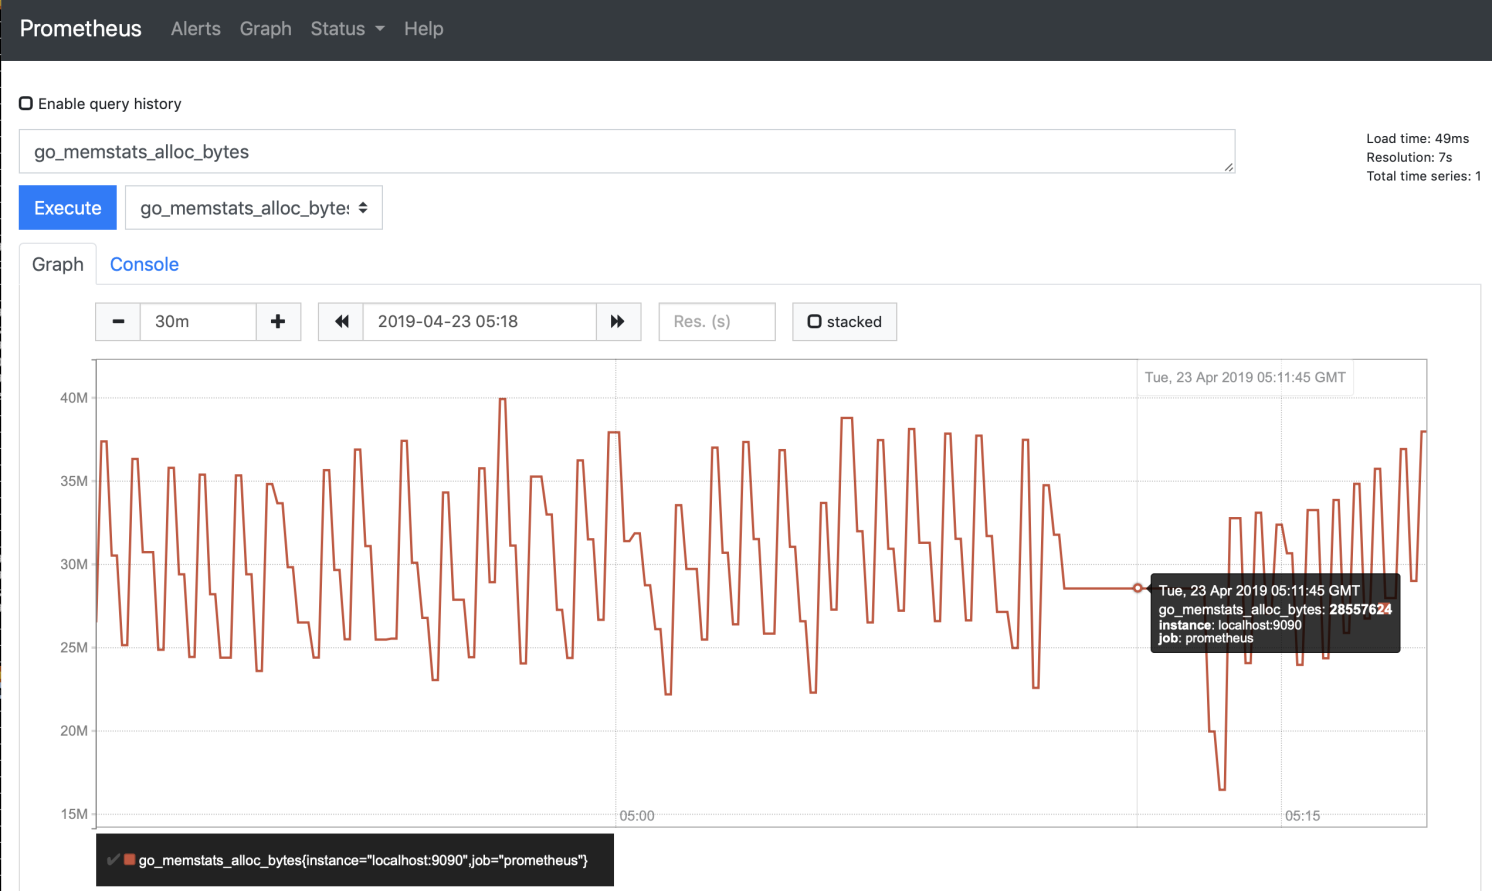
./prometheus --config.file=prometheus.ymlAfter Prometheus starts, open a browser and go to http://localhost:9090 to verify the service is running. The default port is 9090.