Cost analysis lets you visualize and analyze your cloud spending across multiple dimensions and forecast future costs.
View cost trends
If you have multiple accounts, use Account Linking to link them. The main account can then log on to the Expenses and Costs console and navigate to Cost Management > cost analysis to view cost data from any or all linked accounts.
Cost analysis data is updated daily, with a one-day delay.
When the cost type is "Amortized Payable Amount", you cannot view data by the hour or group it by instance ID.
Cost predictions use your historical pay-as-you-go spending to forecast future pay-as-you-go costs. The forecast may differ from your actual costs and is for reference only. You can forecast costs for up to 12 months. For more information, see cost prediction.
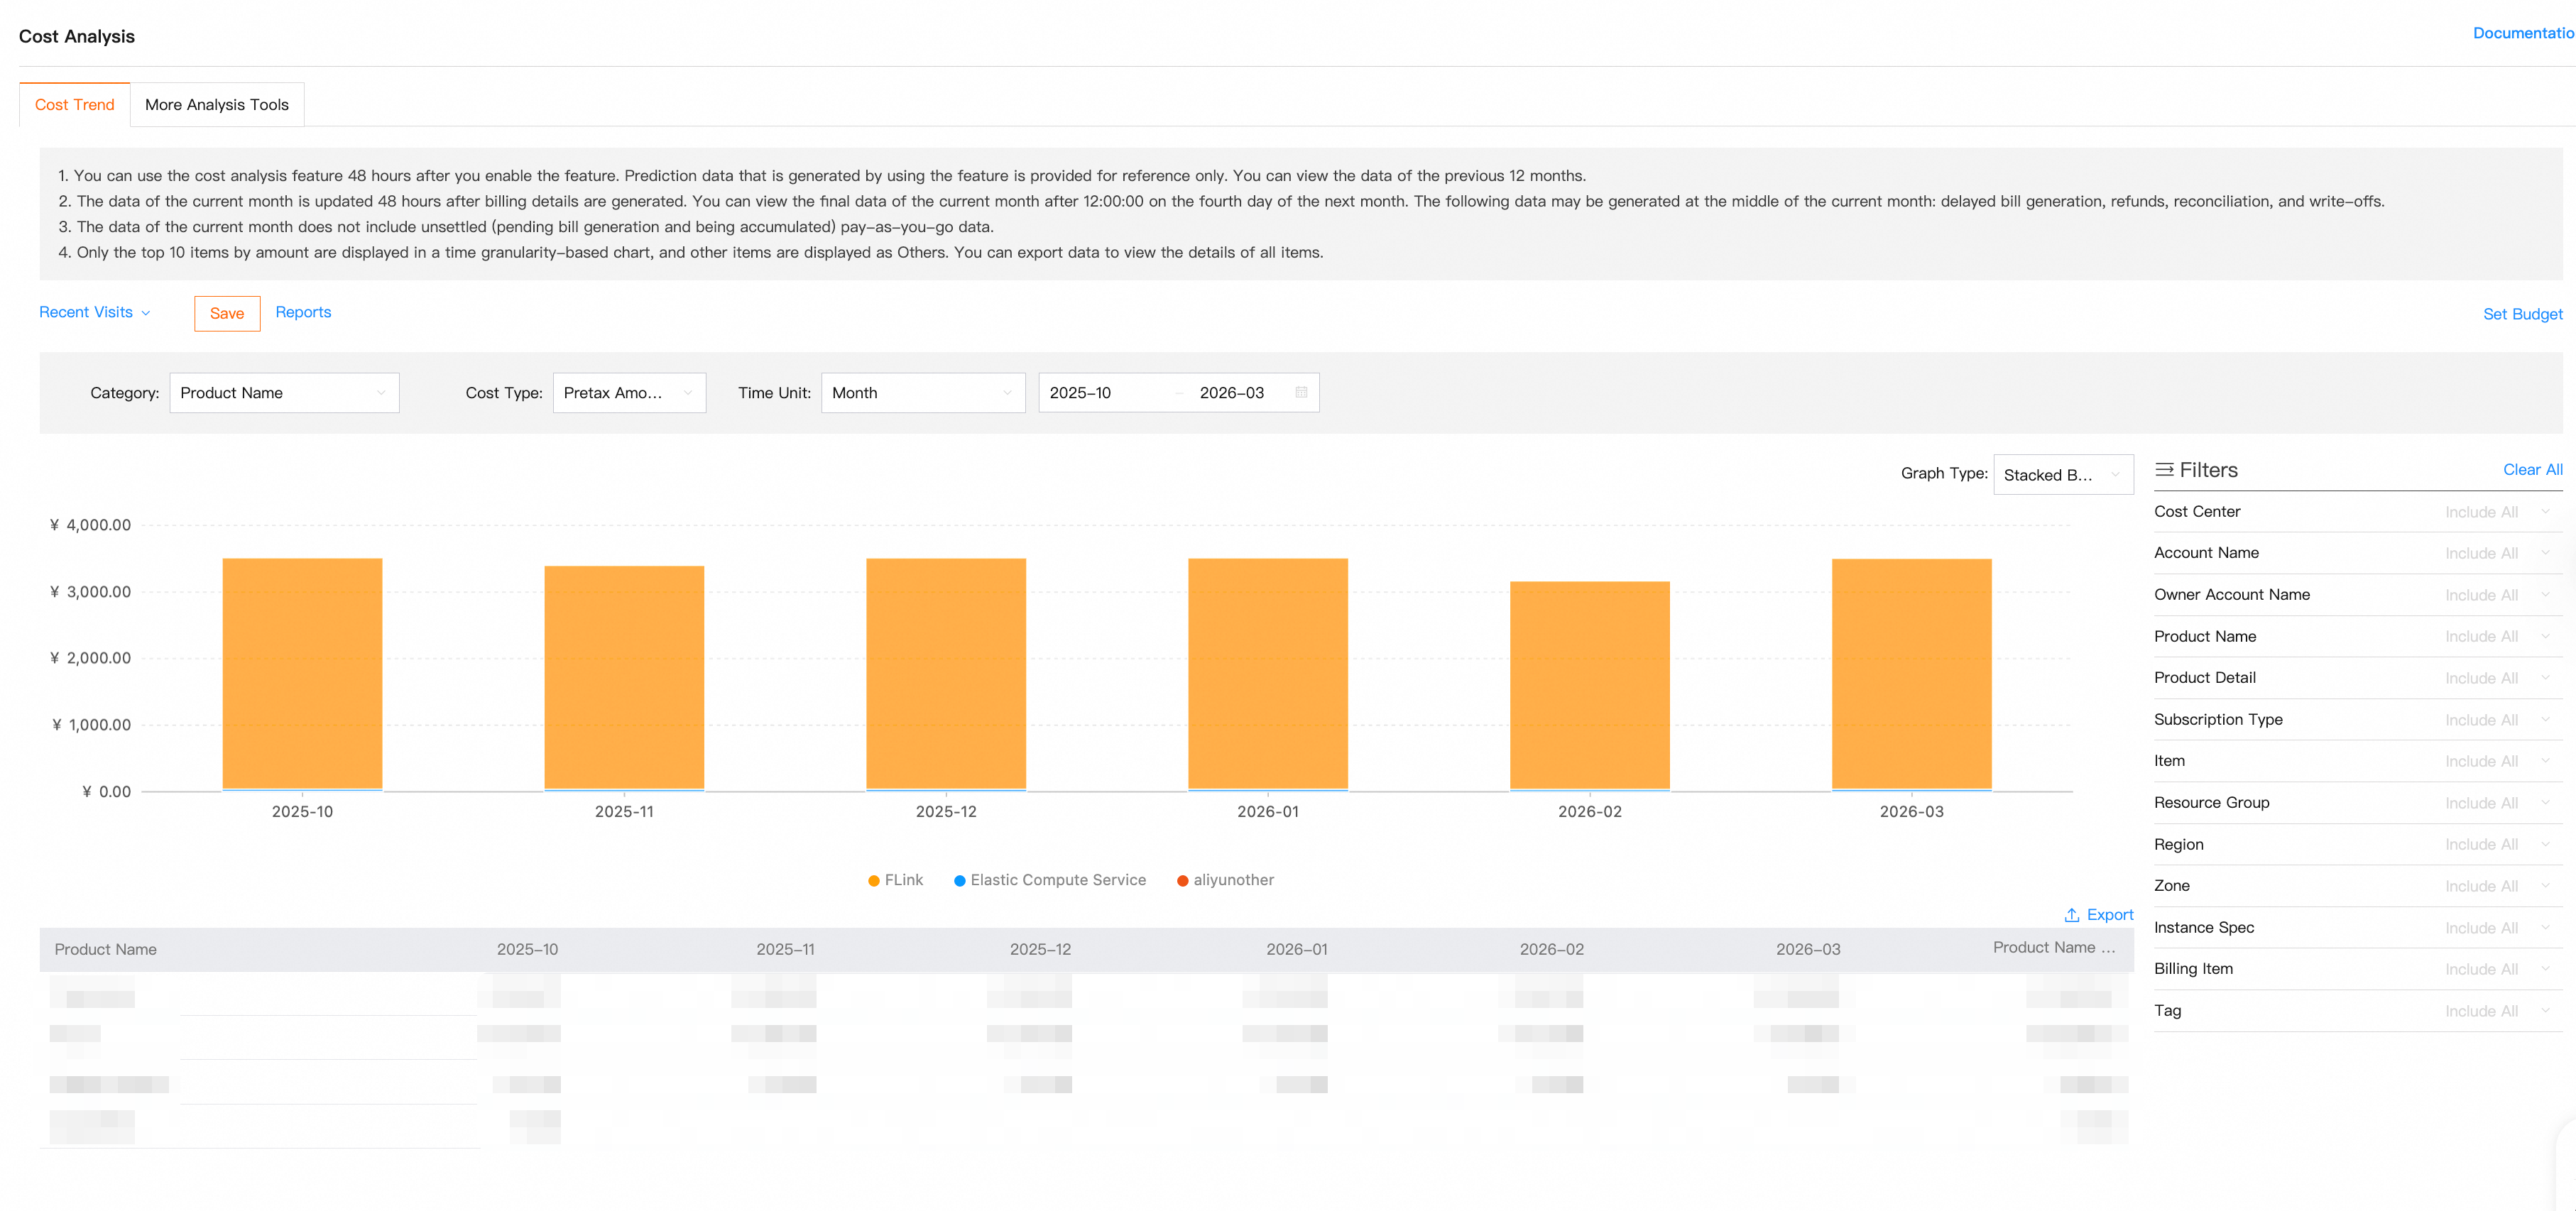
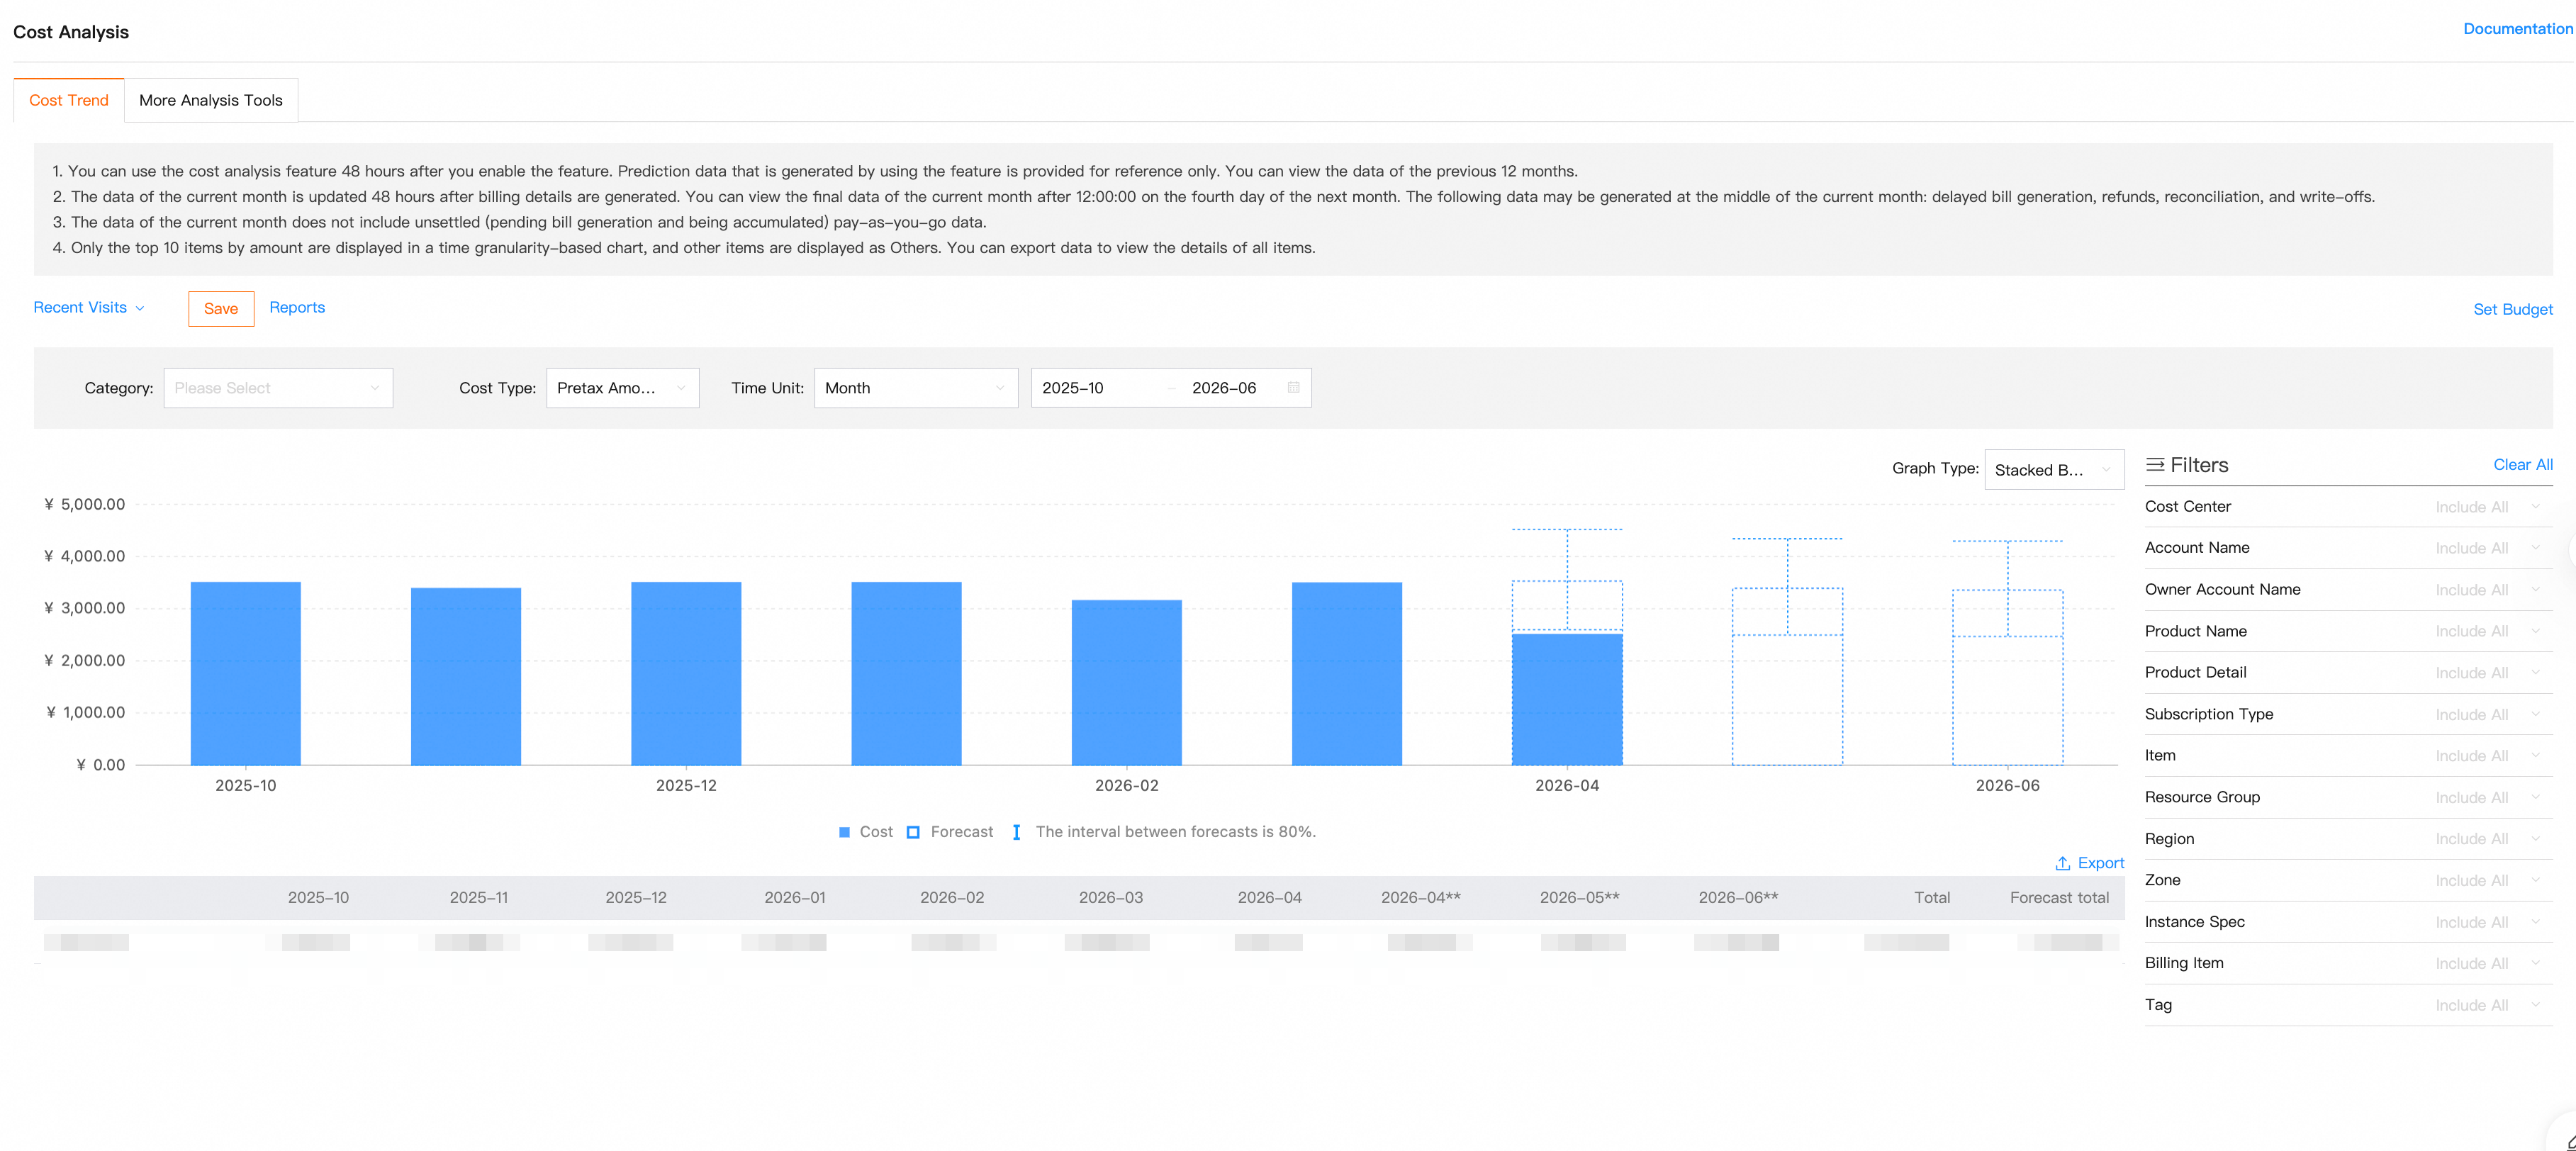
The cost trend section lets you view cost trends across several dimensions.
Category: View cost trends grouped by dimensions such as Product, Product Detail, or cost center.
Instance tag: Select a specific tag value to view its cost trend.
Instance ID: Select up to 10 instances for trend analysis.
Cost type: View costs by List Price, Billable Amount, or Amortized Payable Amount.
Time granularity: View data by different time granularities, such as hourly, daily, or monthly, over a specific time range.
When you view data by instance, the maximum time range is 14 days.
When you view data by hour, the maximum time range is 14 days.
Graph type: Supports stacked bar charts, line charts, and bar charts.
Filters: Use filters to refine your cost trend data. You can apply filters across multiple dimensions to either include or exclude specific items. After you apply the filters, the chart updates to show only the data that matches your filter criteria.
Report management: Click "Save" in the upper-left corner to save the current analysis as a report. Click "Reports" to go to the "Report management" page, where you can view and manage all your reports. For details, see the Report management section below.
NoteThe chart displays only the top 10 items for the selected time granularity. The costs for all other items are aggregated under "Others". You can export the data to view a complete breakdown.
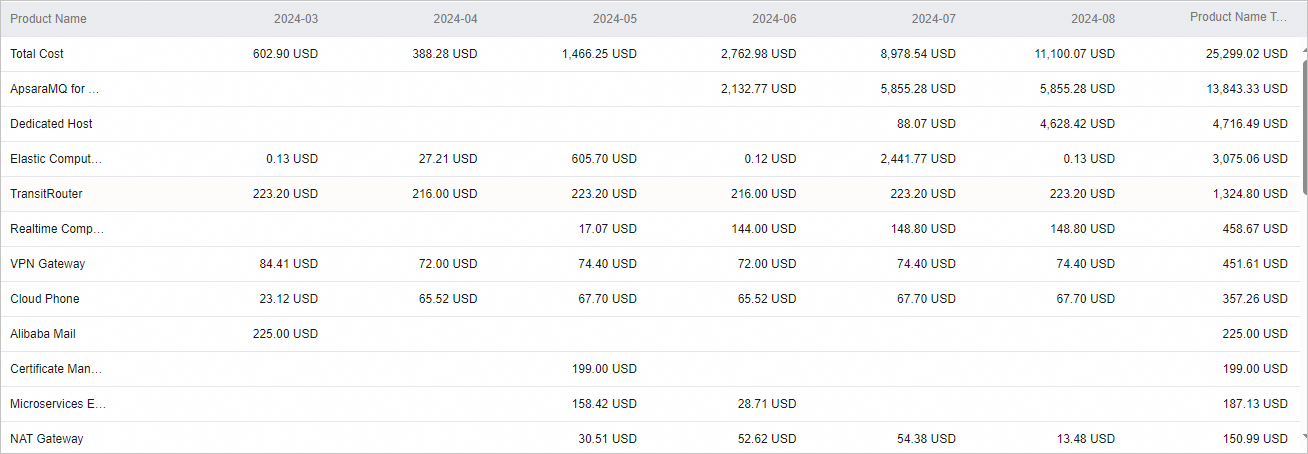
Data table: You can preview or export data within the selected range. The "Total Cost" column shows the sum of the selected costs.
View budget: In the upper-right drop-down list, enter or select a budget to view its cost data at the specified time granularity:
Click "Estimate-to-Actual Analysis" on the right to go to the analysis page for the selected budget, where you can compare your actual spending against the budget.
Click "Set Budget" to go to the "Budget management" page to create or manage your budgets.
NoteTo learn more about budget management, see budget management.
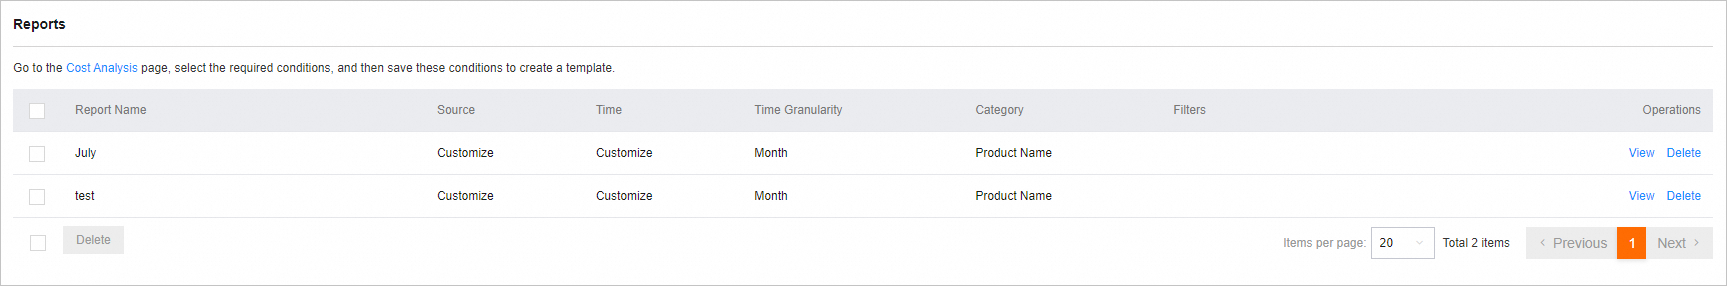
Report management
The "Report management" page shows all your saved cost analysis reports and their filter conditions.
View: Click "View" to quickly open the cost trend chart for the report.
Delete: To delete a single report, click "Delete". To delete multiple reports, select them and click "Delete" at the bottom of the list.
When viewing a cost trend chart, you can save the current set of filters as a new report and give it a name.
Cost prediction
You can forecast your total costs by selecting a future date range in the "Time Granularity" calendar on the cost trend chart.
Enable Forecast: If the selected time range includes future dates, click "Enable Forecast" in the pop-up window to turn on the cost prediction feature for future dates.
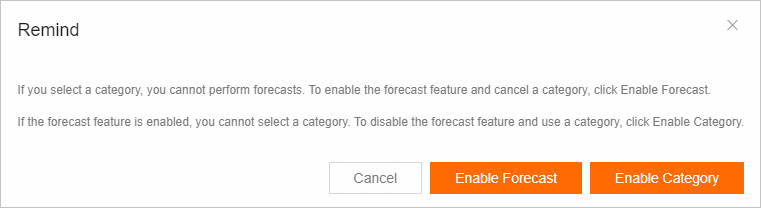
View prediction trends: After enabling the feature, you can view predicted cost trends for up to 12 months.
You can view the billable amount forecast 48 hours after you enable cost analysis.
You can view the amortization cost forecast 48 hours after you enable the amortization feature.
Your account must have more than 60 days of spending history with an average daily spending of over USD 1.
Daily forecasts support only pay-as-you-go costs. Monthly forecasts support both subscription and pay-as-you-go costs.
Cost analysis provides forecasts for the total amount only, not for individual dimensions.
Predicted costs may differ from actual costs and are for reference only.
FAQ
Q: Why is the data on the cost analysis page different from the amount in my amortization cost bill?
A: The data on these two pages may differ because they cover different data ranges. The cost analysis page includes amortization data only for billing cycles from August 2021 onward. The amortization cost page displays the complete data set.