Simple Log Service allows you to save query and analysis results to a dashboard as charts. This topic describes how to add a chart to a dashboard.
Prerequisites
-
You have collected data.
You can collect logs, metric data, and traces.
ImportantBefore you can obtain a chart based on logs and add the chart to a dashboard, you must store the logs in a Standard logstore. For more information, see Manage a logstore.
-
If you collect logs, you must configure an index. For more information, see Create an index.
-
A dashboard has been created. For more information, see Create a dashboard.
Limitations
For the maximum number of charts that you can add to a dashboard, see Basic resource limits.
Entry points
You can add a chart from either the Logstore page or a dashboard page. The entry points are different, but the configuration options are the same. This topic uses the dashboard page as an example.
-
Logstore page
To add a chart from the Logstore page, perform a query and analysis, select a chart, and then save the chart to the target dashboard. For information about how to go to the Logstore page, see Quick start for query and analysis.
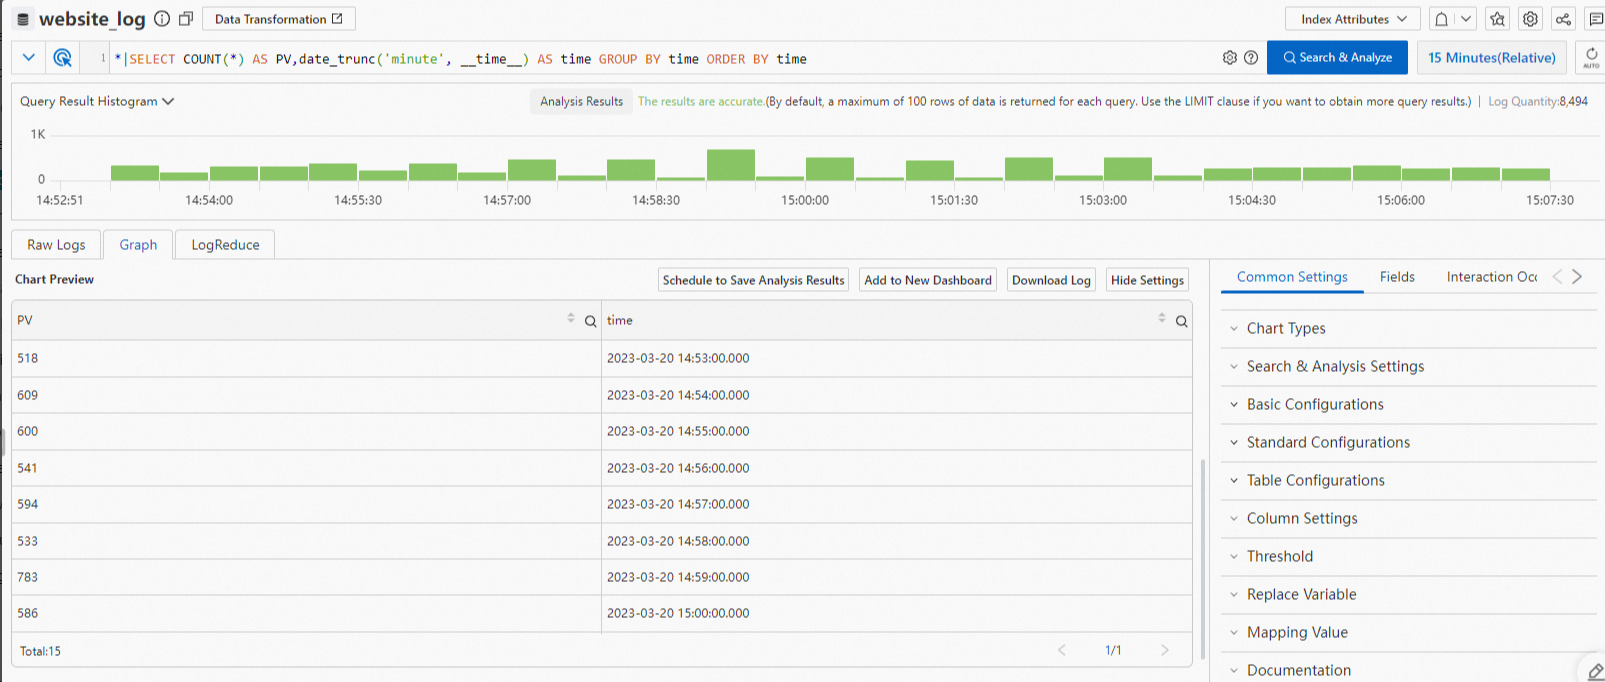
Below the query results, click the Chart tab to open the chart preview area. The chart configuration panel is on the right, where you can set parameters such as the chart type. Above the preview area, you can find buttons such as Add to Dashboard and Download Logs.
-
Dashboard page
To add a chart from a dashboard page, first select the target dashboard, add a new chart, and then perform a query and analysis. For information about how to go to the dashboard page, see Create a dashboard. The Pro chart editor has several key areas. The main area is the chart preview, which visualizes your query results. The right-side panel is the configuration panel, containing the General Configuration, Field Configuration, and Interaction Events tabs. Under General Configuration, you can expand sections such as Chart Type, Basic Configuration, Standard Configuration, Query and Analysis Configuration, Data Configuration, Legend Configuration, Tooltip Configuration, X-axis, Y-axis, Graphics Configuration, Variable Replacement, and Documentation Link. The bottom panel is for query and analysis, where you can select a data source and data type, and add new queries by clicking Add Query. The top toolbar provides a Time Series Mode switch, a Show Raw Data switch, and a time range selector.
Procedure
To add multiple charts to a dashboard, repeat this procedure.
Log on to the Simple Log Service console.
-
Navigate to the chart editor.
In the Projects section, click the project you want.
-
In the left-side navigation pane, choose .
-
In the dashboard list, click the target dashboard.
-
On the dashboard page, click Edit.
-
Click .
-
In edit mode, click the General Configurations >
 icon.
icon.
-
Configure query and analysis.
You can add multiple queries. For more information, see Query and analysis.
-
Optional: Configure data conversion.
Before you visualize data with charts, you can process query and analysis results by using data conversion. For example, you can merge multiple query and analysis results or classify them. For more information, see Data conversion.
-
Optional: Configure chart properties.
Simple Log Service automatically configures chart properties based on your query and analysis results. If the default settings meet your needs, you do not need to change them.
-
Set the general configuration.
These settings are applied globally to the chart. For more information, see General configuration.
-
Set the field configuration.
Use field configuration to customize how results from a query or a specific column are visualized. For more information, see Field configuration.
-
-
Optional: Configure interaction events.
Interaction events let you add drill-down capabilities to query results or specific columns, which enables deeper analysis. For more information, see Add interaction events to a dashboard for drill-down analysis.
-
On the Edit Chart page, click OK.
-
On the dashboard page, click Save.