Use CloudLens for SLS billing data to analyze your Simple Log Service resource usage, monitor trends, and configure alerts.
Background
CloudLens for SLS provides free billing data to monitor usage. The data comes from Alibaba Cloud Billing Management. Simple Log Service pulls billing data into Tablestore (free of charge). Simple Log Service uses external data association to query and analyze this data.

CloudLens for SLS provides usage reports from billing data to analyze Simple Log Service billable items in real time, run custom SQL analysis, and configure alerts for your Simple Log Service resources.
Procedure
- Log on to the Log Service console.
-
In the Log Application section, click the Cloud Service Lens tab, then click CloudLens for SLS.
For more information, see CloudLens for SLS.
Billing data
SLS billing data records the usage of each Simple Log Service instance per billable item. Understand these key concepts in Simple Log Service billing data.
|
Concept |
Field |
Description |
|
instance |
InstanceID |
The most granular resource in Simple Log Service. An Simple Log Service corresponds to a Simple Log Service. |
|
billable item |
BillingItem |
Billable items in Simple Log Service. Examples include hot-tier log storage and log index traffic. |
Instances
A Simple Log Service Simple Log Service is the most granular resource (a Simple Log Service) in the service. The instance ID is structured as follows: ${aliUid};${Project};${Logstore};${Region}. The following table describes the variables.
|
Variable |
Description |
|
|
Your Alibaba Cloud account ID. |
|
|
A resource management unit in Simple Log Service. It serves as the primary boundary for resource isolation and access control. For more information, see Project. |
|
|
The log collection, storage, and query unit in Simple Log Service. For more information, see Logstore. |
|
|
The physical data center location for Simple Log Service. You can specify a region when you create a Project. Once specified, the region cannot be changed. For more information, see Supported regions. |
Billable items
Billable items are the specific, chargeable capabilities of Simple Log Service. Each Simple Log Service in Simple Log Service is billed separately. For example, storage fees for log retention and write traffic fees for log collection. For more information, see Billable items of pay-by-feature.
The BillingItem field represents the Simple Log Service. For a breakdown of Simple Log Service billable items, see Billing structure.
Scenarios for SLS usage analysis
Use billing data for custom analysis and real-time usage monitoring.
Monitor usage trends and instance details
Monitor usage trends and per-instance details to identify sudden billing changes.
-
Monitor usage trends
You can use the
date_trunc()function to analyze usage trends at different time granularities.-
Query and analysis statement
In this query,
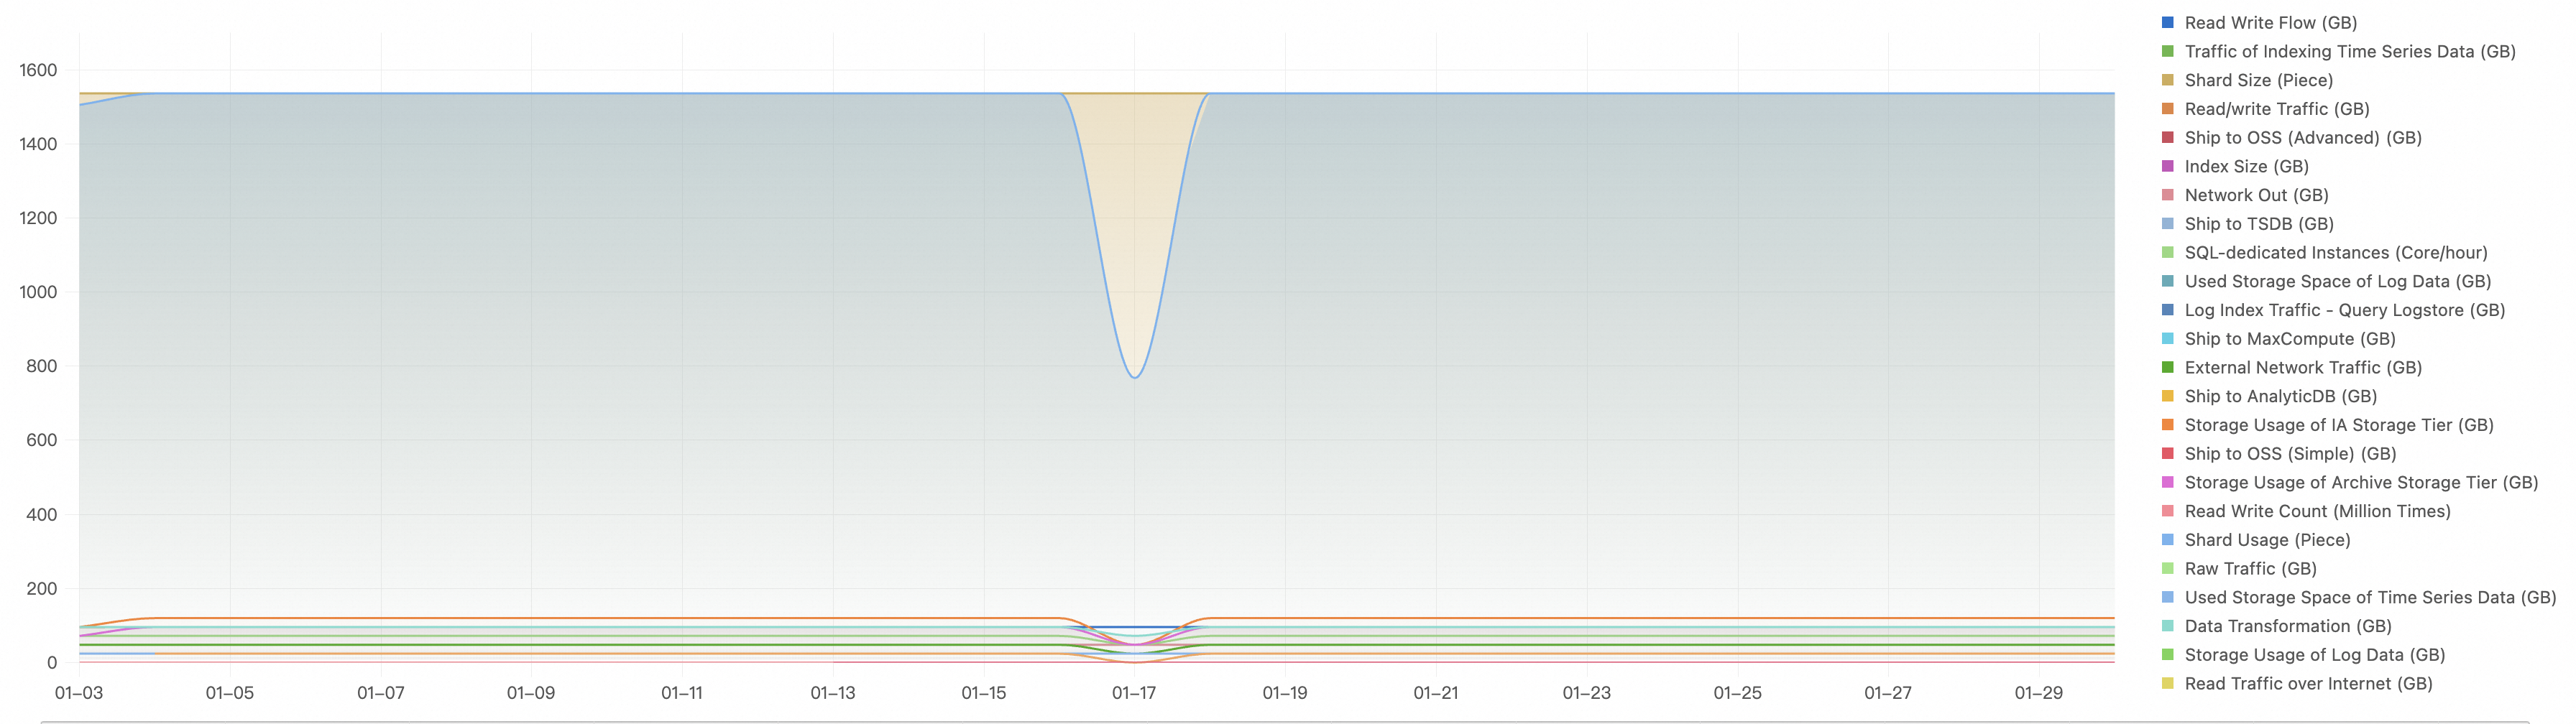
BillingItemis the billable item andUsageis the resource usage.* | select date_trunc('day', __time__) as "Date", BillingItem, round(sum(Usage), 3) as "Usage" FROM instance_bill where productcode = 'sls' group by "Date", BillingItem order by "Date" -
Query and analysis results: You can use a Flow chart (Pro) to visualize the results. Configure the chart by setting Axis X Field to Date, Axis Y Field to Usage, and Aggregate Column to BillingItem.
-
-
Monitor instance usage details
When you analyze usage details, you often need to drill down to a specific instance. For an SLS instance, combine queries for cost, usage, and storage:
-
t1: Gathers usage statistics for each billable item per instance.
-
t2: Gathers cost statistics for each instance, including the payable amount (
PretaxAmount) and the month-over-month growth rate. -
t3: Gathers total storage usage. Storage is calculated daily, and this query retrieves the total usage up to the last day of the selected time range.
-
Query and analysis statement
* | with t1 as ( select InstanceID, BillingItem, sum(Usage) as Usage FROM instance_bill where ProductCode = 'sls' and BillingItem not like '%存储空间%' and BillingItem not like '%Storage%' group by InstanceID, BillingItem ), t2 as ( select InstanceID, round(di [1], 3) as "Fee", concat( cast(round(di [3] * 100 -100, 3) as varchar), '%' ) "Growth rate compared with the previous month" from( select InstanceID, compare(cost, 2592000) as di FROM ( select InstanceID, round(sum(PretaxAmount), 2) as cost FROM instance_bill where ProductCode = 'sls' group by InstanceID ) group by InstanceID ) ), t3 as ( select InstanceID, max_by("存储空间", t) as "Storage" FROM ( select t, InstanceID, round(sum("存储空间"), 2) as "存储空间" from( select date_trunc('day', __time__) as t, InstanceID, case when BillingItem like '%存储空间%' or BillingItem like '%Storage%' then Usage else 0 end as "存储空间" FROM instance_bill WHERE ProductCode = 'sls' group by t, InstanceID, "存储空间" ) group by t, InstanceID order by t asc ) group by InstanceID ) select t1.InstanceID as InstanceID, t1.BillingItem as BillingItem, t1.Usage as Usage, t2."Fee" as "Fee (CNY)", t2."Growth rate compared with the previous month" as "Growth rate compared with the previous month (%)", t3."Storage" as "Storage" FROM t1 left join t2 on t1.InstanceID = t2.InstanceID left join t3 on t1.InstanceID = t3.InstanceID order by "Fee (CNY)" desc limit 150000 -
Query and analysis results
You can use a cross table to visualize the billable item details for each instance. Configure the table with the following settings: Category Column: BillingItem, Metric Column: Usage, and Aggregate Column: InstanceID, Fee (CNY), Growth rate compared with the previous month (%), and Storage. After the configuration, sort by a specific billable item to identify the highest-usage instances. The resource cost statistics table includes columns such as InstanceID, Fee (CNY), Growth rate compared with the previous month (%), Storage, Active Shard Lease, index traffic, read and write traffic, Read/Write Operations, Raw Data Traffic, Data Shipped to MaxCompute, and Outbound Internet Traffic. For example, instance1 has a fee of 544.71 CNY, a month-over-month growth of 1.428%, and high consumption in areas like storage (32,696.46) and index traffic (4,472.05). In contrast, instance2 has a fee of 458.65 CNY, with significantly lower resource usage across all dimensions.
-
-
With usage monitoring in place, analyze changes in typical scenarios such as read/write traffic, storage, and index traffic.
Scenario: Increased read and write traffic
Analyze per-instance read and write traffic with the following query.
-
Query and analysis statement
* |
select
 "Date",
 InstanceID,
"Usage"
from(
	select
	date_trunc('day', __time__) as "Date",
	InstanceID,
	round(sum(Usage), 3) as "Usage"
	FROM instance_bill
	where
	productcode = 'sls'
	and BillingItem = '读写流量'
	group by
	"Date",
	InstanceID
)
group by
 "Date",
 "Usage",
 InstanceID
order by
 "Date"
limit
 10000
Scenario: Increased storage usage
-
Query and analysis statement
* |
select
 InstanceID,
 round(diffreal [1], 3) as "Usage",
 concat(
		cast(
			round(diffreal [1] / sum(diffreal [1]) over() * 100, 2) as varchar
		),
		'%'
	) as "Usage Share",
 concat(
		cast(
			coalesce(round(diffreal [5] * 100 -100), 2) as varchar
		),
		'%'
	) as "Growth vs. 1 Day Ago (%)",
 concat(
		cast(
			round(coalesce(diffreal [6] * 100 -100, 2)) as varchar
		),
		'%'
	) as "Growth vs. 2 Days Ago (%)",
 concat(
		cast(
			round(coalesce(diffreal [7] * 100 -100, 2) as varchar
		),
		'%'
	) as "Growth vs. 3 Days Ago (%)"
from(
	select
	InstanceID,
	compare(Usage, 86400, 172800, 259200) as diffreal
	from(
		select
		InstanceID,
		sum(Usage) as Usage
		FROM instance_bill
		where ProductCode='sls' and BillingItem = '存储空间'
		group by
		InstanceID
	)
	group by
	InstanceID
)
order by
 diffreal [1] desc
limit
 1000
You can run the following query to further analyze the cause of the storage increase for instance5.
-
Query and analysis statement
Replace
${instance5}with the actual instance ID.* | select date_trunc('day', __time__) as "Date", BillingItem, round(sum(Usage), 3) as "Usage" FROM instance_bill where productcode = 'sls' and InstanceID = ${instance5} group by "Date", BillingItem order by "Date"
Scenario: Billed usage is zero
-
Use the billing data to check if fees are being offset by a resource plan.
-
Query and analysis statement
Query both the usage data and the amount of usage offset by a resource plan.
(*) |
select
	InstanceID,
 BillingItem,
 	Usage as "Usage",
	DeductedByResourcePackage as "Resource usage for which fees are offset by using resource plans"
FROM instance_bill
where
 productcode = 'sls'
-
-
Determine if the resource plan covers the total usage of the billable item.
-
Query and analysis statement
Query the original resource usage before it is offset by a resource plan. The offset amount is represented by
DeductedByResourcePackage, and the total original usage isUsage + DeductedByResourcePackage.* | select date_trunc('day', __time__) as "Date", BillingItem, round(sum(Usage + DeductedByResourcePackage), 3) as "Resource usage before the fees are offset by using resource plans" FROM instance_bill where productcode = 'sls' group by "Date", BillingItem order by "Date"
-
Configure usage alerts
Simple Log Service alerting is a one-stop intelligent O&M platform for alert monitoring, noise reduction, incident management, and notification dispatching. Monitor your Simple Log Service usage in real time with CloudLens for SLS anomaly detection, which provides a quick entry to the alerting center. For more information, see Set up alerts.
Alerts for total daily usage
Monitor total usage to control costs. Use the following query to check storage usage.
-
Query and analysis statement
 * |
select
	round(sum(Usage), 2) as "Storage Usage"
from instance_bill
where ProductCode='sls'
and BillingItem='存储空间'
Alerts for a single instance
Monitor individual instance usage. The following query triggers an alert when any instance's storage usage exceeds 10.
-
Query and analysis statement
* |
select
 InstanceID,
 "Storage Usage"
from(
 select
 InstanceID,
 round(sum(Usage), 2) as "Storage Usage"
 FROM instance_bill
 where
 ProductCode = 'sls'
 and BillingItem = '存储空间'
 group by
 InstanceID
 )
where
 "Storage Usage" > 10
Create custom alerts for your business requirements. For more information, see Quick start for alert configuration.