A flow chart offers powerful visualization features, such as merging results from multiple query and analysis operations into one chart and applying custom settings to specific fields. This topic describes the basic configurations of a flow chart.
Overview
A flow chart, also known as a ThemeRiver, is a type of stacked area chart that is plotted around a central axis. In a flow chart, different colored layers represent different categories of information. The time attribute from the original dataset is mapped to the x-axis by default, creating a comprehensive view of how data categories change over time.
For information about how to add a chart, see Add a chart to a dashboard.
Examples
|
Flow chart type |
Example |
References |
|
Basic flow chart |
|
|
|
Specify the maximum number of categories |
|
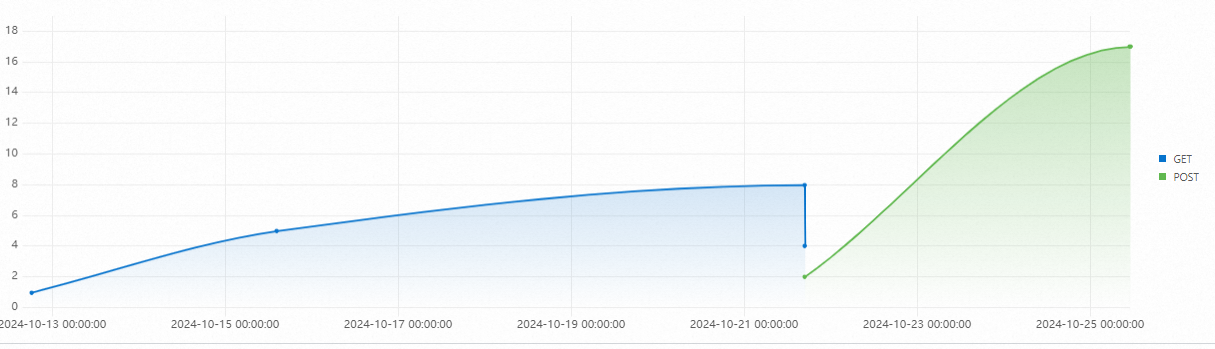
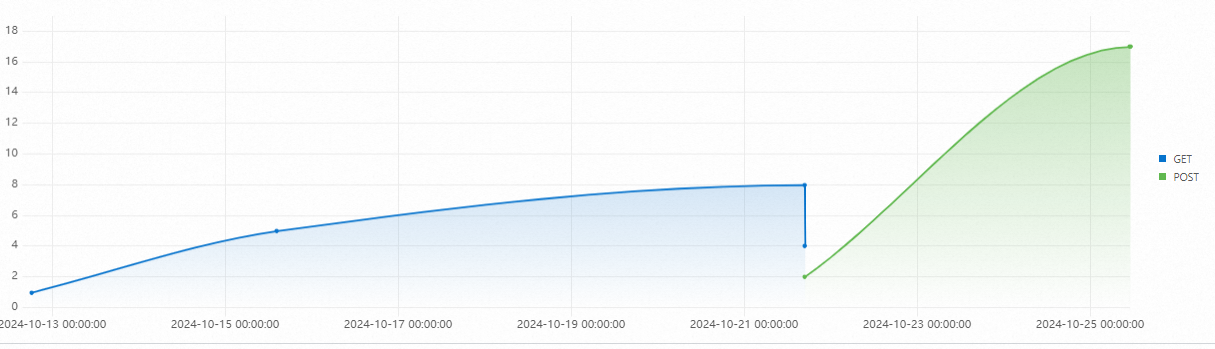
Configuration example
Basic flow chart
Log on to the Simple Log Service console. In the Projects section, click the project you want.

-
In the left-side navigation pane, choose . In the Dashboard list, click the dashboard you want. In the upper-right corner of the dashboard page, click Edit. In edit mode, choose .
-
In the General Configurations > Chart Types >
 . Then, enter a query and analysis statement and click Last 15 Minutes to set a time range.
For example, the query and analysis statement for A is:
* | select __time__,count(0) as pv group by request_method,__time__The __time__ field for the x-axis uses the UNIX timestamp format. Turn on the Time Series Mode switch, and set Format for the x-axis to
YYYY-MM-DD hh:mm:ss. For more information, see Time Series Mode.In the x-axis section on the right, set Time Range to Data Time.
Other configurations
|
Chart configuration |
Description |
Example |
|
Set chart type (line chart, area chart, column chart, or cross table) |
For more information, see Set the chart type (line chart, area chart, column chart, or cross table). |
|
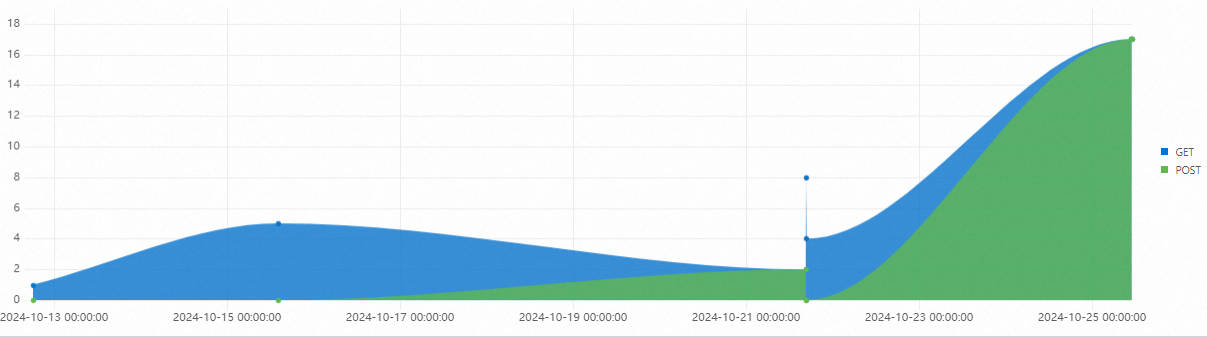
General configurations
-
Basic configurations
Parameter
Description
Title
The title of the flow chart.
Display Title
If you turn on the Display Title switch, the title is displayed in the flow chart.
Display Border
After you turn on the Show Border switch, a border is displayed in the flow chart.
Display Background
After you turn on the Show Background switch, the background color is displayed in the flow chart.
Display Time
After you enable the Show Time switch, the query time is displayed in the flow chart.
Fixed Time
After you turn on the Fixed time switch, the time for the query and analysis will be fixed and will not be affected by the dashboard's global time.
-
Standard configurations
Parameter
Description
Format
The display format for numeric values.
Unit
The unit for numeric values.
Decimal Places
The number of decimal places to display for numeric values.
Display Name
The name of the legend item.
The specified name is applied to all legend items in the chart. To modify the name of a specific legend item, use the Field Configuration settings.
Color Scheme
The color scheme for the chart background and legend.
-
Built-in: Uses the built-in color scheme.
-
Solid: Uses a single color that you select.
-
Threshold: Uses different colors based on specified threshold values.
-
-
Query and analysis configurations
Parameter
Description
x-axis field
The field to use for the x-axis.
By default, Simple Log Service automatically selects a suitable field for the x-axis.
y-axis field
The field to use for the y-axis.
By default, Simple Log Service automatically selects a suitable field for the y-axis.
Aggregate column
The field to use for aggregation in the third dimension.
-
Data configuration
Parameter
Description
Data Completion
After you enable the Data Completion switch, Simple Log Service starts data completion from the first data entry according to the completion window.
Completion Window
The time window for data completion. The minimum value is 0. Unit: seconds.
By default, Simple Log Service automatically defines the completion window.
Completion Value
The value to use for filling in missing data points. The default value is 0, which means missing values are replaced with 0.
Maximum categories
A large number can affect performance. We recommend setting this value to 50 or less.
-
Tooltip configurations
Parameter
Description
Sort order
The sorting method for the data.
-
Legend configurations
Parameter
Description
Display legend
When you turn on the Display Legend switch, the legend is displayed in the flow chart.
Legend position
The position of the legend.
Actions
The action to perform when a legend item is clicked.
-
Single: When you click a legend item, only the data corresponding to that item is displayed.
-
Switch: When you click a legend item, the data corresponding to that item is hidden. Click it again to show the data.
Maximum width (height)%
The maximum width and height of the legend.
-
-
X-axis
Parameter
Description
Display x-axis
When you turn on the Show x-axis switch, the x-axis is displayed in the flow chart.
x-axis title
The title of the x-axis.
x-axis height
The height of the x-axis.
By default, Simple Log Service automatically sets the height of the x-axis.
-
Y-axis
Parameter
Description
Display y-axis
After you turn on the Show y-axis switch, the y-axis is displayed in the flow chart.
y-axis title
The title of the y-axis.
y-axis position
The position of the y-axis.
y-axis width
The width of the y-axis.
By default, Simple Log Service automatically sets the width of the y-axis.
Maximum value
The maximum value of the y-axis.
By default, Simple Log Service automatically sets the maximum value of the y-axis.
Minimum value
The minimum value of the y-axis.
By default, Simple Log Service automatically sets the minimum value of the y-axis.
Elastic maximum value
The elastic maximum value for the y-axis. This value applies only if all values on the axis are less than the elastic maximum.
By default, Simple Log Service automatically sets the elastic maximum value for the y-axis.
Elastic minimum value
The elastic minimum value for the y-axis. This value applies only if all values on the axis are greater than the elastic minimum.
By default, Simple Log Service automatically sets the elastic minimum value for the y-axis.
y-axis ID
The ID of the y-axis. This setting is typically not used in General Configurations. If you need to define multiple y-axes, you must configure them in Field Configuration. The y-axis ID can be any string. Axes with different IDs are displayed as separate y-axes on the chart.
The y-axis ID takes precedence over the Unit setting in Standard Configurations. For example, two y-axes with the same unit are merged into a single axis. However, if they have the same unit but different IDs, they are displayed as two separate axes.
-
Chart configurations
Parameter
Description
Chart type
The type of the flow chart.
NoteThe available parameters vary depending on the chart type you select. This section uses the line chart as an example.
Connection mode
The connection mode for the lines in the flow chart.
Line width
The width of the lines.
Display point
Specifies whether to display points.
Opacity
The opacity of the flow chart.
Point size
The size of the points on the flow chart.
Gradient mode
The gradient mode of the flow chart.
-
Opacity: Based on the line color and affected by the Opacity setting.
-
No Gradient: Disables the gradient effect. The fill color matches the line color.
-
-
Variable substitution
Parameter
Description
Variable substitution
Variable substitution adds a variable-type filter to the chart. After configuration in General configurations, a filter appears in the upper-left corner of the chart. When you select a value, Simple Log Service replaces the variable in the query statement and reruns the analysis. Example 2: Set variable substitution.
-
Documentation link
Parameter
Description
Add documentation link
Sets a custom documentation link or description, which is displayed in the upper-right corner of the chart.
Field configuration
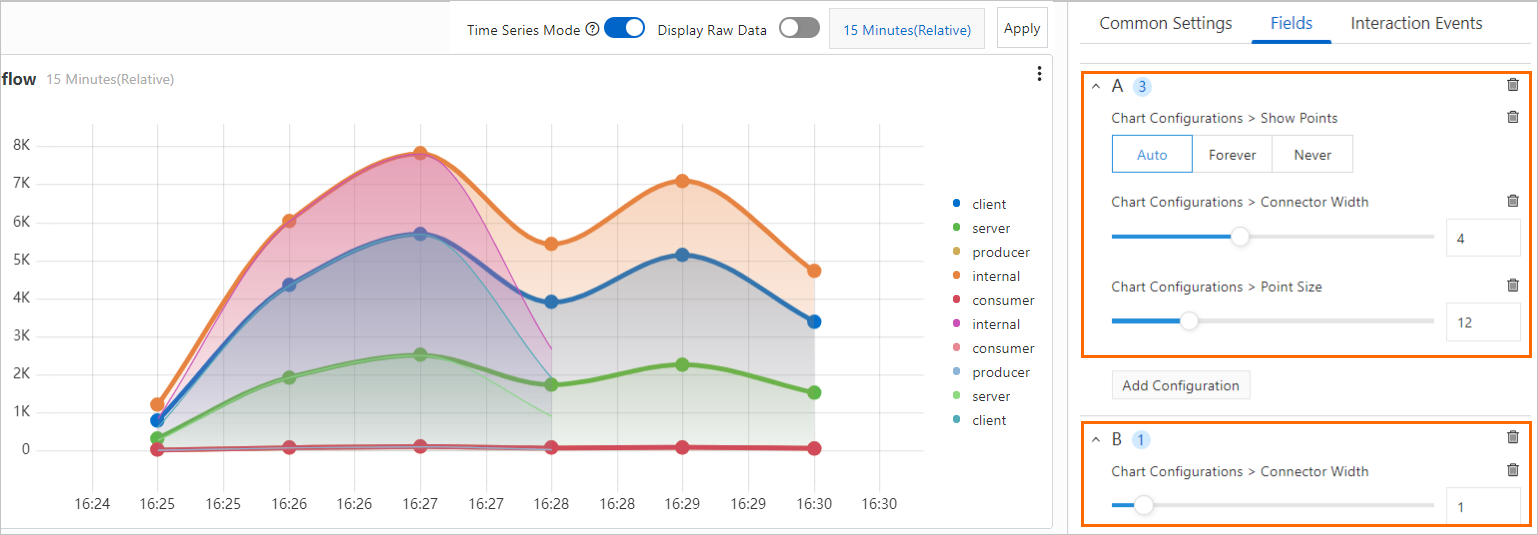
Field Configuration lets you configure personalized display settings for the results of a single query and analysis statement, or for a single column in the results. For more information about the configuration items in Field Configuration, see General Configurations.
For example, A represents the visualization settings for the results of query and analysis A, and B represents the settings for the results of query and analysis B. You can set different line widths to distinguish between the results of the two query and analysis operations. In the following figure, the thick line represents the results of query and analysis A, and the thin line represents the results of query and analysis B.
Interaction occurrences
Use interaction occurrences to drill down on a single field or the results of a single query and analysis statement for more detailed data analysis. Supported types of interaction occurrences include Open Logstore, Open Saved Search, Open Dashboard, Open Trace Analysis, Open Trace Details, and Create Custom HTTP URL. For more information, see Add interaction occurrences to a dashboard for drill-down analysis.
For example, A represents the interaction occurrences for the results of query and analysis A. If you set the action to Open Logstore, you can click any point on the line corresponding to query and analysis A and then click Open Logstore to go to the specified Logstore.
Example: Flow chart as line chart
* | select __time__ - __time__% 60 as minute, count(1) as c, request_method group by minute, request_method order by minute asc limit 100000In the Query and analysis configurations section of the Flow chart configurations panel on the right, set x-axis to minute, y-axis to c, and Aggregate Column to request_method.