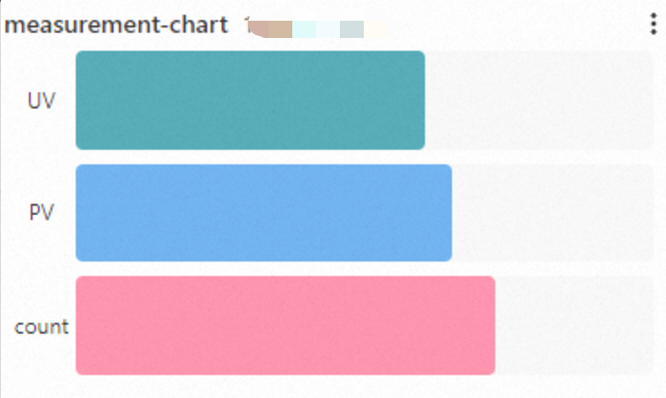
A bar gauge supports multiple query and analysis statements, allowing you to display results from different queries as separate bars in a single chart and customize settings for each field.
Prerequisites
-
You have collected data. For more information, see Collect text logs from servers.
-
You have created an index. For more information, see Create an index.
-
You have created a dashboard. For more information, see Create a dashboard.
Overview
-
Query and analyze: Retrieve, aggregate, and perform statistical analysis on logs in the console.
-
Configure a bar gauge: Add three query and analysis statements, set a different color for each query result, and then add the bar gauge to the target dashboard.
Step 1: Query and analyze
Log on to the Simple Log Service console. In the Projects section, click the project you want.

-
In the navigation pane on the left, click Log Storage. In the Logstores list, click the target Logstore.
-
Enter the following query and analysis statements and click Search & Analyze to view the logs.
-
Calculate the UV
status < 400 | SELECT approx_distinct(client_ip) AS UV -
Count the PV
status < 400 | SELECT count(*) AS PV -
Count log entries
* | SELECT count(*) AS count
-
Step 2: Configure a bar gauge
1. Add a bar gauge
In the navigation pane on the left, choose . In the Dashboard list, click the target dashboard. In the upper-right corner, click Edit. In edit mode, click .
2. Configure multiple queries
On the right side of the page, choose General Configurations > Chart Types >  . On the left side, configure the query time range, Logstore, and query and analysis statements. Then, click Apply at the top of the page to view the chart.
-
: Select the UV field from query A's results.
-
: Select the PV field from query B's results.
-
: Select the count field from query C's results.
Set the data source to website_log and the query time range to 15 Minutes. The statement for query A is status < 400 | SELECT approx_distinct(client_ip) AS UV, the statement for query B is status < 400 | SELECT count(*) AS PV, and the statement for query C is * | SELECT count(*) AS count.
3. Color settings
On the Field Configuration tab on the right side of the page, set the colors for the bar gauge. For more information about other settings, see field settings.
-
The settings under A apply to the results of query A. Set the color to green.
-
The settings under B apply to the results of query B. Set the color to blue.
-
The settings under C apply to the results of query C. Set the color to pink.