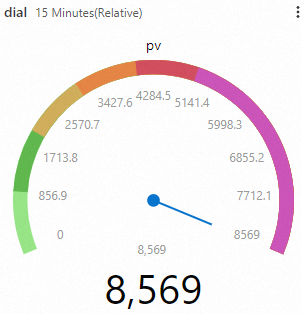
A dial displays a measurement on a circular or semicircular face with graduated marks. Use dials on dashboards to monitor metrics at a glance.
Prerequisites
-
Data is collected. Collect text logs from servers.
-
An index is created. Create indexes.
-
A dashboard is created. Create a dashboard quickly.
Overview
-
Search and analysis: Query and analyze logs in the Simple Log Service console, including log query, aggregation, and statistics.
-
Configure a dial: Set the chart type to Dial, configure the chart, and add it to the dashboard.
Step 1: Query and analyze data
Log on to the Simple Log Service console. In the Projects section, click the project you want.

-
In the left-side navigation pane, choose Log Storage > Logstore, and click the target Logstore.
-
Enter a query statement and click Search & Analyze.
* | select COUNT(*) pv
Step 2: Configure a dial
1. Add a chart
In the left-side navigation pane, choose . In the Dashboard list, click the target dashboard. Click Edit in the upper-right corner, and then click .
2. Configure the dial
-
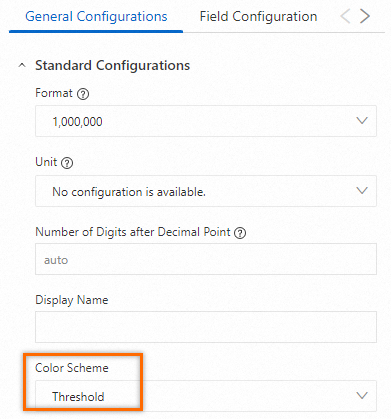
On the General Configurations tab, select
 for Chart Type and Dial for Style Settings. Configure the query time range, Logstore, and query statement on the left.
For example, select website_log as the data source, set the query statement to
* | select COUNT(*) pv, set the time range to 15 Minutes (Relative), and click Apply. -
On the General Configurations tab, configure the Search & Analysis Settings section.
-
: Select the
pvfield to display on the dial. -
: Use query results as the dial data source.
-
: Select the
pvfield. Its maximum value sets the upper bound of the dial. -
: Select the
pvfield to display its maximum value on the dial. -
: Format the maximum value with a thousands separator. For example,
5930displays as5,930.
-
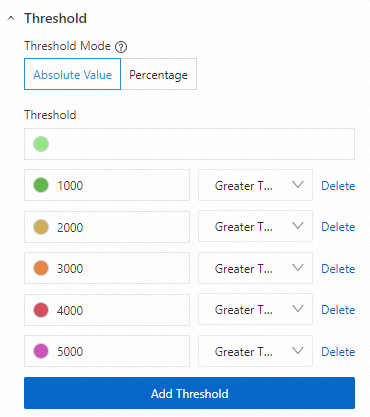
3. Configure thresholds
-
: Colors indicate different threshold ranges on the dial.
-
: Select Absolute Value to define thresholds as fixed numeric values.
-
: Set thresholds and colors. In this example, the dial color changes from light green (default) to green (>1,000), orange (>2,000), tangerine (>3,000), red (>4,000), and purple (>5,000) as
pvincreases.