The Trace Analysis page lets you analyze trace data for your application. You can view time-series charts for key metrics, a list of traces, and the Application Topology and End-to-End Aggregation tabs.
Procedure
-
Log on to the Managed Service for OpenTelemetry console. In the left-side navigation pane, click Applications.
-
On the Applications page, select a region in the top navigation bar and click the name of the application.
In the left-side navigation pane, click Trace Analysis.
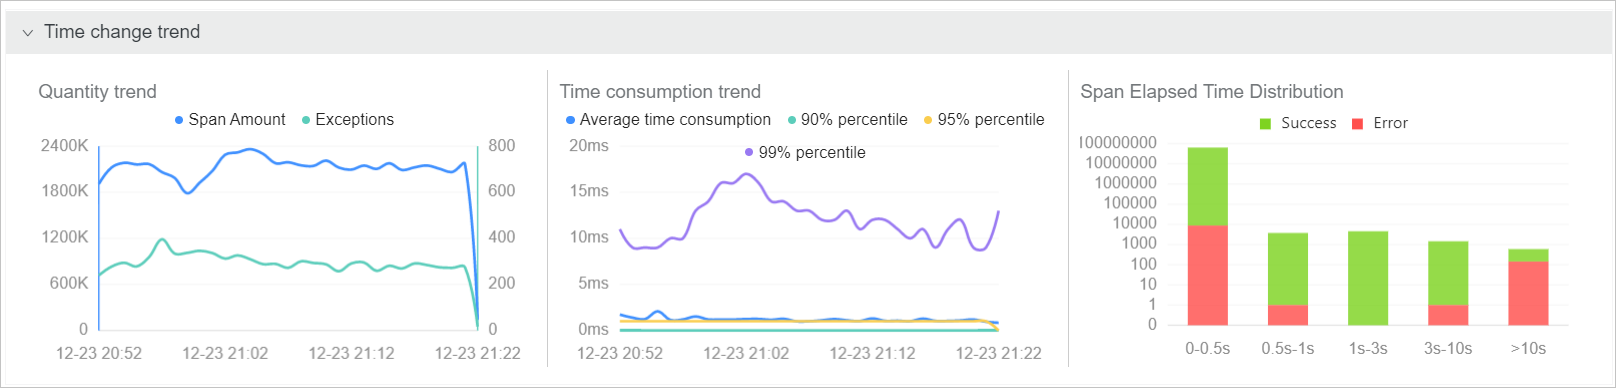
The top of the Trace analysis page displays the Time change trend section, which includes the Count trend, Duration trend, and Span duration distribution charts. The left panel shows the Span name filter list, and buttons on the right let you switch between the All Spans and API Calls views. Below this section are three tabs: Traces, Application Topology, and End-to-End Aggregation. The trace details table displays columns such as trace ID, time, span name, duration, and IP address. At the bottom left is the Machine/IP filter panel.
Enable real-time full data analysis
Enable real-time full data analysis to analyze the full set of trace data stored for a specific sampling ratio.
If you do not set a sampling ratio, or if the ratio is set to 100%, enabling this feature displays all stored data for your account.
In the upper-right corner of the Trace Analysis page, click Enable full real-time analysis.
In the panel that appears on the right, select a time period for the analysis.
The Trace Analysis page refreshes to display the full analysis data for the selected time period in real time.
Filter traces
Click the time picker in the upper-right corner of the Trace Explorer page to set a time range for your query.
Click the search box at the top of the Trace Explorer page. In the filter window that appears, configure the following conditions and then click Search.
Enter minimum and maximum values for Time Consumed to query for traces within that specific range.
Select the Abnormal checkbox to query for traces that contain exceptions.
Add filter conditions for Span Name, Machine/IP, or Tag. You can add multiple values for Span Name, Machine/IP, or Tag.
Time change trend
The Time change trend section displays a time-series chart for span and exception counts, a span duration trend chart, and a span duration distribution chart.
In the Time change trend section, you can perform the following actions:
Hover over a chart to view detailed statistics.
Click and drag across a time period in a chart to zoom in on that range.
Click a legend item to hide or show the corresponding data series.
Span name and Machine/IP lists
The Span Name and Machine/IP sections display lists of all spans and machines.
In the Span Name and Machine/IP sections, you can perform the following actions:
Enter a keyword in the search box and click the search icon to filter the items in the current list.
Click Span Count or Response Time in the upper-right corner of a list to sort the items in descending order.
Click a span name or a machine's IP address to add it as a filter condition.
Grouped list
On the Trace Analysis page, select a field from the Group By section.
On the right, select whether to scope the query to All spans or API calls.
All Spans: A list of groups for the current field, based on a query of all spans.
API call: A grouped list for the current field, based on a query of the first Span.
Click a field name in the results to view the corresponding list of traces.
Traces
The Traces area displays the trace ID, time, span name, duration, and IP address for each trace.
In the Traces area, you can perform the following actions:
Click a trace ID to view its waterfall chart. For more information, see Waterfall chart.
Hover over a span name to view details such as its duration, start time, tags, and log events.
Application topology
The Application topology tab displays a dependency graph between applications, along with metrics such as request percentage, call multiplier, and duration ratios. For performance reasons, Application topology can aggregate up to 5,000 traces.
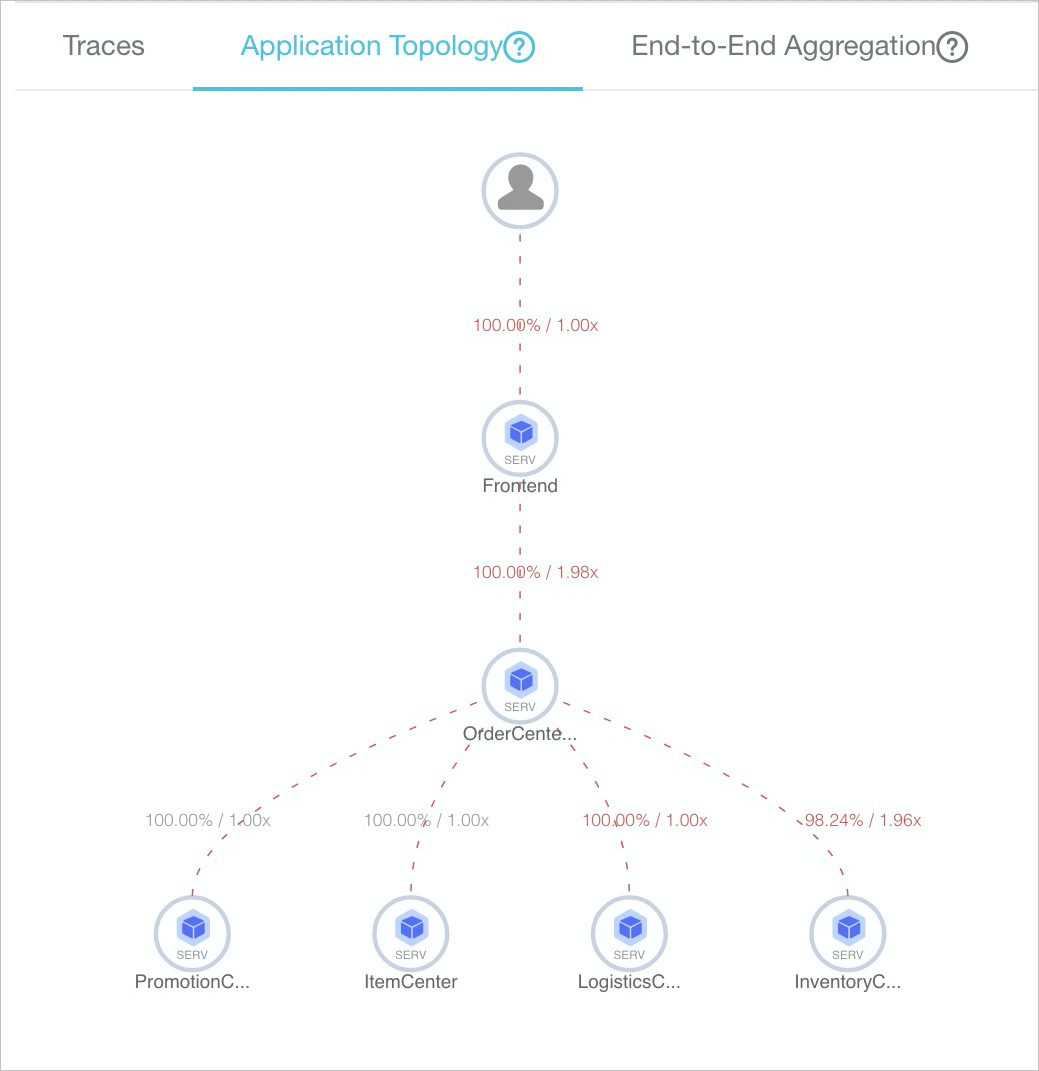
Request percentage = Number of outbound requests / Total number of inbound requests. For example, if an upstream application A receives 100 requests but only makes 90 requests to a downstream application B, the request percentage from A to B is 90%. (This is because application A may contain an
ifstatement to filter requests, which causes some requests to not be passed to application B.)Call multiplier = Number of spans for outbound calls from an application / Total number of spans for the application. For example, if 100 spans enter upstream application A, and 300 spans are generated from A to call downstream application B, the call multiplier from A to B is 3. For example, if the call from A to B is displayed as 90%/3x, this indicates that 90% of the requests to application A call application B, and application A calls application B three times on average.
End-to-end aggregation
The End-to-end aggregation tab displays a table of traces aggregated by span name and application name. For performance reasons, this real-time aggregation processes up to 5,000 traces.
Number of requests/Request percentage: The request percentage is the percentage of requests that call the current Span node. For example, if the total number of requests is 100 and the request percentage is 10%, it means that 10 requests call the current Span. Formula = Number of requests for the current Span / Total number of requests × 100%.
Span count/Request multiplier: The request multiplier is the average number of times the current span is called per request. For example, 1.5x means that on average, each request calls the current span 1.5 times. The formula is: Span count / Number of requests that include the span.
Average self-elapsed time/Proportion: Average self-elapsed time is the average duration of a span, excluding the time spent in its child spans. For example, if Span A has a duration of 10 ms and its child Span B has a duration of 8 ms, the self-elapsed time of Span A is 2 ms. The formula is: Span duration - Sum(duration of child Spans). For asynchronous calls, the durations of child spans are not subtracted, and the formula is: Span duration.
Exception count/Exception percentage: Exception percentage is the percentage of requests that have exceptions. For example, an exception percentage of 3% means that 3% of requests have exceptions. Formula: Number of exceptional requests / Total number of requests. The number of exceptional requests is not equal to the exception count. When the request multiplier is greater than 1, a single exceptional request may correspond to multiple exceptions.
In the Trace Aggregation section, you can perform the following actions:
Hover over a span name (in blue) to see a tooltip with Recommended Trace. Click a trace ID to view its waterfall chart. For more information, see Waterfall chart.
Click an application name to view its overview page. For more information, see Application overview.
Waterfall chart
The trace page displays the waterfall chart, which shows information such as span names, a timeline, application names, start times, IP addresses, and statuses.
The IP Address column displays either an IP address or a machine name, depending on your display settings on the Application Settings page. For more information, see Manage applications and tags.
In the Span Name column, you can hover over a span name to view its duration, start time, tags, and log events. Clicking a span opens its details panel. The left side of the panel lists the methods within the trace, such as checkAndRefresh, getAppConfig, and writeLog. The right side shows details for the selected span. These details include its Service, Duration (in ms), and Start Time. The panel also contains a Tags area, which displays key-value pairs such as pid, sn, and userId, and a Log Events area.