When CPU usage on your Windows instance reaches 80% or higher, use this guide to identify the cause and apply the appropriate fix.
Symptoms
CPU usage on the Windows instance is 80% or higher.
Causes
Common causes:
-
Virus or trojan infection.
-
Third-party antivirus software running on the instance.
-
Abnormal applications or drivers, high I/O usage, or high interrupt rates.
Solutions
Step 1: Locate the problem
Use tools such as Task Manager or Resource Monitor to identify the process causing high CPU usage.
The following steps use Resource Monitor on Windows Server 2022 as an example.
-
Connect to the instance through VNC. Connect to a server for rescue (console).
-
At the bottom of the desktop, click the Search button, enter
Resource Monitor, and then click OK. -
Click the CPU tab. In the process area, sort by the CPU column to identify processes with high CPU usage and their corresponding PIDs.
In the Resource Monitor window, check whether any processes have excessively high CPU utilization.
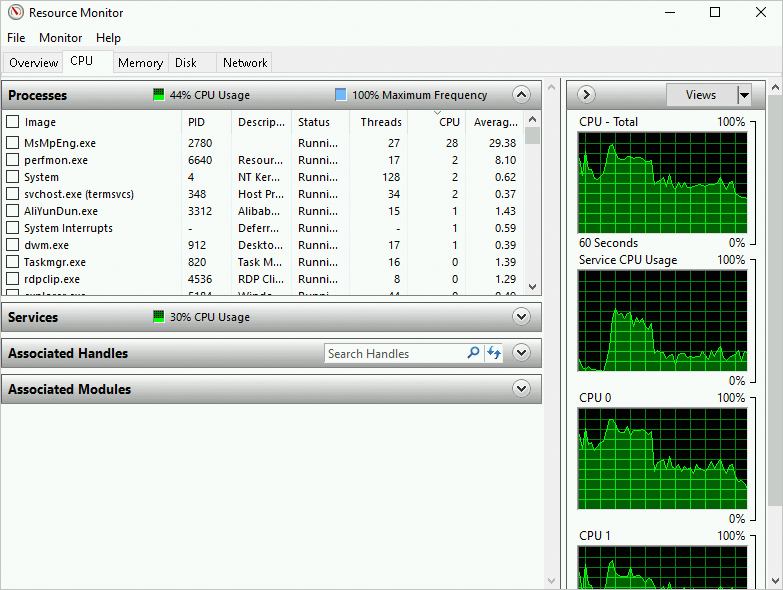
For processes that consume high CPU resources, note their process IDs (PIDs) and program names.
Open Task Manager. On the Details tab, find the abnormal process name and its corresponding PID that you identified in Resource Monitor. Right-click the process name and select Open file location to determine if the process is a malicious program.
Step 2: Analyze and resolve the issue
Identify whether the high-CPU process is normal or abnormal, then follow the corresponding steps.
|
Possible cause |
Operation |
|
Normal process |
Frequent business access or Windows services such as the update service can consume high CPU resources. Note
|
|
Abnormal process |
Malicious programs may disguise themselves as system processes such as svchost.exe or Tcpsvcs.exe, causing high CPU usage. Manually identify and terminate the abnormal processes. Note
If you cannot identify whether a process is malicious, search for the process name online. Before deleting the process, back up your data. Create a snapshot.
|
Diagnostic tools
The following tools help identify the cause of high CPU usage on Windows instances.
Task Manager
Task Manager lists running applications and their CPU usage.
On the Processes tab of Task Manager, processes are sorted by CPU usage in descending order. Antimalware Service Executable uses 26.7% CPU and 264.2 MB memory, making it the process with the highest CPU consumption.
On the Performance tab, right-click the CPU utilization graph and select .
If a single process spikes to nearly 100% while other processes remain stable, the cause may be network I/O processing.
Resource Monitor
Resource Monitor provides a graphical view of CPU usage and lets you search processes by handle or module.
Click the CPU tab. In the Processes area, use the CPU column to check the CPU usage of each process. The line chart on the right helps you observe CPU usage trends.
The CPU utilization line chart shows two noticeable usage spikes (current overall utilization is 5%). The runtime environment is a virtual machine (Intel Xeon Platinum, 2 virtual processors, base speed 2.50 GHz).
Process Explorer
Process Explorer is a Microsoft Sysinternals tool that inspects thread call stacks to locate problematic drivers. Configure the correct symbols before use. Process Explorer.
The Process Explorer interface displays all running processes in a tree view. The main columns include Process (process name), CPU (CPU usage), Private Bytes, Working Set, PID, Description, and Company Name. The status bar at the bottom shows system-wide resource usage, including CPU Usage, Commit Charge, Processes (total process count), and Physical Usage (physical memory usage). You can select a target process in the process list to further examine the Call Stack of its threads for problem diagnosis.
Performance Monitor
Performance Monitor collects performance counters from various system components. Check the following counters to analyze CPU resource consumption.
Key performance counters:
-
\Processor(_Total)\% Processor Time: The percentage of time that the processor executes a non-idle thread.\Processor(_Total)\% Processor Time=\Processor(*)\% User Time+\Processor(*)\% Privileged Time. -
\Processor(*)\% User Time: Time the processor spends executing application code. Use this counter to identify which application or function consumes the most CPU time. -
\Processor(*)\% Privileged Time: Time spent on kernel-level system calls, including drivers, I/O request packets (IRPs), and context switches. IfPrivileged Timeexceeds 30%, the instance likely has high I/O throughput.When
% Privileged Timeis high, check% DPC Time,% Interrupt Time, andContext Switches/sec.-
High
% DPC Timeand% Interrupt Timevalues indicate a device performing excessive operations or with poor performance. -
A high
Context Switchvalue indicates frequent kernel switching between processes or threads. The Case of the 2 Million Context Switches and Mark Russinovich's The Case of the System Process CPU Spikes.A high
Context Switches/secvalue indicates too many threads in the Ready state. Reduce the thread count to resolve this.
-