SAE auto scaling scales out application instances within seconds when traffic spikes and scales them in after peaks subside, keeping your applications stable with minimal operational overhead. Taking an e-commerce promotion as an example, this topic walks through deploying applications, configuring scaling rules, monitoring in real time, and optimizing post-event — ensuring your platform handles demand surges reliably.
Auto scaling workflow
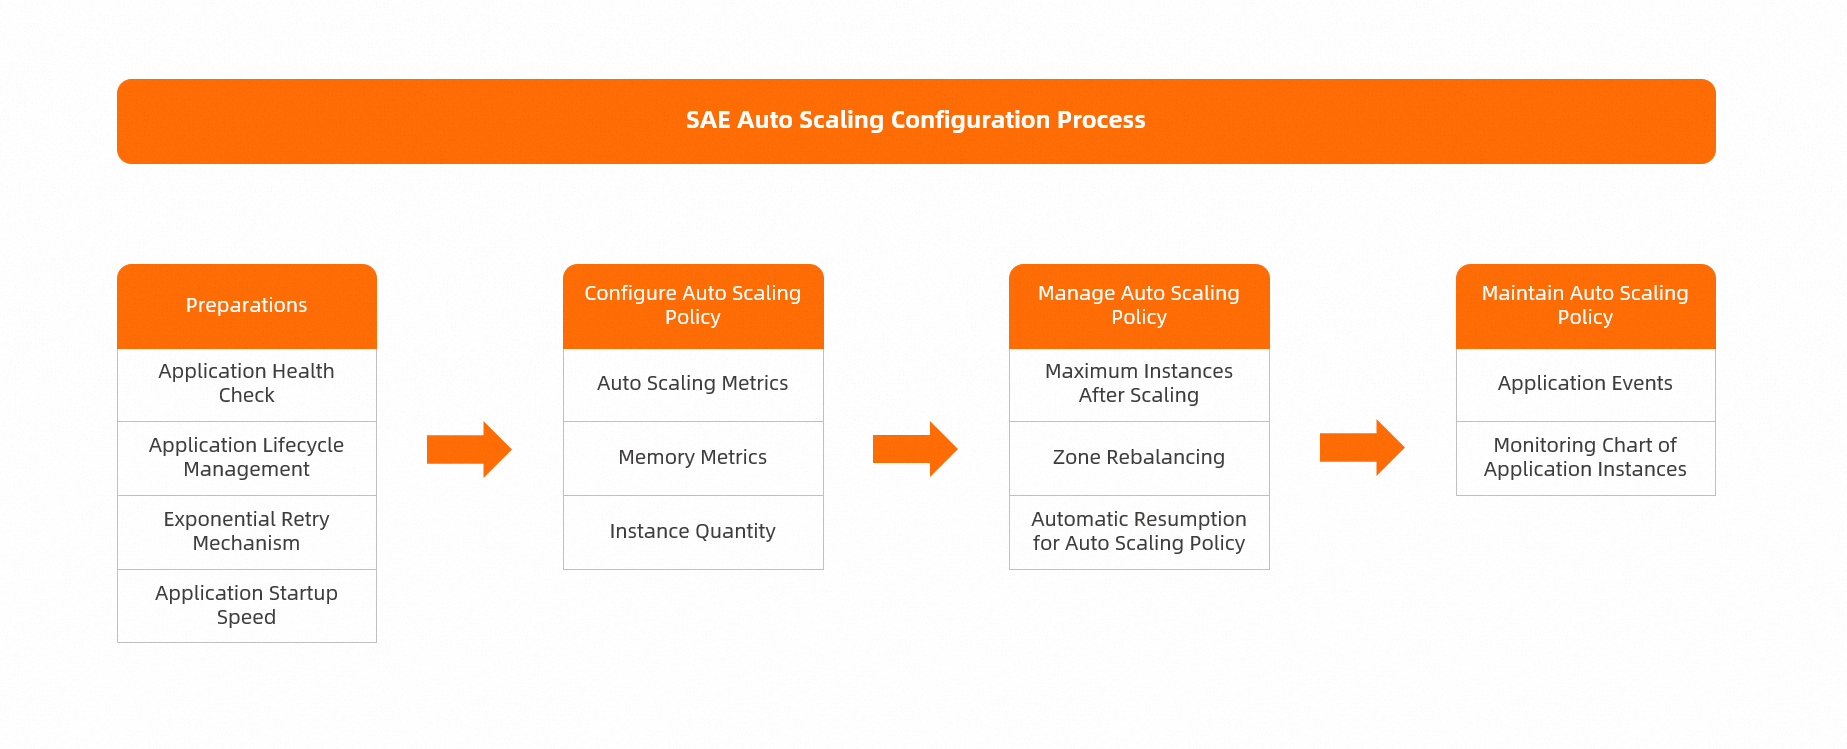
The following figure shows the end-to-end workflow for SAE auto scaling.
Prepare your application
-
Configure a health check: Ensures traffic is routed to an instance only after it has started and is ready to serve requests, maintaining overall availability during scaling. For more information, see Set a health check.
-
Configure application lifecycle management: Ensure graceful shutdown during scale-in by configuring PreStop Settings. For more information, see Set up application lifecycle management.
-
Implement an exponential backoff mechanism for service calls in your Java application to handle failures caused by scaling delays, slow startups, or ungraceful shutdowns.
-
Optimize your application's startup speed.
-
Package optimization: Minimize external factors such as class loading and caching to reduce startup time.
-
Image optimization: Reduce image size to shorten pull times when creating instances. You can use open-source tools to analyze and streamline image layers.
-
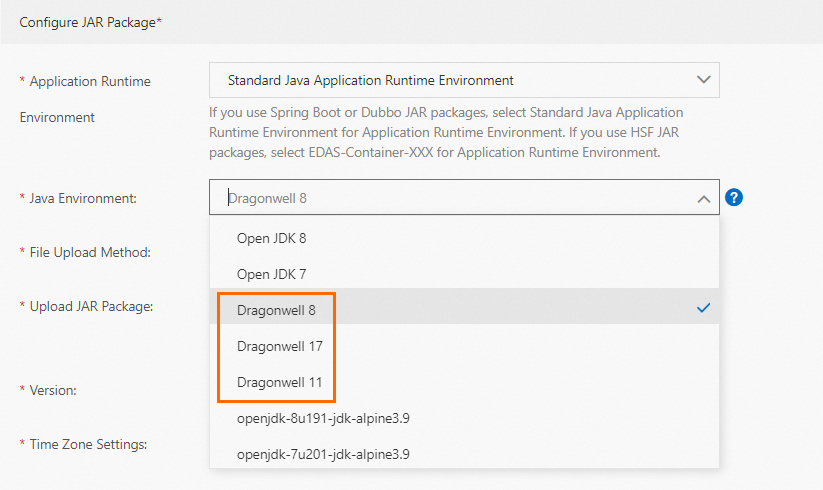
Java application startup optimization: Enable application acceleration when creating an application in SAE by selecting the Dragonwell 11 environment.
-
Configure an auto scaling policy
Choose scaling metrics
SAE supports multiple metrics from Basic Monitoring and Application Monitoring. Configure these metrics based on whether your application is CPU-intensive, memory-intensive, or I/O-intensive.
Review historical data for relevant metrics from Basic Monitoring and Application Monitoring — such as peak values, P95, or P99 over the last 6 hours, 12 hours, 1 day, or 7 days — to estimate a target value. Use a load testing tool such as Performance Testing Service (PTS) to evaluate your application's peak capacity, including its concurrent request limit, resource requirements (CPU and memory), and high-load response behavior.
When you configure an auto scaling policy, consider the following factors:
-
Balance availability and cost when setting metric target values:
-
Availability-optimized strategy: Set the metric value to 40%.
-
Balanced strategy: Set the metric value to 50%.
-
Cost-optimized strategy: Set the metric value to 70%.
-
-
Review dependencies such as upstream and downstream services, middleware, and databases. Configure corresponding scaling policies or throttling and degradation mechanisms to maintain end-to-end availability during scale-out.
After configuring your scaling policy, monitor and adjust it to align capacity with actual application load. For more information about monitoring, see View Basic Monitoring data.
Configure memory metrics
For Java applications, runtime optimization improves the correlation between memory metrics and business load by releasing physical memory. Using the Dragonwell runtime with the ElasticHeap JVM parameter enables dynamic scaling of Java heap memory, reducing physical memory consumption at runtime. For more information about ElasticHeap, see G1ElasticHeap.
We recommend the Dragonwell+ElasticHeap Periodic uncommit (automatic) mode. For detailed steps, see Deploy a Java application and Set a startup command.
-
Java Environment: In the Configure JAR Package section, select a Dragonwell configuration from the Java Environment drop-down list.
-
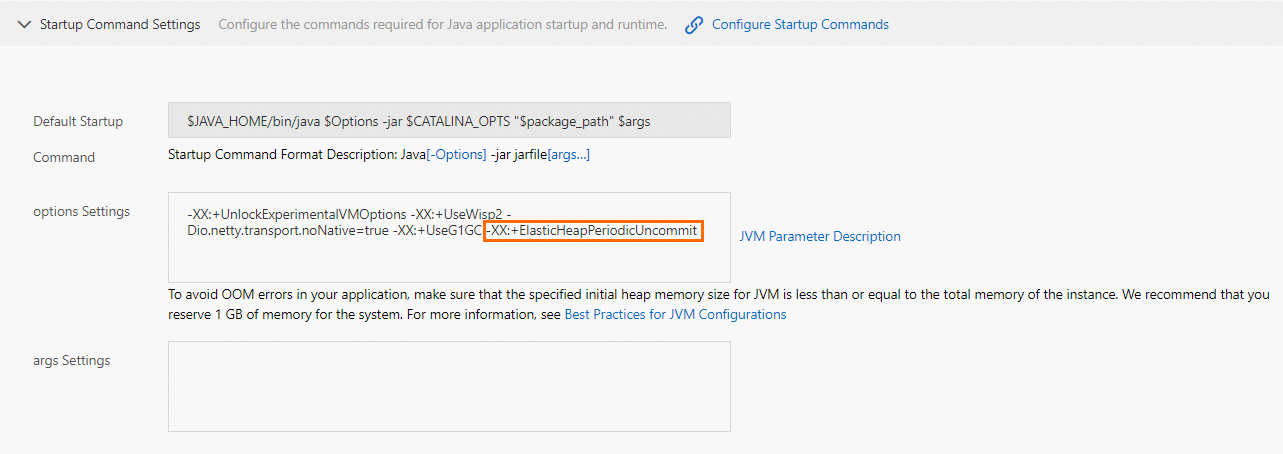
JVM parameter: In the Startup Command Settings section, enter -XX:+ElasticHeapPeriodicUncommit.
Memory-based scaling is not suitable for some applications that use dynamic memory management, such as those relying on Java JVM memory management or Glibc Malloc and Free operations. If these applications do not promptly release idle memory to the operating system, instance memory consumption does not decrease in real time, which can also prevent scale-in from triggering because the average memory consumption across instances remains high.
Configure instance count
-
Minimum instances
Set the minimum instance count to 2 or more and configure vSwitches across multiple zones. This prevents application downtime if an instance is evicted due to a node failure or if no instances are available in a zone.
-
Maximum instances
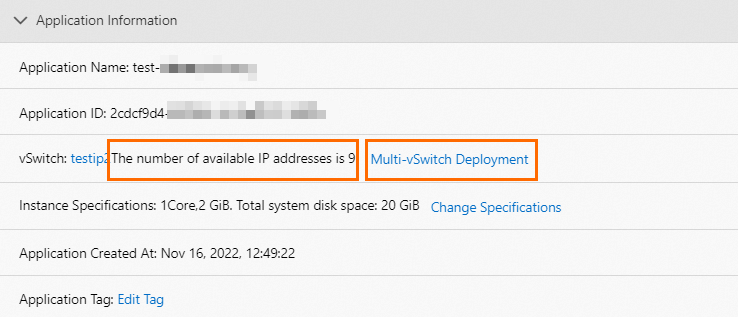
Ensure that the maximum instance count is less than or equal to the number of available IP addresses in the vSwitch to prevent scale-out failures caused by IP address exhaustion.
Check the available IP addresses for the current application in the Application Information section on the Basic Information page. If the count is low, replace or add a vSwitch.
Observe the auto scaling process
Maximum instance limit
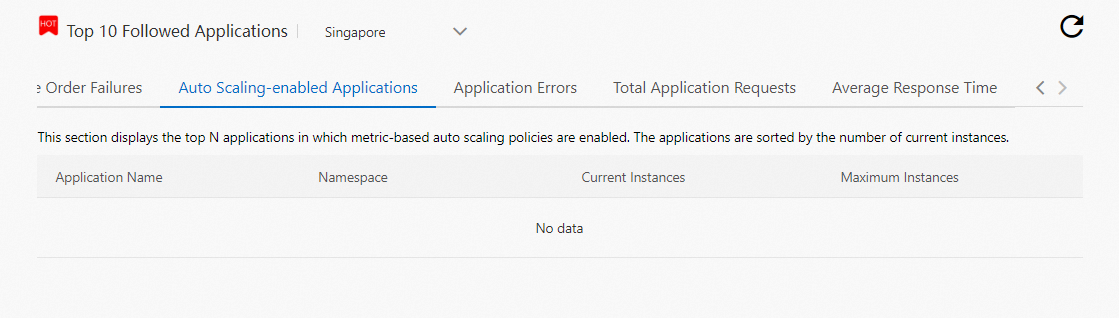
On the application's Overview page, you can view its auto scaling status. Monitor applications that reach their maximum instance limit and re-evaluate their scaling configuration.
If a single application needs to scale out to more than 50 instances, join the DingTalk group (group ID: 32874633) to apply for the allowlist.
Zone rebalancing
After a scale-in event, instances may become unevenly distributed across zones. View the zone of each instance in the instance list on the application's Basic Information page. If the distribution is imbalanced, trigger zone rebalancing by performing a Restart on an instance.

Automatic resumption
When you perform a change order such as deploying an application, SAE temporarily pauses the auto scaling policy for that application to prevent conflicts. To restore the policy automatically after the change order completes, select Automatic on the Deploy Application page.

Auto scaling maintenance
Application events
On the Application Events page, you can observe SAE auto scaling behavior, including the time and type of scaling actions. Use this information to evaluate and adjust your scaling policy as needed. For more information, see View application events.

Application instance trend chart
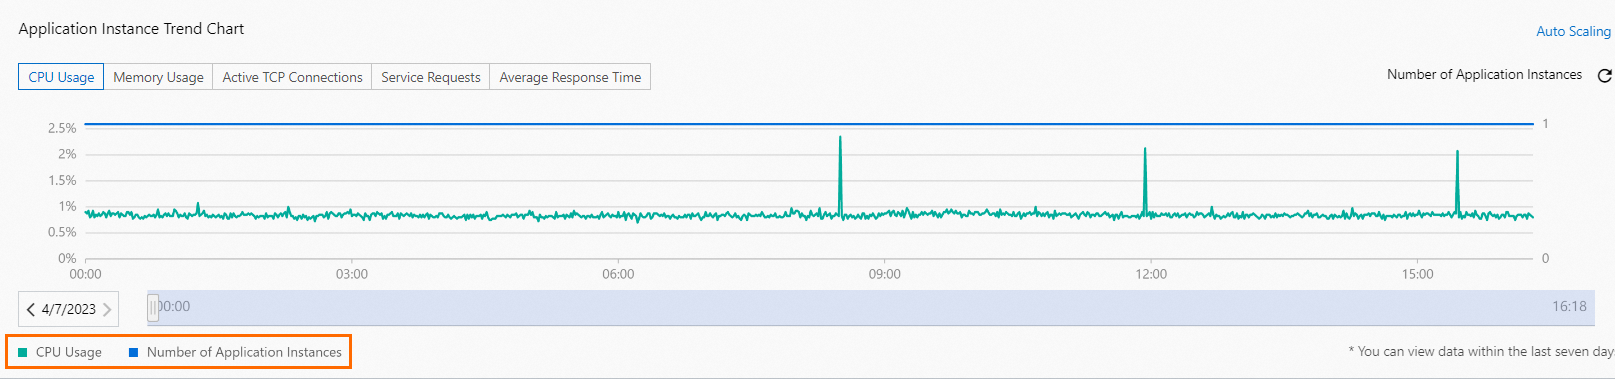
On the application's Basic Information page, the Basic Information tab contains the Application Instance Trend Chart, which displays the last 7 days of monitoring metrics including CPU utilization, memory usage, active TCP connections, service requests, and average response time.