High CPU utilization or CPU utilization surge may affect query performance and slow down responses. This topic describes how to view the CPU utilization and troubleshoot the issues that cause high CPU utilization of an ApsaraDB RDS for SQL Server instance.
View CPU utilization
You can view the CPU utilization of your RDS instance in the ApsaraDB RDS console.
The shared instance family supports the reuse of CPU resources. When you select the shared instance family, the performance of your RDS instance may be limited due to the reuse of CPU resources even if the CPU utilization of the instance is not high. If you require stable and high performance, we recommend that you select the dedicated instance family.
If your RDS instance uses an instance type with fewer resources but encounters high concurrency, the CPU resources may also be exhausted. If you require stable and high performance, we recommend that you upgrade the instance type.
Method 1: View the CPU utilization on the Monitoring and Alerts page
Go to the Monitoring and Alerts page of your RDS instance. On the Standard Monitoring tab, view the CPU utilization of your RDS instance.

Method 2: View the CPU utilization on the Autonomy Services page
Your RDS instance does not run SQL Server 2008 R2 with cloud disks.
Your RDS instance resides in one of the following regions: China (Hangzhou), China (Shanghai), China (Qingdao), China (Beijing), China (Zhangjiakou), China (Hohhot), China (Ulanqab), China (Shenzhen), China (Heyuan), China (Guangzhou), China (Chengdu), China (Hong Kong), Singapore, and UAE (Dubai).
In the left-side navigation pane of the instance details page, choose Autonomy Services > Performance Optimization. On the Performance Insight tab of the page that appears, view the CPU utilization of your RDS instance.

Analyze CPU metrics
Causes
In most cases, a sudden increase in CPU utilization is caused by the following issues:
The number of query requests suddenly increases. For example, your workloads suddenly increase or the cache penetration occurs at the data caching layer.
The CPU overhead for query requests suddenly increases. For example, new query requests are processed by using an inefficient method or the execution plans of some query statements change.
The frequency at which the system compiles execution plans for query statements significantly increases. For example, if a large amount of data needs to be cached, the number of execution plans that are cached and the cache hit ratio significantly decrease. In this case, existing execution plans cannot be reused, and the system must frequently compile execution plans for SQL statements. As a result, the overall CPU overhead of your RDS instance significantly increases.
A parameter sniffing issue occurs because the cached execution plans used for most workloads are not optimal.
Issue analysis
In the left-side navigation pane of the instance details page, choose Autonomy Services > Performance Optimization. On the Performance Insight tab of the page that appears, view the following metrics to identify the causes of the increase in the CPU utilization of your RDS instance.
Up to eight types of metrics can be displayed on the tab. If you cannot find the following metrics on the tab, you can click Custom metric in the upper-right corner of the Performance Insight tab. In the dialog box that appears, you can select the metrics that you want to display on the tab.
Metric | Analysis | |
QPS | If the value of the QPS metric increases at the same rate as CPU utilization, the increase in CPU utilization is caused by an increase in the number of query requests. This indicates that the increase in CPU utilization does not lie in your RDS instance. You must analyze your application to troubleshoot the increase in CPU utilization. |
|
Page_Lookups/sec | The Page_Lookups/sec metric indicates the cumulative number of pages that are logically read per second to process query requests. In most cases, the value of the Page_Lookups/sec metric increases because the system uses an inefficient method to execute query statements. If the value of this metric is high, the CPU overhead for query requests is high. If the value of the Page_Lookups/sec metric increases at the same rate as CPU utilization but the value of the QPS metric remains relatively stable, the CPU overhead for query statements increases. In this case, you must identify the types of query statements that cause the increase in CPU utilization. Then, you can optimize these types of query statements to reduce CPU utilization. |
|
Sqlcompliations | The Sqlcompliations metric indicates the number of compile operations per second for query requests. If the value of the Sqlcompliations metric increases at the same rate as CPU utilization but the value of the QPS metric remains relatively stable, the increase in CPU utilization may be caused by the CPU overhead that is required to compile execution plans for query requests. You can further check the Cache_Object_Counts and Cache_Pages metrics that are related to the number of execution plans cached. If the values of these metrics significantly decrease, the increase in CPU utilization may be caused by significantly high pressure on the cache. In these cases, an effective solution is to increase the memory capacity of your RDS instance by changing instance specifications. For more information, see Change instance specifications and Instance types for primary ApsaraDB RDS for SQL Server instances. |
|


Examples
The following figure shows a sample case.
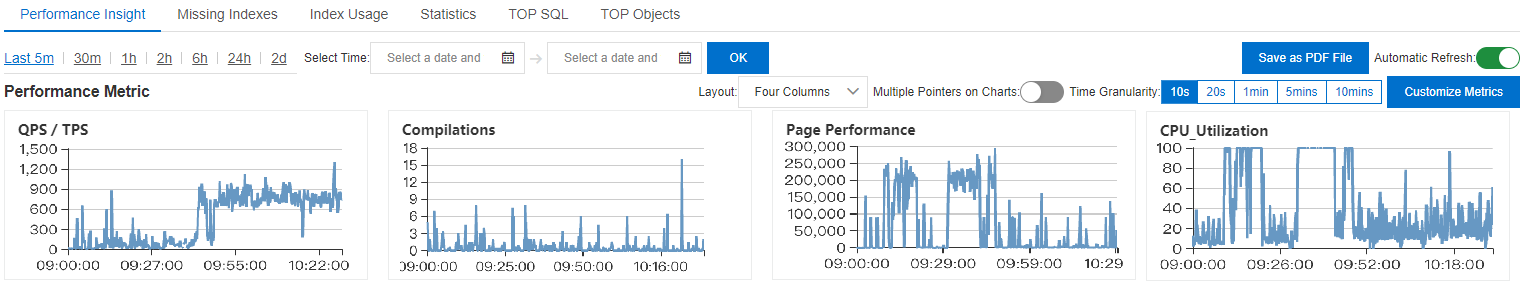
The CPU utilization statistics show that the increase in CPU utilization occurs from 09:10 to 09:20 and from 09:30 to 09:40. However, the value of the QPS metric does not increase during these periods of time. The value of the QPS metric increases after 09:40. Therefore, the increase in CPU utilization is not caused by an increase in the number of query requests.
The value of the Sqlcompliations metric does not increase during these periods of time, and the absolute value of this metric is low. Therefore, the increase in CPU utilization is not caused by the CPU overhead that is required to compile execution plans for query statements.
The value of the Page_Lookups/sec metric increases at the same rate as CPU utilization during these periods of time. Therefore, the increase in CPU utilization may be caused by the high CPU overhead that is required to process some query requests during these periods of time.
You must identify the query statements that require high CPU overhead during these periods of time. If the value of the Page_Lookups/sec metric increases, CPU utilization also increases. Some query statements may require high CPU overhead for execution but medium CPU overhead for logical read operations. Therefore, you must analyze the query statements that are executed during these periods to troubleshoot the increase in CPU utilization.
Analyze active sessions
Causes
The most common cause of a sudden increase in CPU utilization is the inefficiency of the method that is used to execute query statements. You can use the Average Active Sessions (AAS) metric of the Performance Insight to identify and analyze the query statements that are executed by using an inefficient method.
Issue analysis
The system checks active sessions every 10 seconds and records the SQL statements, query hash values, execution plans, and wait events of active query requests. In most cases, when a query statement that requires high CPU overhead is running, the value in the Wait Category column of the query statement on the Waits tab is CPU.
The SQL Hash column on the SQL tab displays the hash values that are generated after SQL statements are structured based on parameters. The hash values are used to mark and aggregate SQL statements that use the same structure. This way, the system can classify and aggregate SQL statements based on the structures of the SQL statements. You can query the latest statistics of an SQL statement from the sys.dm_exec_query_stats system view based on the value in the query_hash column of the SQL statement.
Identification
Click the hyperlink in the SQL Hash column on the SQL tab to view the AAS statistics of the SQL statement.
Click Analyze in the Execution Plan column on the SQL tab to view the execution plan of the SQL statement. You can also view the optimization suggestions that are generated by autonomy services.
The preceding optimization suggestions are suitable for SQL statements with simple structures. If the SQL statements on your RDS instance have complex structures, we recommend that you further analyze and test the execution plans of these SQL statements based on the preceding optimization suggestions. For more information about the AAS metric, see Use the performance insight feature.
Analyze top N SQL statements
Causes
You can use the ASS metric of the autonomy services to identify the SQL statements that cause an increase in CPU utilization during a specific period of time. However, information such as the execution frequency, average CPU overhead, and overall CPU overhead of various SQL statements, is not provided. If you want to optimize the overall CPU utilization of your RDS instance, we recommend that you obtain the details about the SQL statements that consume the most CPU resources.
Issue analysis
SQL Server can automatically aggregate information about objects such as SQL statements and stored procedures. SQL Server also provides system views, such as sys.dm_exec_query_stats and sys.dm_exec_procedure_stats for you to view information about the objects. Then, you can identify the SQL statements that consume the most resources. The resources can be of various types.
The TOP SQL and TOP Objects report of the antonomy services and the top N query reports in SQL Server Management Studio (SSMS) are also based on system views. These reports are easier to use but are less flexible than system views.

Optimize parameter settings
The maximum degree of parallelism (MAXDOP) is used to limit the maximum number of threads that can be concurrently used by a single query request. In essence, multiple processors are collaborated to accelerate complex queries. For CPU-intensive queries, a high degree of parallelism (DOP) can shorten the execution period, but consumes more system scheduling resources and may cause contention. When you configure the parameter, you must consider the query response time and the overall throughput. We recommend that you configure the parameter based on the following description:
High-concurrency scenarios
The scenarios include online transaction processing (OLTP) systems. When the system needs to process a large number of concurrent requests and the execution time of most queries is less than 5 seconds, we recommend that you use the
MAXDOP≤4setting. If high-frequency index operations or partitioned table scans exist, you can use theMAXDOP=1setting to prevent the overheads of the parallel execution plans.Low-concurrency scenarios
The scenarios include online analytical processing (OLAP) systems and reporting systems. You can increase the DOP for a single complex query, such as big data aggregation and star joins. We recommend that you increase the DOP to a value that is calculated by using the following formula:
MAXDOP=min[(Number of logical CPU cores/Number of concurrent queries),8]. The maximum value of the parameter cannot be greater than 75% of the number of logical CPU cores. For example, you can set the parameter to a value greater than or equal to 48 for a system that has 64 CPU cores.
The default value of the MAXDOP parameter is 2 to reduce the risks of concurrency and resource contention. You can execute the EXECUTE sp_rds_configure 'max degree of parallelism', <value> statement to dynamically modify the parameter. After the parameter is modified, you must monitor the CXPACKET metric that specifies the CXPACKET wait type and the Scheduler Busy% metric that specifies the percentage of the time used by the SQL Server scheduler to process tasks. We recommend that you also modify the cost threshold for parallelism whose default value is 5.
References
What do I do if the CPU utilization of an ApsaraDB RDS for SQL Server instance is high?