This topic describes how to view the performance insight data of an ApsaraDB RDS for SQL Server instance. Database Autonomy Service (DAS) provides the performance insight feature for instance-level load monitoring, association analysis, and performance optimization. You can use the feature to evaluate loads and troubleshoot performance issues to make the RDS instance more stable.
Prerequisites
-
This feature is not available for ApsaraDB RDS for SQL Server 2008 R2 instances that use cloud disks.
-
This feature is available only for ApsaraDB RDS for SQL Server instances in the following regions: China (Hangzhou), China (Shanghai), China (Qingdao), China (Beijing), China (Zhangjiakou), China (Hohhot), China (Ulanqab), China (Shenzhen), China (Heyuan), China (Guangzhou), China (Chengdu), China (Hong Kong), Singapore, or UAE (Dubai).
Scenarios
Performance insight can be used in the following scenarios:
Performance metric analysis
Performance insight monitors the key metrics of your RDS instance and displays the status and trend of the loads on the instance. You can identify the sources and distribution of loads within a specific time range based on the trend charts of the key metrics.
Load evaluation
ApsaraDB RDS for SQL Server provides a trend chart of average active sessions (AAS) to eliminate the need to analyze the complicated trend charts of various metrics. The AAS trend chart shows all crucial performance data that you may need to evaluate the sources and bottlenecks of loads. For example, you can check whether the RDS instance is heavily loaded due to high CPU utilization, lock-waiting, or I/O latency, and identify the SQL statements that cause heavy loads.
Identification of the causes of performance issues
You can analyze the AAS trend chart and the multi-dimensional load source details to determine whether a performance issue is caused by improper instance specifications or the database architecture. You can also identify the SQL statements that cause the performance issue.
NoteThe AAS metric indicates the average number of active sessions in the RDS instance within a specific time range. The changes to the value of the AAS metric reflect the changes of loads on the RDS instance. The performance insight feature uses AAS as a key metric to measure loads on the RDS instance.
Procedure
Log on to the ApsaraDB RDS console and go to the Instances page. In the top navigation bar, select the region in which the RDS instance resides. Then, find the RDS instance and click the instance ID.
In the left-side navigation pane, choose .
-
Click the Performance Insight tab and select filter conditions.

Overview of the Performance Insight tab
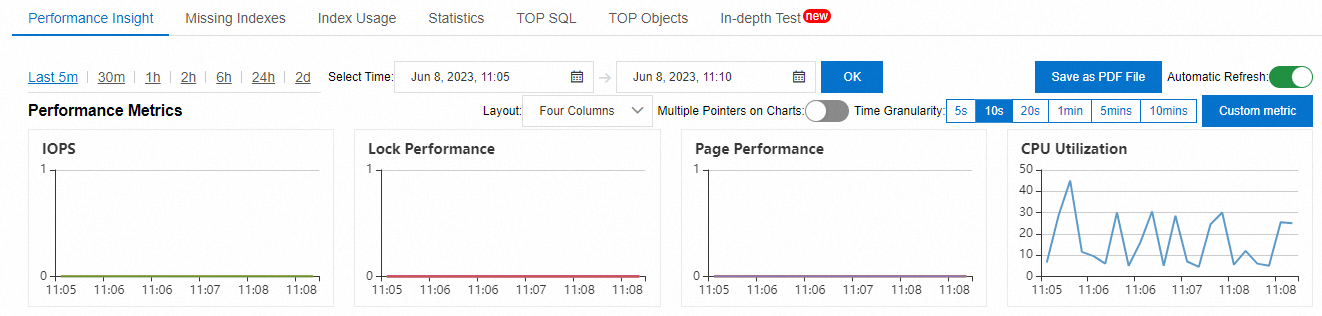
Performance Metrics
This section displays the trend charts of key metrics over a specific time range to help you understand the load status and resource bottlenecks of the RDS instance.
You can select or customize a different time range to view the trend charts of key metrics within that time range.
-
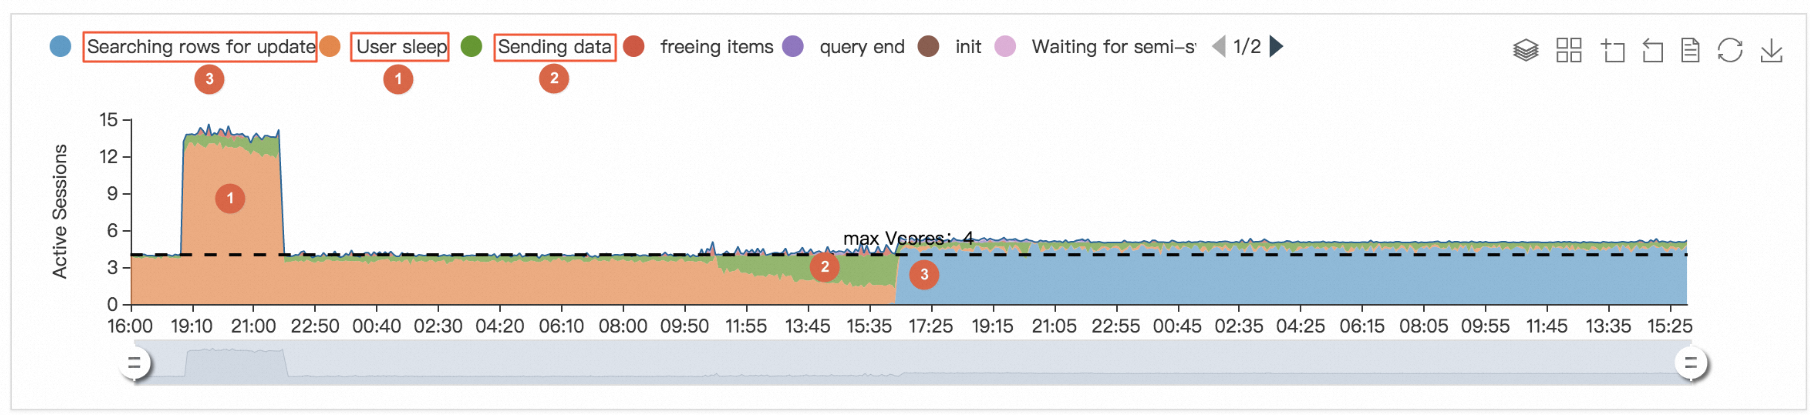
Average Active Sessions (AAS)
This section displays the AAS trend chart. After you identify the status of loads on the RDS instance based on the trend charts of key metrics, you can view the AAS trend chart to further identify the sources of loads.
 Note
NoteThe max Vcores metric indicates the maximum number of CPU cores that can be used by the RDS instance. The value of the max Vcores metric determines the processing capability of the RDS instance.
The AAS trend chart helps you identify the sources of loads on the RDS instance. In the example shown in the preceding figure, you can identify the sources of loads in three typical stages:
-
Initially, the instance load originates from User Sleep sessions.
-
As User Sleep sessions gradually decrease, the instance load shifts to Sending Data sessions.
-
As Sending Data sessions gradually decrease, the load shifts again, this time to Searching rows for update sessions.
This example proves that the AAS trend chart whose data is updated in real time can help you intuitively obtain the sources, distribution, and change patterns of the loads on an RDS instance.
-
-
Load sources from multiple dimensions
You can learn the trend of the loads for an ApsaraDB RDS for SQL Server instance by analyzing the trend chart of AAS. You can find the specific SQL statements that cause performance bottlenecks, and the related users, hosts, and databases.
This section displays the details about the sources of loads from multiple dimensions in a table. You can use the table to identify the SQL statements that cause heavy loads. You can also use the table to identify the AAS of each SQL statement.
NoteThe preceding figure shows that the value of the top 1 SQL statement is 0.75, which indicates that the AAS of the SQL statement in the given time range is 0.75.
The performance insight feature supports seven types of AAS. You can select an AAS type from the AAS Type drop-down list in the upper-right corner of the Average Active Sessions (AAS) section.
Item
Description
SQL
The AAS trends of the top 10 SQL statements.
Waits
The AAS trends of wait categories of the active sessions.
Users
The AAS trends of the users that have logged on to the RDS instance.
Hosts
The AAS trends of the hostnames or IP addresses of the clients from which the users log on to the RDS instance.
Commands
The AAS trends of different types of SQL statements.
Databases
The AAS trends of the databases in which your workloads run.
status
The AAS trends of active sessions.