When CPU utilization on an ApsaraDB RDS for SQL Server instance is high — including spikes to 100% — the root cause typically falls into one of three categories. Use the table below to identify your situation, then follow the corresponding resolution steps.
Before performing high-risk operations such as modifying instance configurations or data, check the disaster recovery and fault tolerance capabilities of the instance to ensure data security. We recommend that you create snapshots or enable backup (for example, enable log backup for an RDS instance) before making any changes. If you have exposed sensitive information such as usernames or passwords in the Alibaba Cloud Management Console, modify that information at the earliest opportunity.
| Symptom | Likely cause |
|---|---|
| QPS and CPU utilization rise together; no slow queries | High application load |
| Slow queries present; QPS and CPU curves do not match; high I/O per query | Excessive I/O from table scans |
| High CPU with parallel query execution; CXPACKET waits prominent | Excessive parallelism (CXPACKET waits) |
Excessive parallelism (CXPACKET waits)
Identify the cause
When SQL Server executes queries in parallel, threads process unequal amounts of data. Faster threads wait for slower threads to finish before combining results — these are CXPACKET waits. When accumulated CXPACKET wait time is high, CPU utilization rises.
Use Activity Monitor in SQL Server Management Studio (SSMS), or run the following query multiple times to check whether a large number of CXPACKET waits exist:
WITH [Waits] AS (
SELECT [wait_type],
       [wait_time_ms] / 1000.0 AS [WaitS],
       ([wait_time_ms] - [signal_wait_time_ms]) / 1000.0 AS [ResourceS],
       [signal_wait_time_ms] / 1000.0 AS [SignalS],
       [waiting_tasks_count] AS [WaitCount],
       100.0 * [wait_time_ms] / SUM ([wait_time_ms]) OVER() AS [Percentage],
                                    ROW_NUMBER() OVER(
                                                      ORDER BY [wait_time_ms] DESC) AS [RowNum]
FROM sys.dm_os_wait_stats
WHERE [wait_type] NOT IN ( N'BROKER_EVENTHANDLER',
                            N'BROKER_RECEIVE_WAITFOR',
                             N'BROKER_TASK_STOP',
                              N'BROKER_TO_FLUSH',
                               N'BROKER_TRANSMITTER',
                                N'CHECKPOINT_QUEUE',
                                 N'CHKPT',
                                  N'CLR_AUTO_EVENT',
                                   N'CLR_MANUAL_EVENT',
                                    N'CLR_SEMAPHORE', -- Maybe uncomment these four if you have mirroring issues N'DBMIRROR_DBM_EVENT', N'DBMIRROR_EVENTS_QUEUE', N'DBMIRROR_WORKER_QUEUE', N'DBMIRRORING_CMD', N'DIRTY_PAGE_POLL', N'DISPATCHER_QUEUE_SEMAPHORE', N'EXECSYNC', N'FSAGENT', N'FT_IFTS_SCHEDULER_IDLE_WAIT', N'FT_IFTSHC_MUTEX', -- Maybe uncomment these six if you have AG issues N'HADR_CLUSAPI_CALL', N'HADR_FILESTREAM_IOMGR_IOCOMPLETION', N'HADR_LOGCAPTURE_WAIT', N'HADR_NOTIFICATION_DEQUEUE', N'HADR_TIMER_TASK', N'HADR_WORK_QUEUE', N'KSOURCE_WAKEUP', N'LAZYWRITER_SLEEP', N'LOGMGR_QUEUE', N'MEMORY_ALLOCATION_EXT', N'ONDEMAND_TASK_QUEUE', N'PREEMPTIVE_XE_GETTARGETSTATE', N'PWAIT_ALL_COMPONENTS_INITIALIZED', N'PWAIT_DIRECTLOGCONSUMER_GETNEXT', N'QDS_PERSIST_TASK_MAIN_LOOP_SLEEP', N'QDS_ASYNC_QUEUE', N'QDS_CLEANUP_STALE_QUERIES_TASK_MAIN_LOOP_SLEEP', N'QDS_SHUTDOWN_QUEUE', N'REDO_THREAD_PENDING_WORK', N'REQUEST_FOR_DEADLOCK_SEARCH', N'RESOURCE_QUEUE', N'SERVER_IDLE_CHECK', N'SLEEP_BPOOL_FLUSH', N'SLEEP_DBSTARTUP', N'SLEEP_DCOMSTARTUP', N'SLEEP_MASTERDBREADY', N'SLEEP_MASTERMDREADY', N'SLEEP_MASTERUPGRADED', N'SLEEP_MSDBSTARTUP', N'SLEEP_SYSTEMTASK', N'SLEEP_TASK', N'SLEEP_TEMPDBSTARTUP', N'SNI_HTTP_ACCEPT', N'SP_SERVER_DIAGNOSTICS_SLEEP', N'SQLTRACE_BUFFER_FLUSH', N'SQLTRACE_INCREMENTAL_FLUSH_SLEEP', N'SQLTRACE_WAIT_ENTRIES', N'WAIT_FOR_RESULTS', N'WAITFOR', N'WAITFOR_TASKSHUTDOWN', N'WAIT_XTP_RECOVERY', N'WAIT_XTP_HOST_WAIT', N'WAIT_XTP_OFFLINE_CKPT_NEW_LOG', N'WAIT_XTP_CKPT_CLOSE', N'XE_DISPATCHER_JOIN', N'XE_DISPATCHER_WAIT', N'XE_TIMER_EVENT') AND [waiting_tasks_count] > 0 )

  SELECT MAX ([W1].[wait_type]) AS [WaitType],
             CAST (MAX ([W1].[WaitS]) AS DECIMAL (16, 2)) AS [Wait_S],
                  CAST (MAX ([W1].[ResourceS]) AS DECIMAL (16, 2)) AS [Resource_S],
                       CAST (MAX ([W1].[SignalS]) AS DECIMAL (16, 2)) AS [Signal_S],
                            MAX ([W1].[WaitCount]) AS [WaitCount],
                                CAST (MAX ([W1].[Percentage]) AS DECIMAL (5, 2)) AS [Percentage],
                                     CAST ((MAX ([W1].[WaitS]) / MAX ([W1].[WaitCount])) AS DECIMAL (16, 4)) AS [AvgWait_S],
                                          CAST ((MAX ([W1].[ResourceS]) / MAX ([W1].[WaitCount])) AS DECIMAL (16, 4)) AS [AvgRes_S],
                                               CAST ((MAX ([W1].[SignalS]) / MAX ([W1].[WaitCount])) AS DECIMAL (16, 4)) AS [AvgSig_S]
  FROM [Waits] AS [W1]
  INNER JOIN [Waits] AS [W2] ON [W2].[RowNum] <= [W1].[RowNum]
GROUP BY [W1].[RowNum]
HAVING SUM ([W2].[Percentage]) - MAX([W1].[Percentage]) < 95;
If CXPACKET appears near the top with a high percentage, parallelism is contributing to CPU pressure. Proceed to the resolution steps below.
If CXPACKET is not dominant, check the other causes in this article.
Resolution: limit parallelism per query
Use this approach when only specific queries trigger excessive parallelism.
Identify the top CPU-consuming queries by running the following statement to get the top 50 queries by total CPU time:
SELECT TOP 50 [Avg. MultiCore/CPU time(sec)] = qs.total_worker_time / 1000000 / qs.execution_count,
              [Total MultiCore/CPU time(sec)] = qs.total_worker_time / 1000000,
              [Avg. Elapsed Time(sec)] = qs.total_elapsed_time / 1000000 / qs.execution_count,
              [Total Elapsed Time(sec)] = qs.total_elapsed_time / 1000000,
              qs.execution_count,
              [Avg. I/O] = (total_logical_reads + total_logical_writes) / qs.execution_count,
              [Total I/O] = total_logical_reads + total_logical_writes,
              Query = SUBSTRING(qt.[text], (qs.statement_start_offset / 2) + 1, ((CASE qs.statement_end_offset
                                                                                    WHEN -1 THEN DATALENGTH(qt.[text])
                                                                                    ELSE qs.statement_end_offset
                                                                                END - qs.statement_start_offset) / 2) + 1),
              Batch = qt.[text],
              [DB] = DB_NAME(qt.[dbid]),
              qs.last_execution_time,
              qp.query_plan
FROM sys.dm_exec_query_stats AS qs CROSS APPLY sys.dm_exec_sql_text(qs.[sql_handle]) AS qt CROSS APPLY sys.dm_exec_query_plan(qs.plan_handle) AS qp
where qs.execution_count > 5 --more than 5 occurences ORDER BY [Total MultiCore/CPU time(sec)] DESC;
For SQL Server 2008 R2 instances, view slow query logs in the ApsaraDB RDS console instead: go to the instance details page, click Logs in the left navigation pane, and open the Slow Log Summary tab.
Review the execution plan of the high-CPU query. Add
OPTION (MAXDOP 1)at the end of the statement to force single-threaded execution:SELECT column1,column2 FROM table1 o INNER JOIN table2 d ON (o.d_id = d.d_id) OPTION (maxdop 1);
Resolution: limit parallelism at the instance level
Use this approach when parallelism is causing broad CPU pressure across many queries.
Check the current max degree of parallelism (DOP) setting:
SELECT * FROM SYS.CONFIGURATIONS
WHERE NAME LIKE '%MAX%';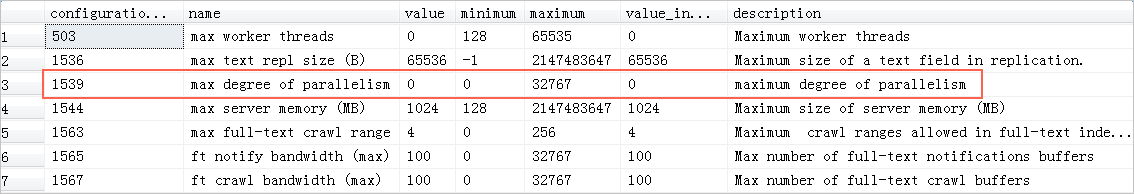
Set the maximum DOP to
1to limit all queries on the instance to single-threaded execution:sp_rds_configure 'max degree of parallelism',1;For SQL Server 2008 R2 instances, modify this parameter in the ApsaraDB RDS console. For details, see Reconfigure the parameters of an ApsaraDB RDS for SQL Server instance by using the ApsaraDB RDS console.
High application load
Identify the cause
This cause applies when:
No slow queries exist, or slow queries are not the root cause.
The queries per second (QPS) curve and CPU utilization curve move together — when QPS rises, CPU rises proportionally.
This pattern is common in optimized online transaction processing (OLTP) systems such as order processing systems, and in web applications with high read rates. Queries are simple and already efficient — there is little room to optimize them further.
Resolution
Optimize the application architecture or upgrade the instance type:
Upgrade the instance type to add CPU resources. For details, see Change the specifications of an ApsaraDB RDS for SQL Server instance.
Optimize queries to reduce logical I/O and improve application scalability. Minimize the number of rows each query reads.
Excessive I/O from table scans
Identify the cause
This cause applies when:
Slow SQL queries are present.
The QPS curve and CPU utilization curve do not match — CPU is high even when QPS is moderate.
High-CPU queries involve large numbers of I/O operations.
QPS is typically low, individual queries are expensive, and large amounts of data are scanned per query. These queries can be optimized.
Resolution
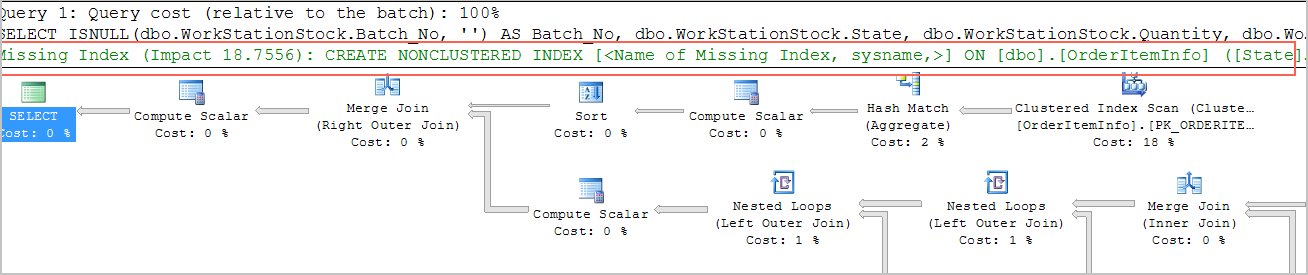
Check whether indexes exist on the large tables involved in slow queries. Review the execution plan and look for table scan operations. The execution plan surfaces missing index suggestions — use these as your starting point:
Use CloudDBA to detect and diagnose performance issues. For details, see View the storage information of an ApsaraDB RDS for SQL Server instance.
Prevent CPU saturation
Apply these practices to reduce the risk of CPU reaching 100%:
Set alert rules for CPU utilization so you can respond before saturation occurs and plan capacity changes in advance.
Optimize SQL during development. Apply query optimization rules early — reduce logical I/O and design for application scalability from the start.
Run stress tests before releasing new features. Use production data and test in a production-like environment before any new feature or module goes live.
Monitor with CloudDBA. Regularly check RDS instance performance to identify issues early.