To continuously monitor, diagnose, and tune the performance of an ApsaraDB RDS for MySQL instance in real time, use the real-time monitoring feature. It provides a live view of performance metrics and trends for your instance, helping you promptly detect and handle potential performance issues.
Prerequisites
Your ApsaraDB RDS for MySQL instance must run one of the following editions:
ApsaraDB RDS for MySQL 8.4 on RDS High-availability Edition or RDS Cluster Edition
ApsaraDB RDS for MySQL 8.0 on RDS High-availability Edition or RDS Cluster Edition
ApsaraDB RDS for MySQL 5.7 on RDS High-availability Edition or RDS Cluster Edition
ApsaraDB RDS for MySQL 5.6 on RDS High-availability Edition
ApsaraDB RDS for MySQL 5.5 on RDS High-availability Edition
Procedure
Go to the Instances page. In the top navigation bar, select the region in which the RDS instance resides. Then, find the RDS instance and click the ID of the instance.
In the left-side navigation pane, choose Autonomy Services > Diagnostics.
Click the Real-Time Monitoring tab.
On the Real-Time Monitoring page, you can view the Real-Time Monitoring of an instance in two views:
NoteFor an explanation of each metric, click Metric Description in the upper-left corner.
Real-time Charts tab: Displays real-time trend charts of your database instance's metrics.
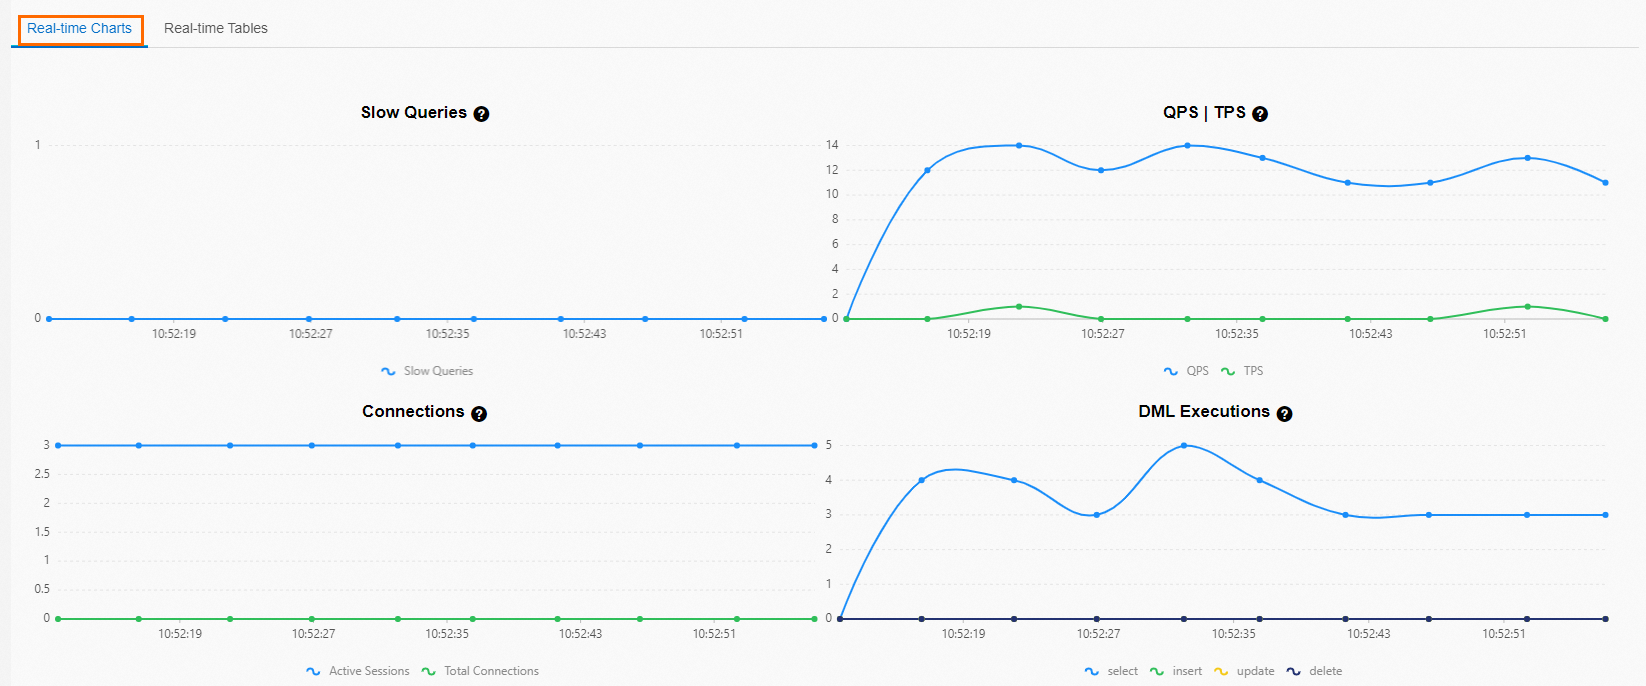
Real-time Tables tab: Displays the current values of key performance metrics for the database instance.
Performance metrics are refreshed every 5 seconds.
The performance metrics displayed in the table include QPS (Queries Per Second), InnoDB row operations (rows read, inserted, updated, and deleted), thread count (active and connected), and network traffic (inbound and outbound).
References
Common performance issues:
To learn how to use Autonomy Services to optimize and diagnose database performance, see Performance Optimization and Diagnostics.