When an ApsaraDB RDS for MySQL instance has a performance issue, use the Diagnostics feature to analyze instance performance over a specified time range. The feature visualizes diagnostic results so you can identify the root cause of the failure.
Prerequisites
Before you begin, ensure that your ApsaraDB RDS instance runs one of the following MySQL versions and RDS editions:
| MySQL version | Supported RDS editions |
|---|---|
| MySQL 8.0 | RDS High-availability Edition, RDS Enterprise Edition, RDS Cluster Edition |
| MySQL 5.7 | RDS High-availability Edition, RDS Enterprise Edition, RDS Cluster Edition |
| MySQL 5.6 | RDS High-availability Edition |
| MySQL 5.5 | RDS High-availability Edition |
Run diagnostics
Go to the Instances page. In the top navigation bar, select the region where the ApsaraDB RDS instance resides. Find the instance and click its ID.
In the left-side navigation pane, choose Autonomy Services > Diagnostics.
Click the Diagnostics tab.
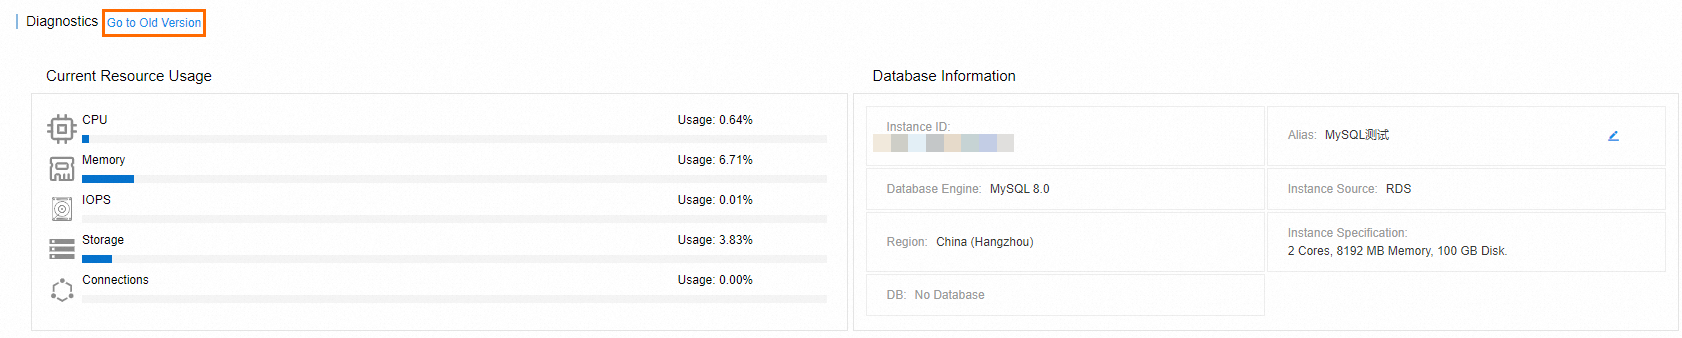
In the Diagnostics section, select a time range and view the diagnostic results.
To review past diagnostic results, click View History.
To switch between interface versions, click Go to Old Version or Go to New Version.
What's next
After reviewing the diagnostic results, use the following features to investigate and resolve the issue:
| Feature | Use when |
|---|---|
| Session management | You need to view or kill active sessions |
| Dashboard | You need a real-time overview of instance metrics |
| Deadlock analysis | The instance has deadlock errors |
| Slow SQL statements | Queries are running slower than expected |
| Storage analysis | Storage usage is high or growing unexpectedly |
FAQ
How are thread usage, connection usage, and maximum threads calculated?
Use the following formulas:
Thread usage = Number of active threads / Maximum number of threads
Connection usage = Number of current connections / Maximum number of connections allowed by the instance type
Maximum number of threads = Value of
thread_pool_size× (Value ofthread_pool_oversubscribe+ 1)
Why does thread usage exceed 100%?
The thread pool implementation for ApsaraDB RDS for MySQL does not cap the number of active threads. When active threads outnumber the calculated maximum, thread usage goes above 100%.