RDS Copilot is an AI-powered O&M assistant for ApsaraDB RDS. Built on a large language model (LLM) and an expert knowledge base, it lets you query instance data, diagnose performance issues, and automate routine inspections through natural language. RDS Copilot inherits your RAM permissions automatically and requires manual confirmation before executing any changes, keeping AI assistance both productive and safe.
Core capabilities
| Capability | What it does |
|---|---|
| AI chat | Query metadata and performance metrics across multiple instances using natural language. Retrieve resources in batches, filter anomalous instances, and run root cause analysis, without scripting. |
| Intelligent diagnostics | Get context-aware diagnostics on console pages such as slow query logs, error logs, and parameter settings. A single click provides structured analysis and optimization suggestions. |
| Custom Agent | Build AI assistants tailored to your team: define roles, inject internal knowledge bases, standardize output formats, and automate recurring inspections. |
Access RDS Copilot
Log on to the RDS console and open the chat interface from any of the following entry points:
-
Click the
 icon in the right-side sidebar.
 -
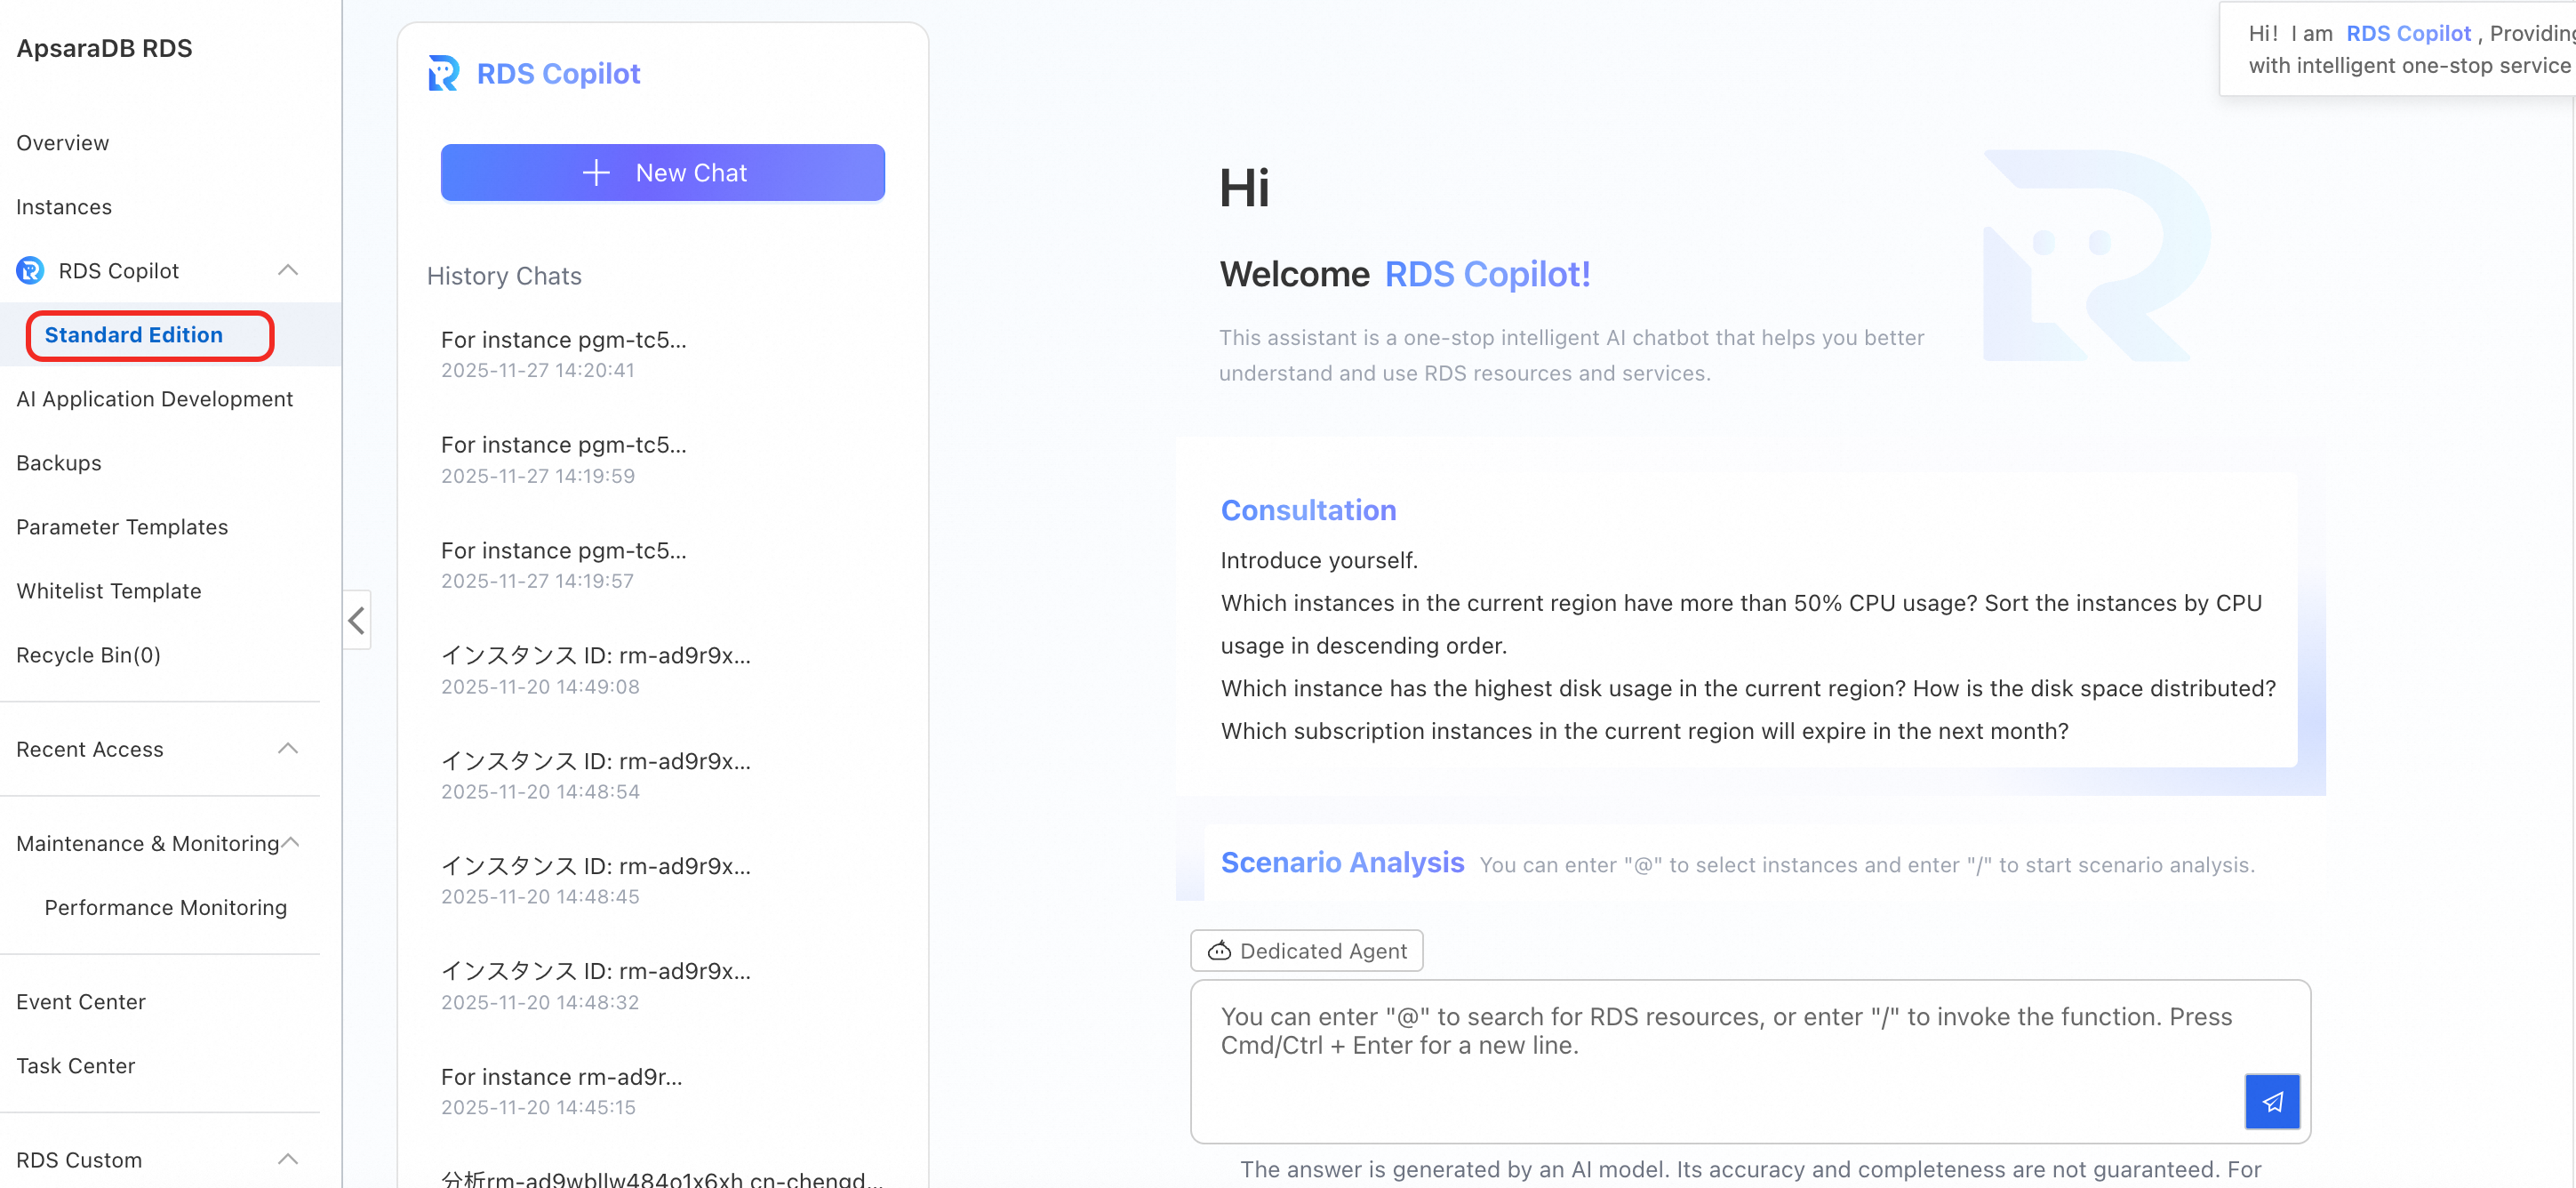
Click RDS Copilot in the left navigation pane.
-
Choose Self-Service > RDS Copilot > Standard Edition from the left navigation pane.
If you use a RAM user to access RDS Copilot, the RAM user must have the AliyunRDSAIFullAccess permission or a higher-level permission. For more information, see Grant permissions to a RAM user to access an RDS instance.
Billing
The Standard Edition of RDS Copilot is currently in free public preview. All features are available at no cost.
AI chat
RDS Copilot understands natural language questions about your instances. Ask about resource usage, performance anomalies, or compliance status for a single instance or an entire region.
Use cases
-
Global resource query: Retrieve configuration, performance metrics, and metadata for multiple instances by tag or region, without scripting.
-
Root cause analysis: When issues such as high response latency or sudden load spikes occur, RDS Copilot correlates SQL execution, parameter settings, and system resources to pinpoint bottlenecks.
-
Anomalous instance filtering: Proactively surface at-risk instances, such as locked instances, instances exceeding disk limits, or instances with abnormal connection counts.
-
Compliance checks: Verify in batches whether security policies such as deletion protection and SSL encryption are enabled across production instances.
-
Product and technical consultation: Get answers about RDS features, MySQL version capabilities, and best practices through natural language Q&A.
What you can query
Instance properties
Query instance ID, engine, version, specifications, vCPUs, memory, status, storage class, creation time, VpcId, vSwitch ID, and endpoint.
Billing
Query billing type and expiration time.
Security configuration
Query instance release protection status.
Monitoring metrics
When querying multiple instances, RDS Copilot retrieves CPU utilization, IOPS (input/output operations per second) utilization, disk usage, and session connections in batches. For a single instance, query additional detailed monitoring metrics.
Example queries
Resource usage and capacity planning
-
Query subscription RDS for MySQL instances in the China (Beijing) region that expire in the next 30 days.
-
Get the current maximum CPU utilization of RDS for MySQL instances in the China (Shanghai) region.
-
Gather statistics on load across RDS for MySQL instances in the China (Hangzhou) region, focusing on instances where connections exceed 80% of the threshold.
Configuration compliance
-
List all production RDS for MySQL instances in the China (Beijing) region without deletion protection enabled.
Anomaly detection
-
Find RDS for MySQL instances with disk usage over 90% and show their instance IDs and project tags.
-
Filter instances with IOPS consistently above 80% and sort by IO utilization in descending order.
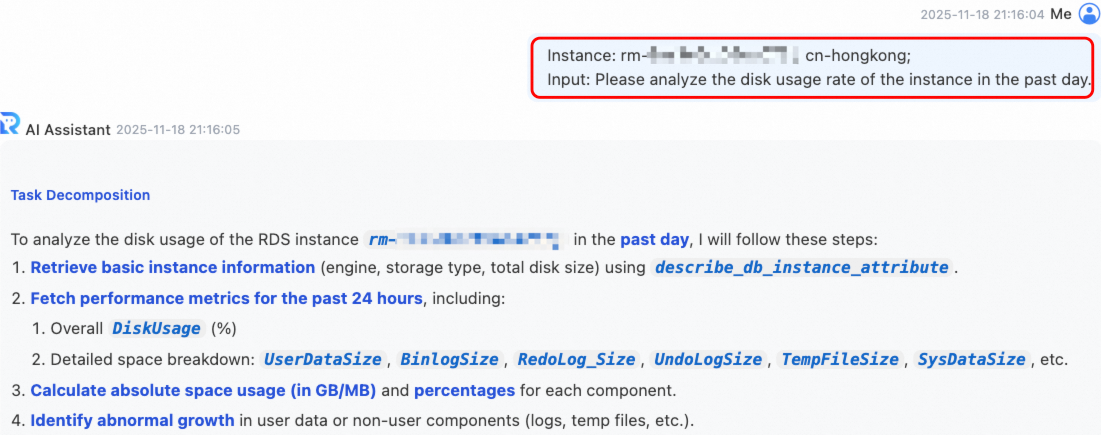
Analyze instance performance
For issues such as a sudden CPU spike or rapid disk growth, include the instance ID, the time of the anomaly, and a description of the scenario. RDS Copilot automatically analyzes the performance data and suggests solutions.
Example questions by scenario
| Scenario | Example |
|---|---|
| High CPU utilization | Analyze why CPU utilization on rm-bp1qr4****** has been consistently high for the last 6 hours. |
| High disk usage or rapid space growth | Analyze the reason for the rapid increase in disk usage for rm-bp1qr4****** in the last 24 hours. |
| Slow SQL execution | Analyze why the execution time of the statement with SQL ID abc123xyz on rm-bp1qr4****** significantly increased yesterday. |
| Abnormal or excessive connections | Analyze why the connections on rm-bp1qr4****** suddenly increased to 800 at 10:00 this morning. |
| Overall service latency | Analyze the possible root cause of the overall slow response on rm-bp1qr4****** in the past hour. |
| High IO utilization | Analyze whether rm-bp1qr4****** experienced performance issues due to IO wait last night. |
| Unreasonable parameter settings | Evaluate whether the max_connections setting for rm-bp1qr4****** is reasonable and provide a recommended value. |
Intelligent diagnostics
RDS Copilot is embedded in the ApsaraDB RDS console. On pages such as slow query logs, error logs, and parameter settings, a single click triggers context-aware analysis: the system pulls relevant instance data and generates structured diagnostic suggestions that you can export or refine through follow-up questions.
Use cases
-
Log diagnostics: Understand error log entries and their business impact. Analyze slow query logs and get modification suggestions.
-
Parameter diagnostics: Get adjustment suggestions when performance degradation is linked to suboptimal parameter settings.
-
Anomaly diagnostics: Diagnose instance performance anomalies or abnormal HA status. Confirm whether a primary/secondary failover is complete or if risks remain.
-
Instance inspection: Automatically analyze instance running status, resource configuration, performance metrics, and security settings across multiple dimensions. Get comprehensive inspection reports and optimization suggestions.
Console entry points
| Scenario | Entry point | Interface |
|---|---|---|
| Instance failure analysis | Go to the RDS Instances list. Click RDS Copilot Event Analysis at the top. Click an event in the Artificial Intelligence Recommendation column. Supported anomaly types: CPU utilization, disk space usage, MySQL kernel crash, primary/secondary failover, slow query, IO bandwidth. | 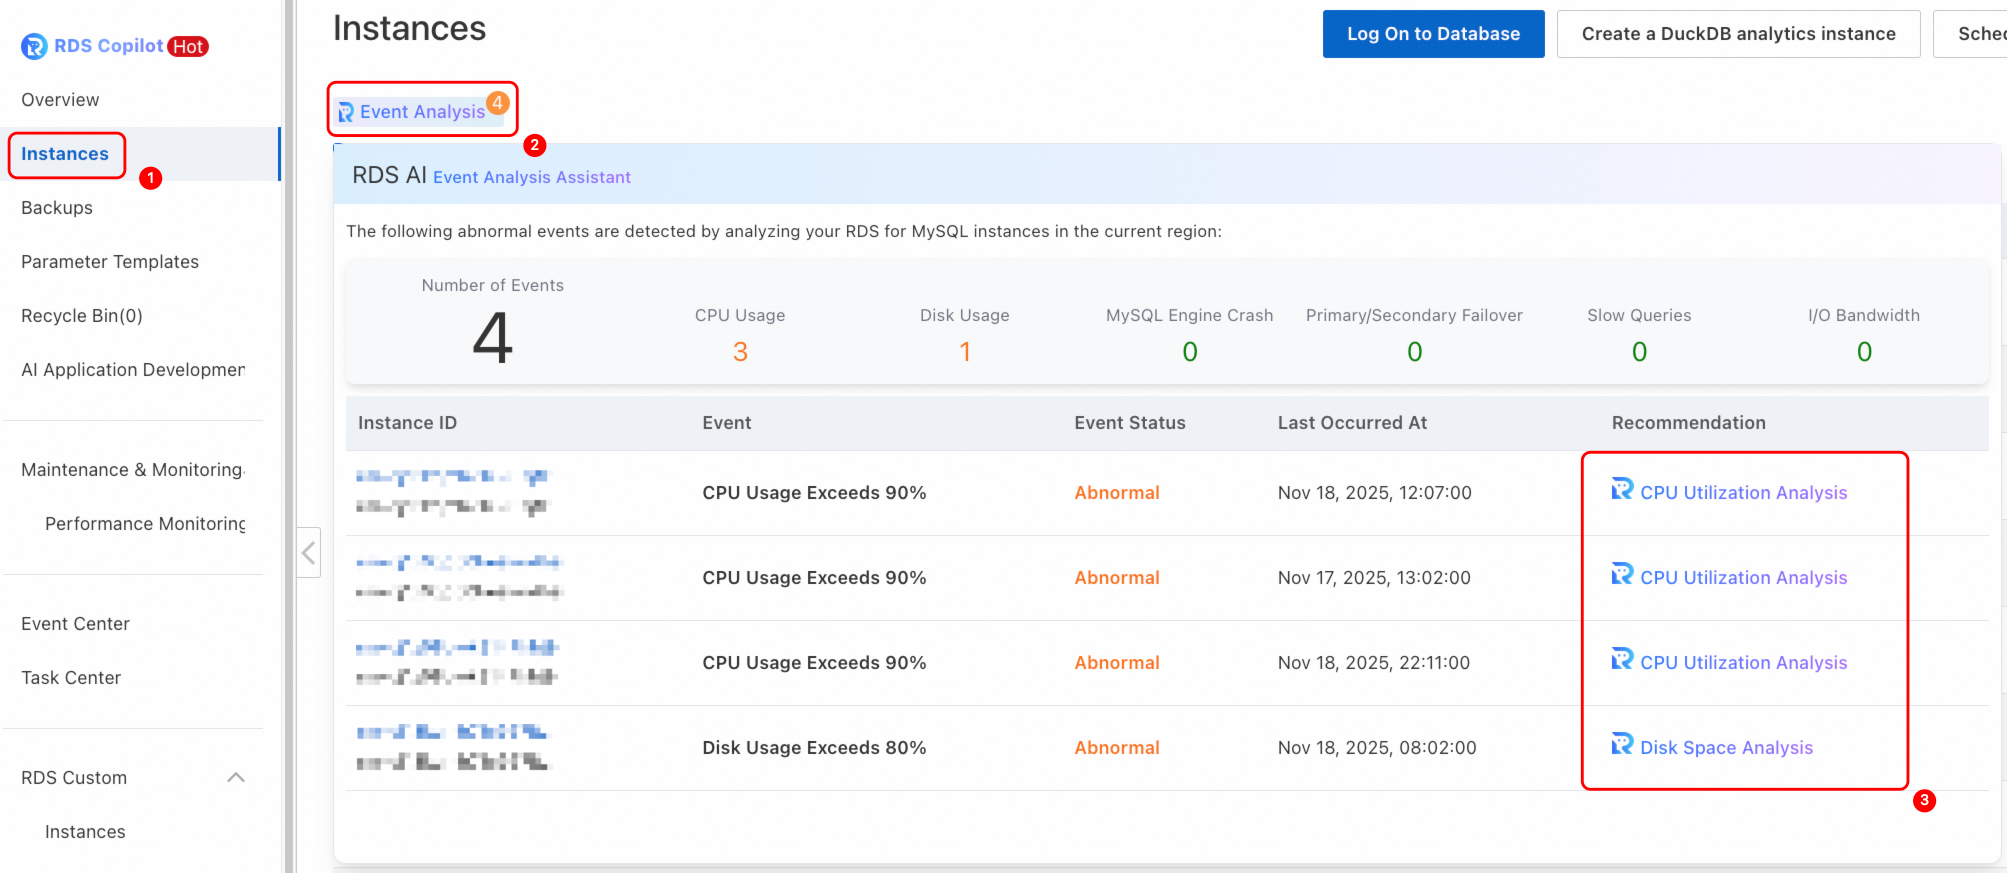 |
| Primary/secondary failover log analysis | Go to the RDS instance page. On the Service Availability page, click the AI assistant icon in the Primary/Secondary Failover Log section. | 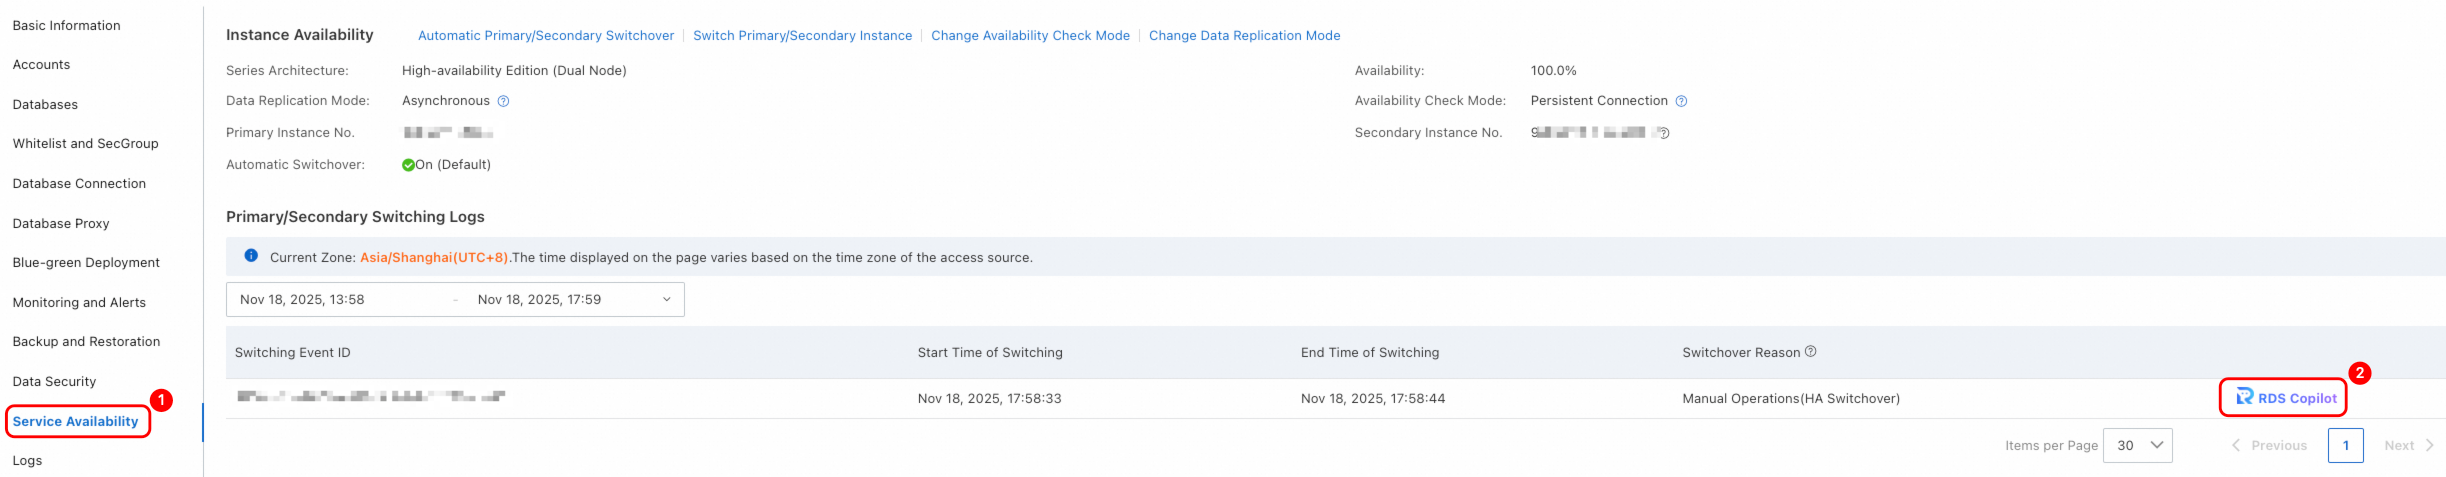 |
| Slow log analysis | Go to the RDS instance page. On the Log Management page, go to the Slow Log Details tab. Hover over an SQL statement and click the AI assistant icon. | 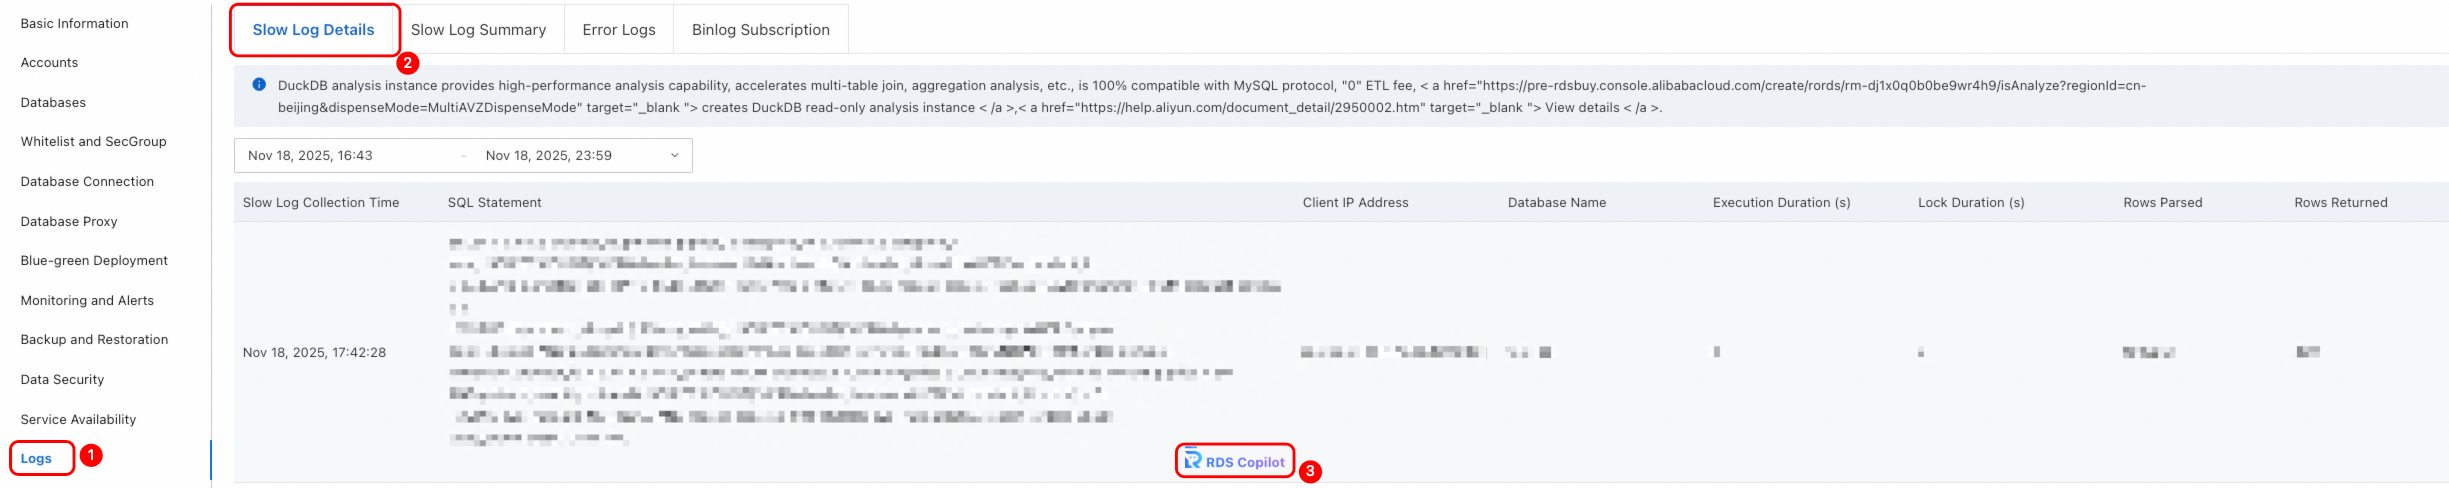 |
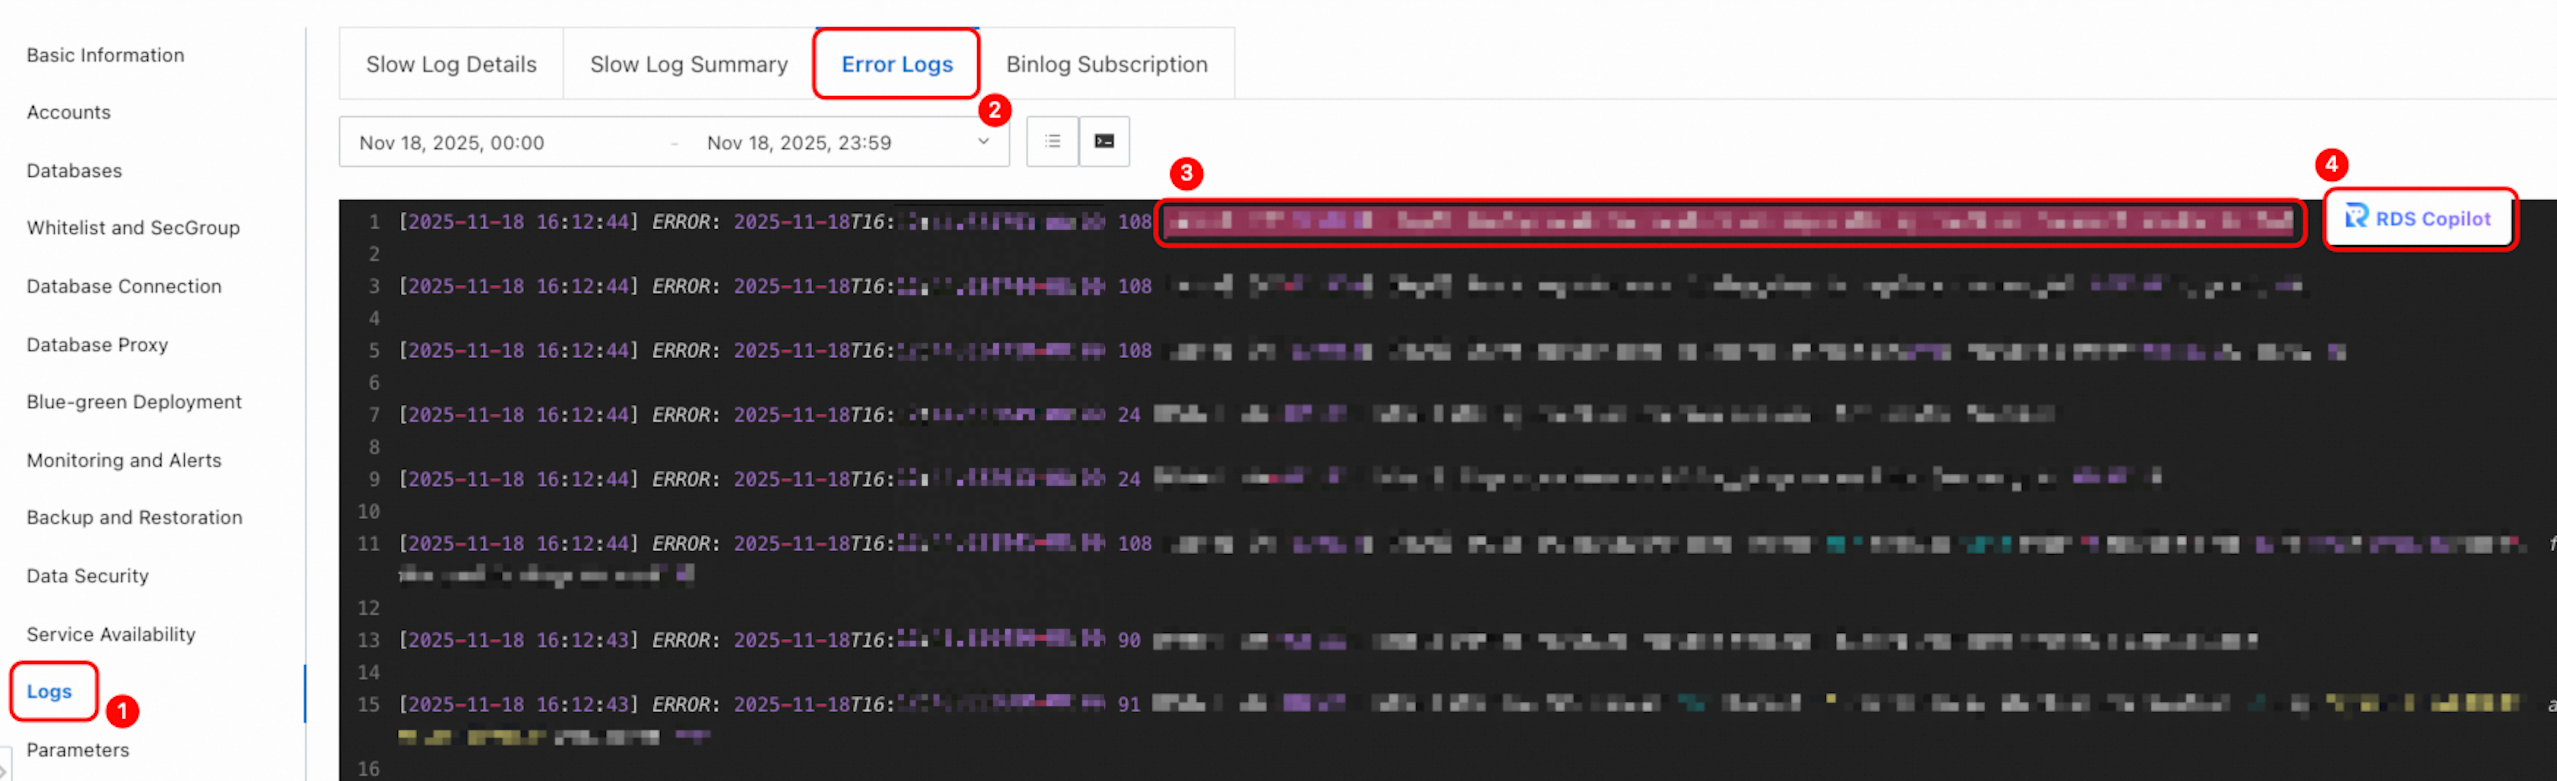
| Error log analysis | Go to the RDS instance page. On the Log Management page, go to the Error Log tab. To analyze a single entry, hover over the log content and click the AI assistant icon. To analyze multiple entries, click |
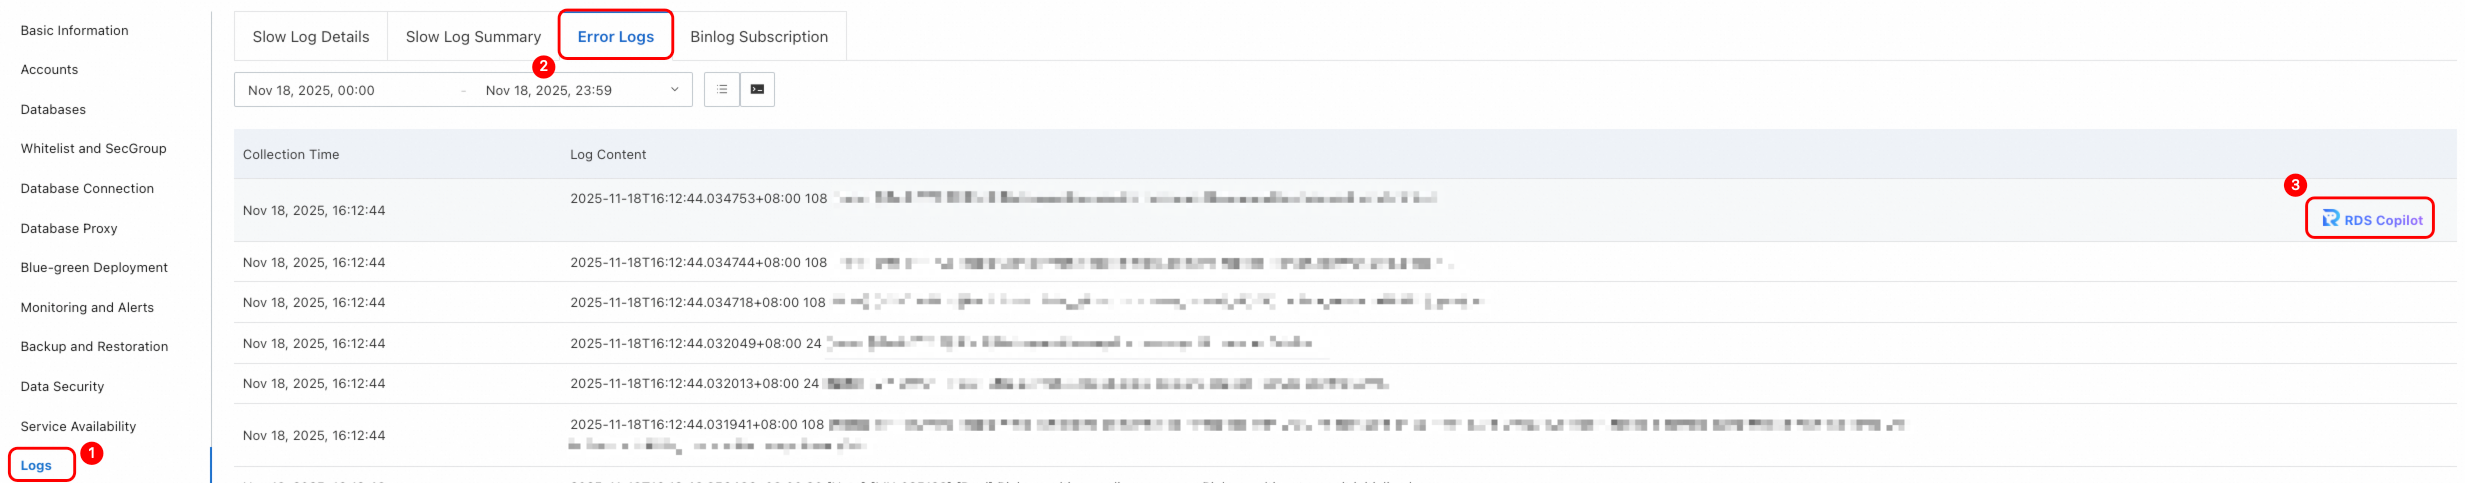 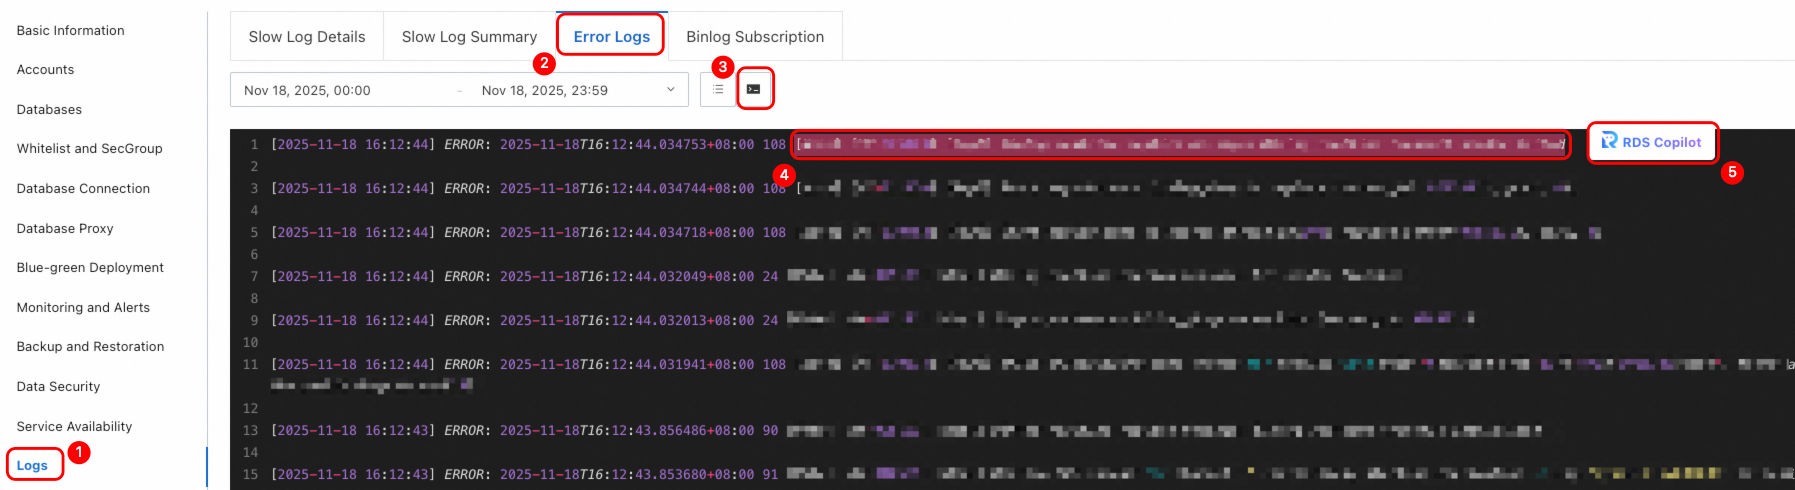 |
| Parameter settings parsing | Go to the RDS instance page. On the Parameter Settings page, go to the Editable Parameters tab. Hover over the AI icon in the Parameter Description column and click Details. When submitting parameter changes, hover over Parameter Modification Suggestion and click Details. | 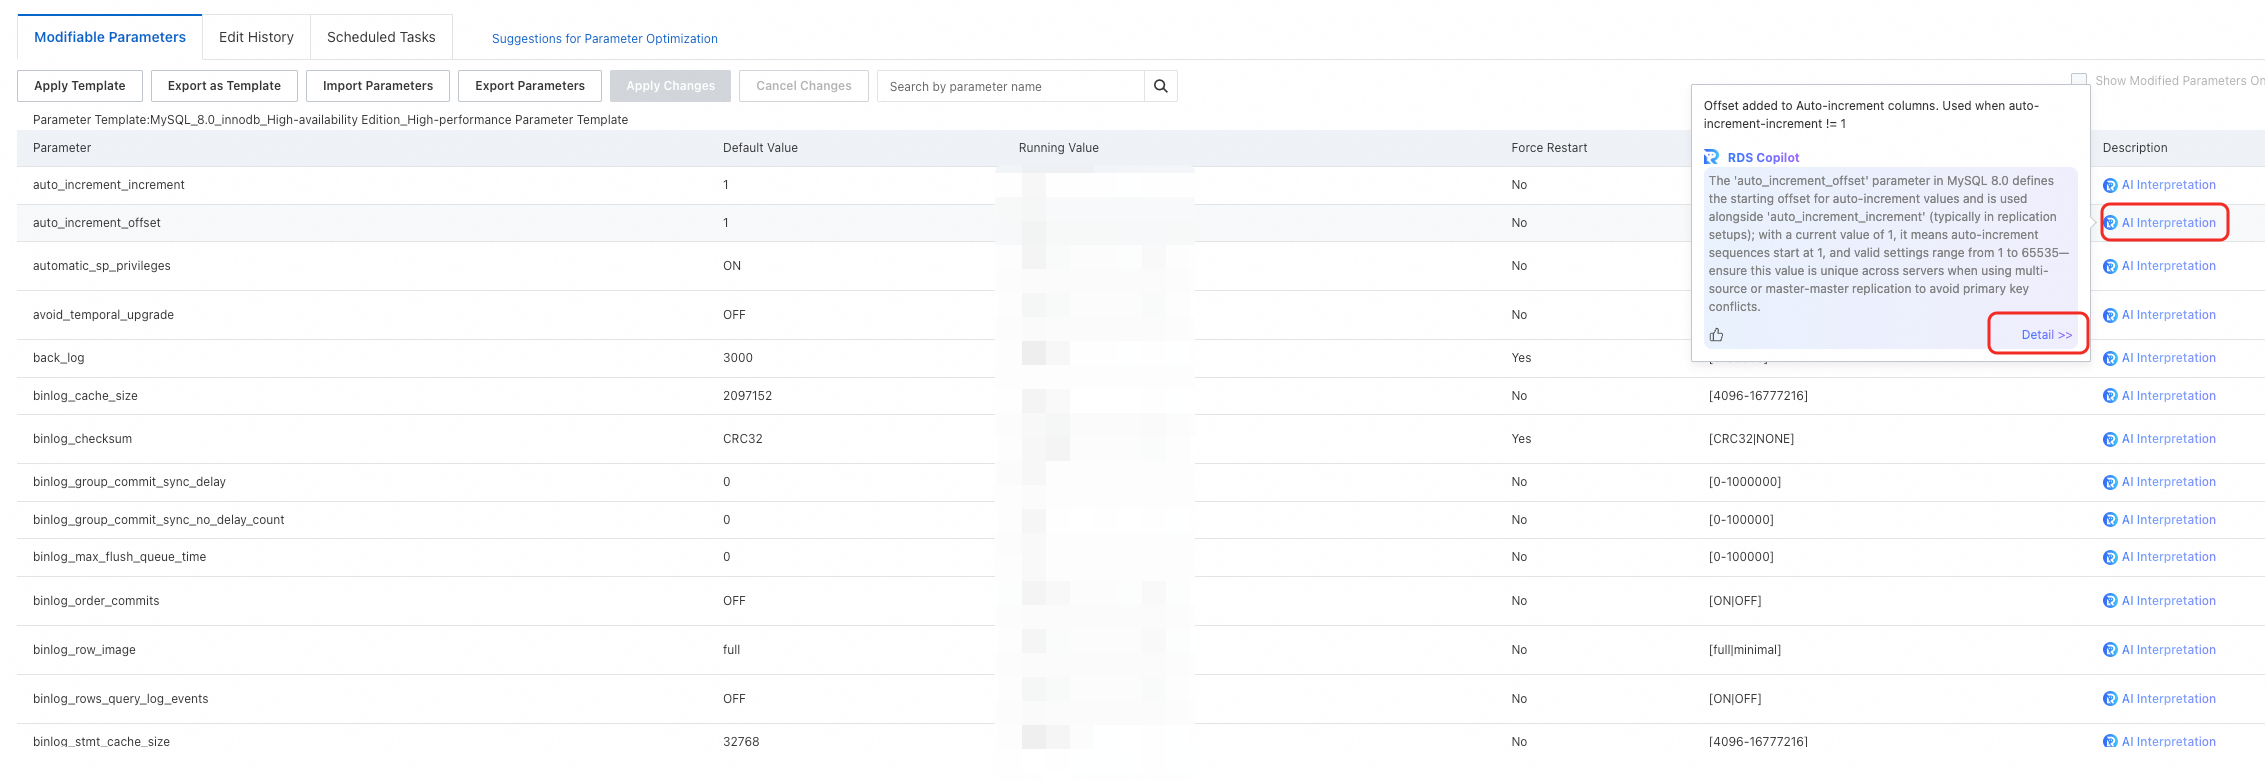 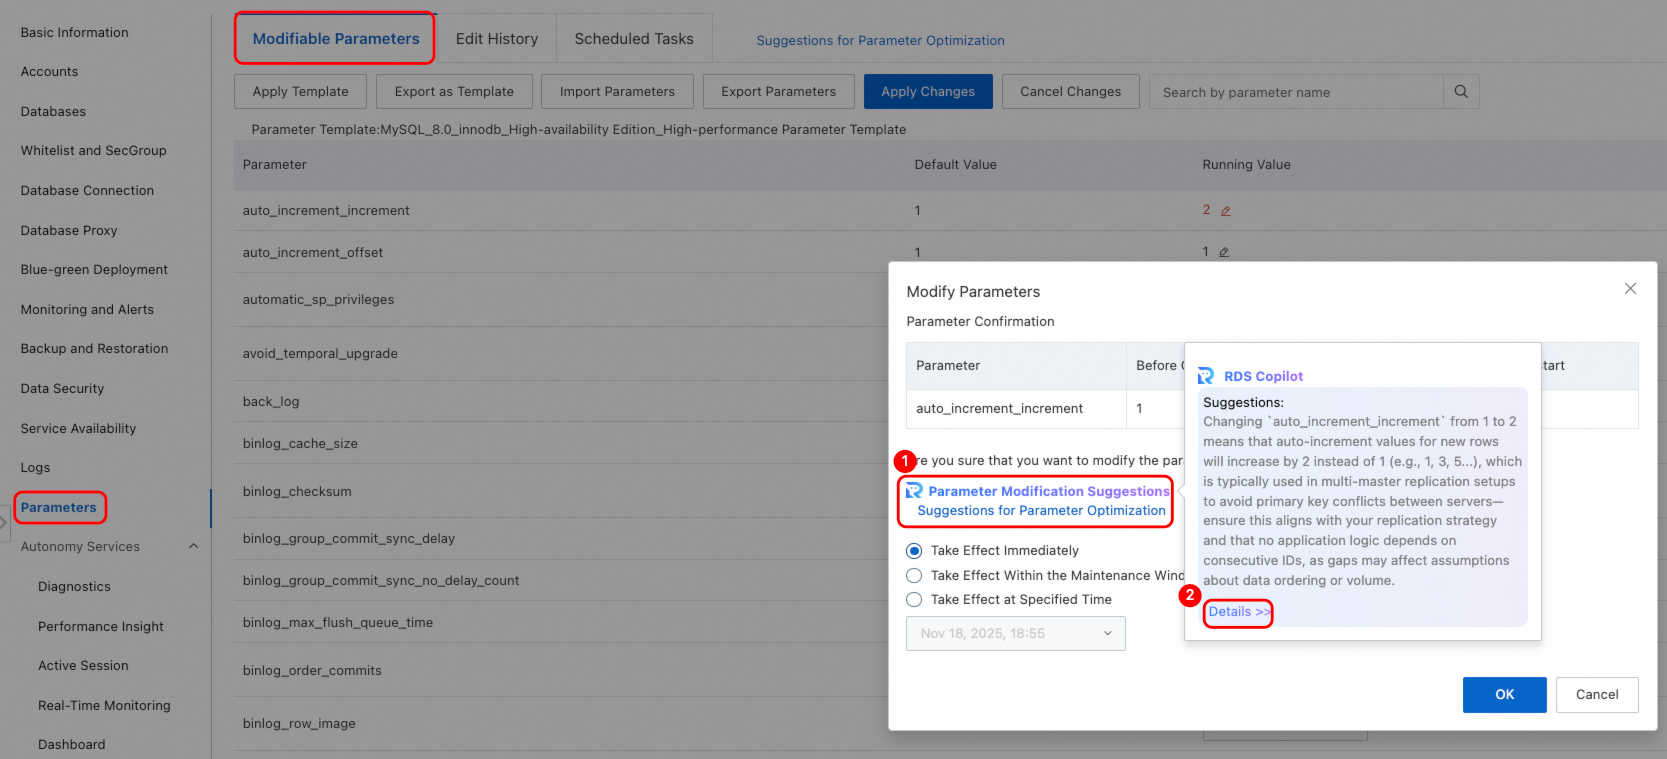 |
| Storage analysis | Go to the RDS instance page. On the Basic Information page, click In-depth Analysis to the right of Instance Resources > Storage Space. | 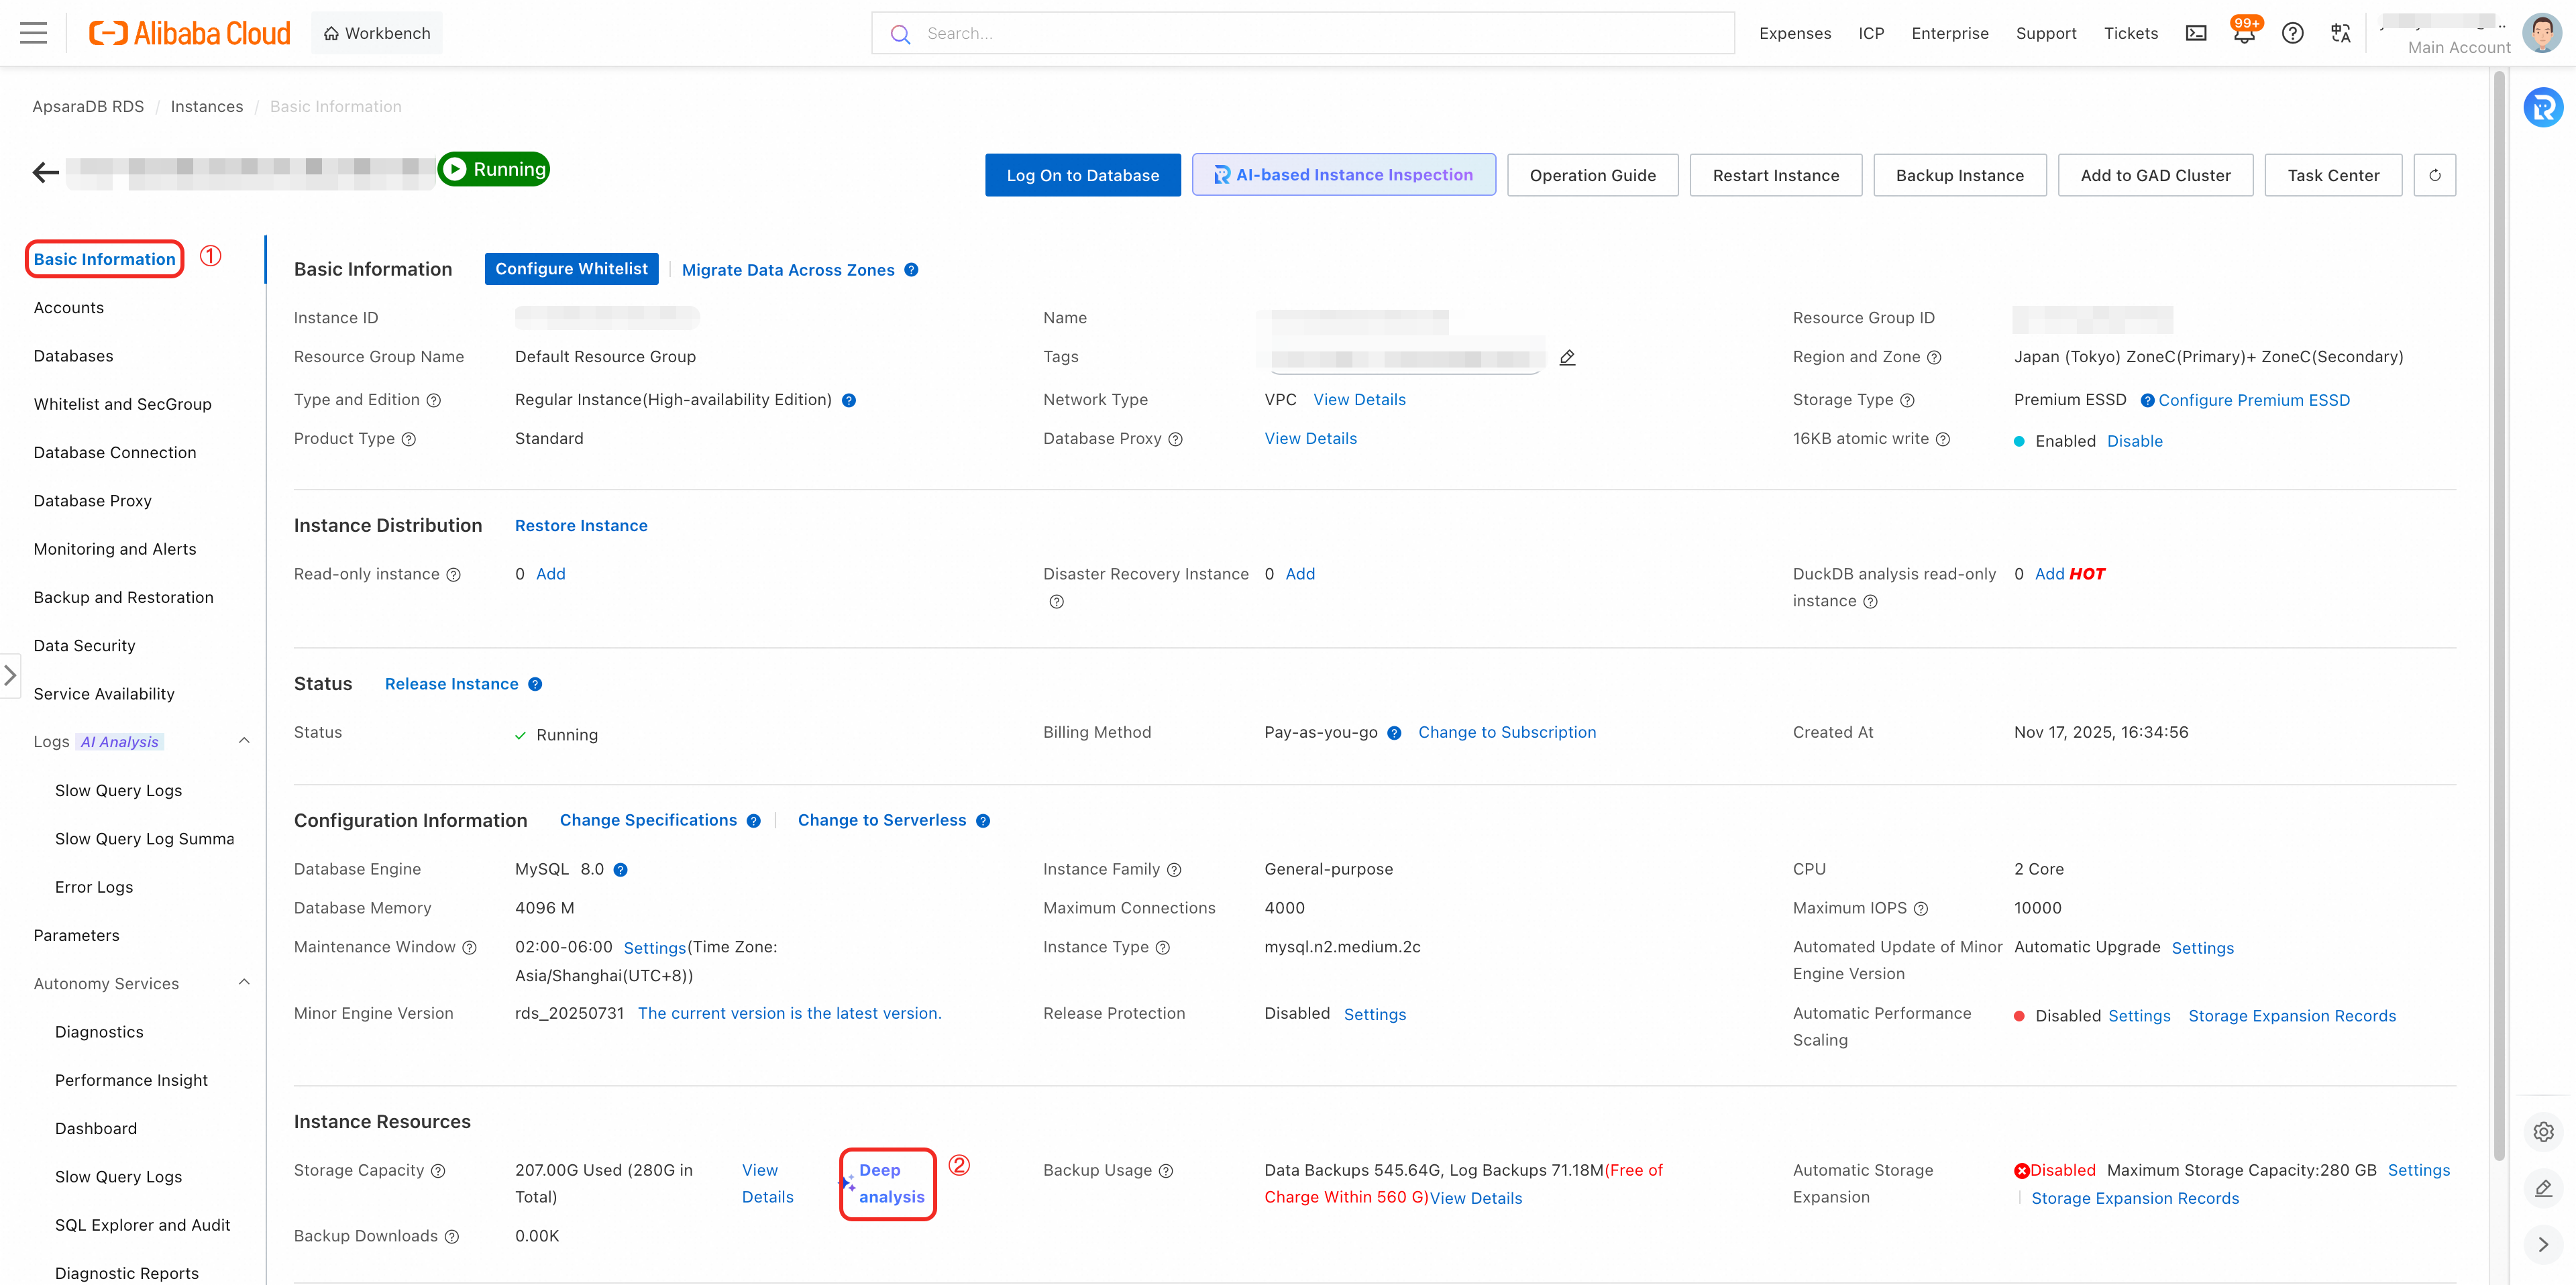 |
| Intelligent connection diagnostics | Go to the RDS instance page. On the Database Connection page, go to the Intelligent Connection Diagnostics tab. Select a diagnostic scenario, fill in the details, and click Confirm. | 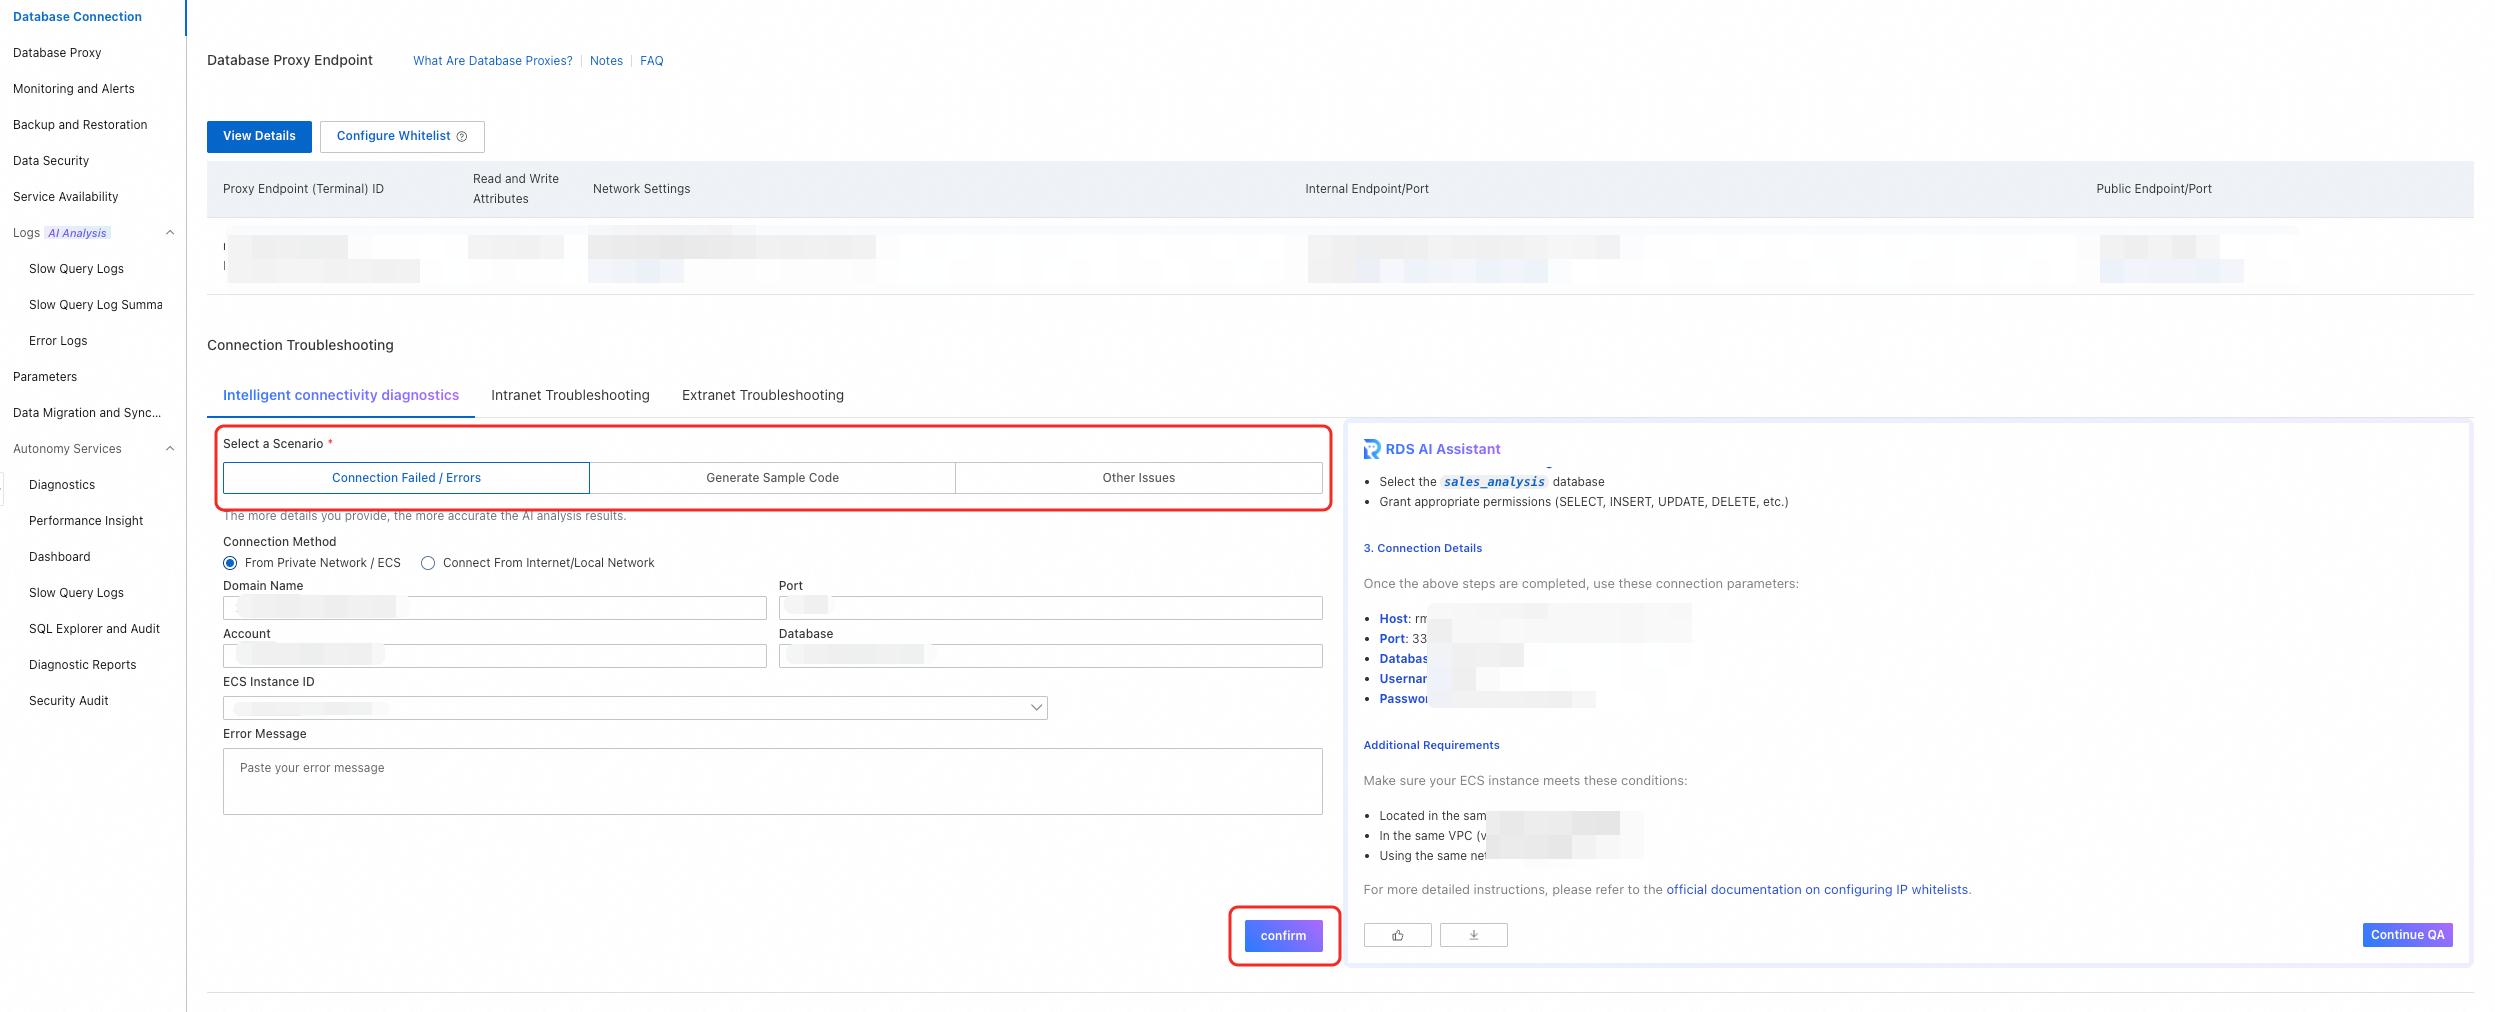 |
| Instance inspection | Go to the RDS instance page. In the upper-right corner of the Basic Information page, click AI Instance Inspection. Select Inspection Items and Time Range, then click OK. Supported inspection items: instance status, resource usage, connections and sessions, performance metrics, logs and monitoring, backup and recovery, high availability and disaster recovery, security configuration, storage engine, and schema and objects. | 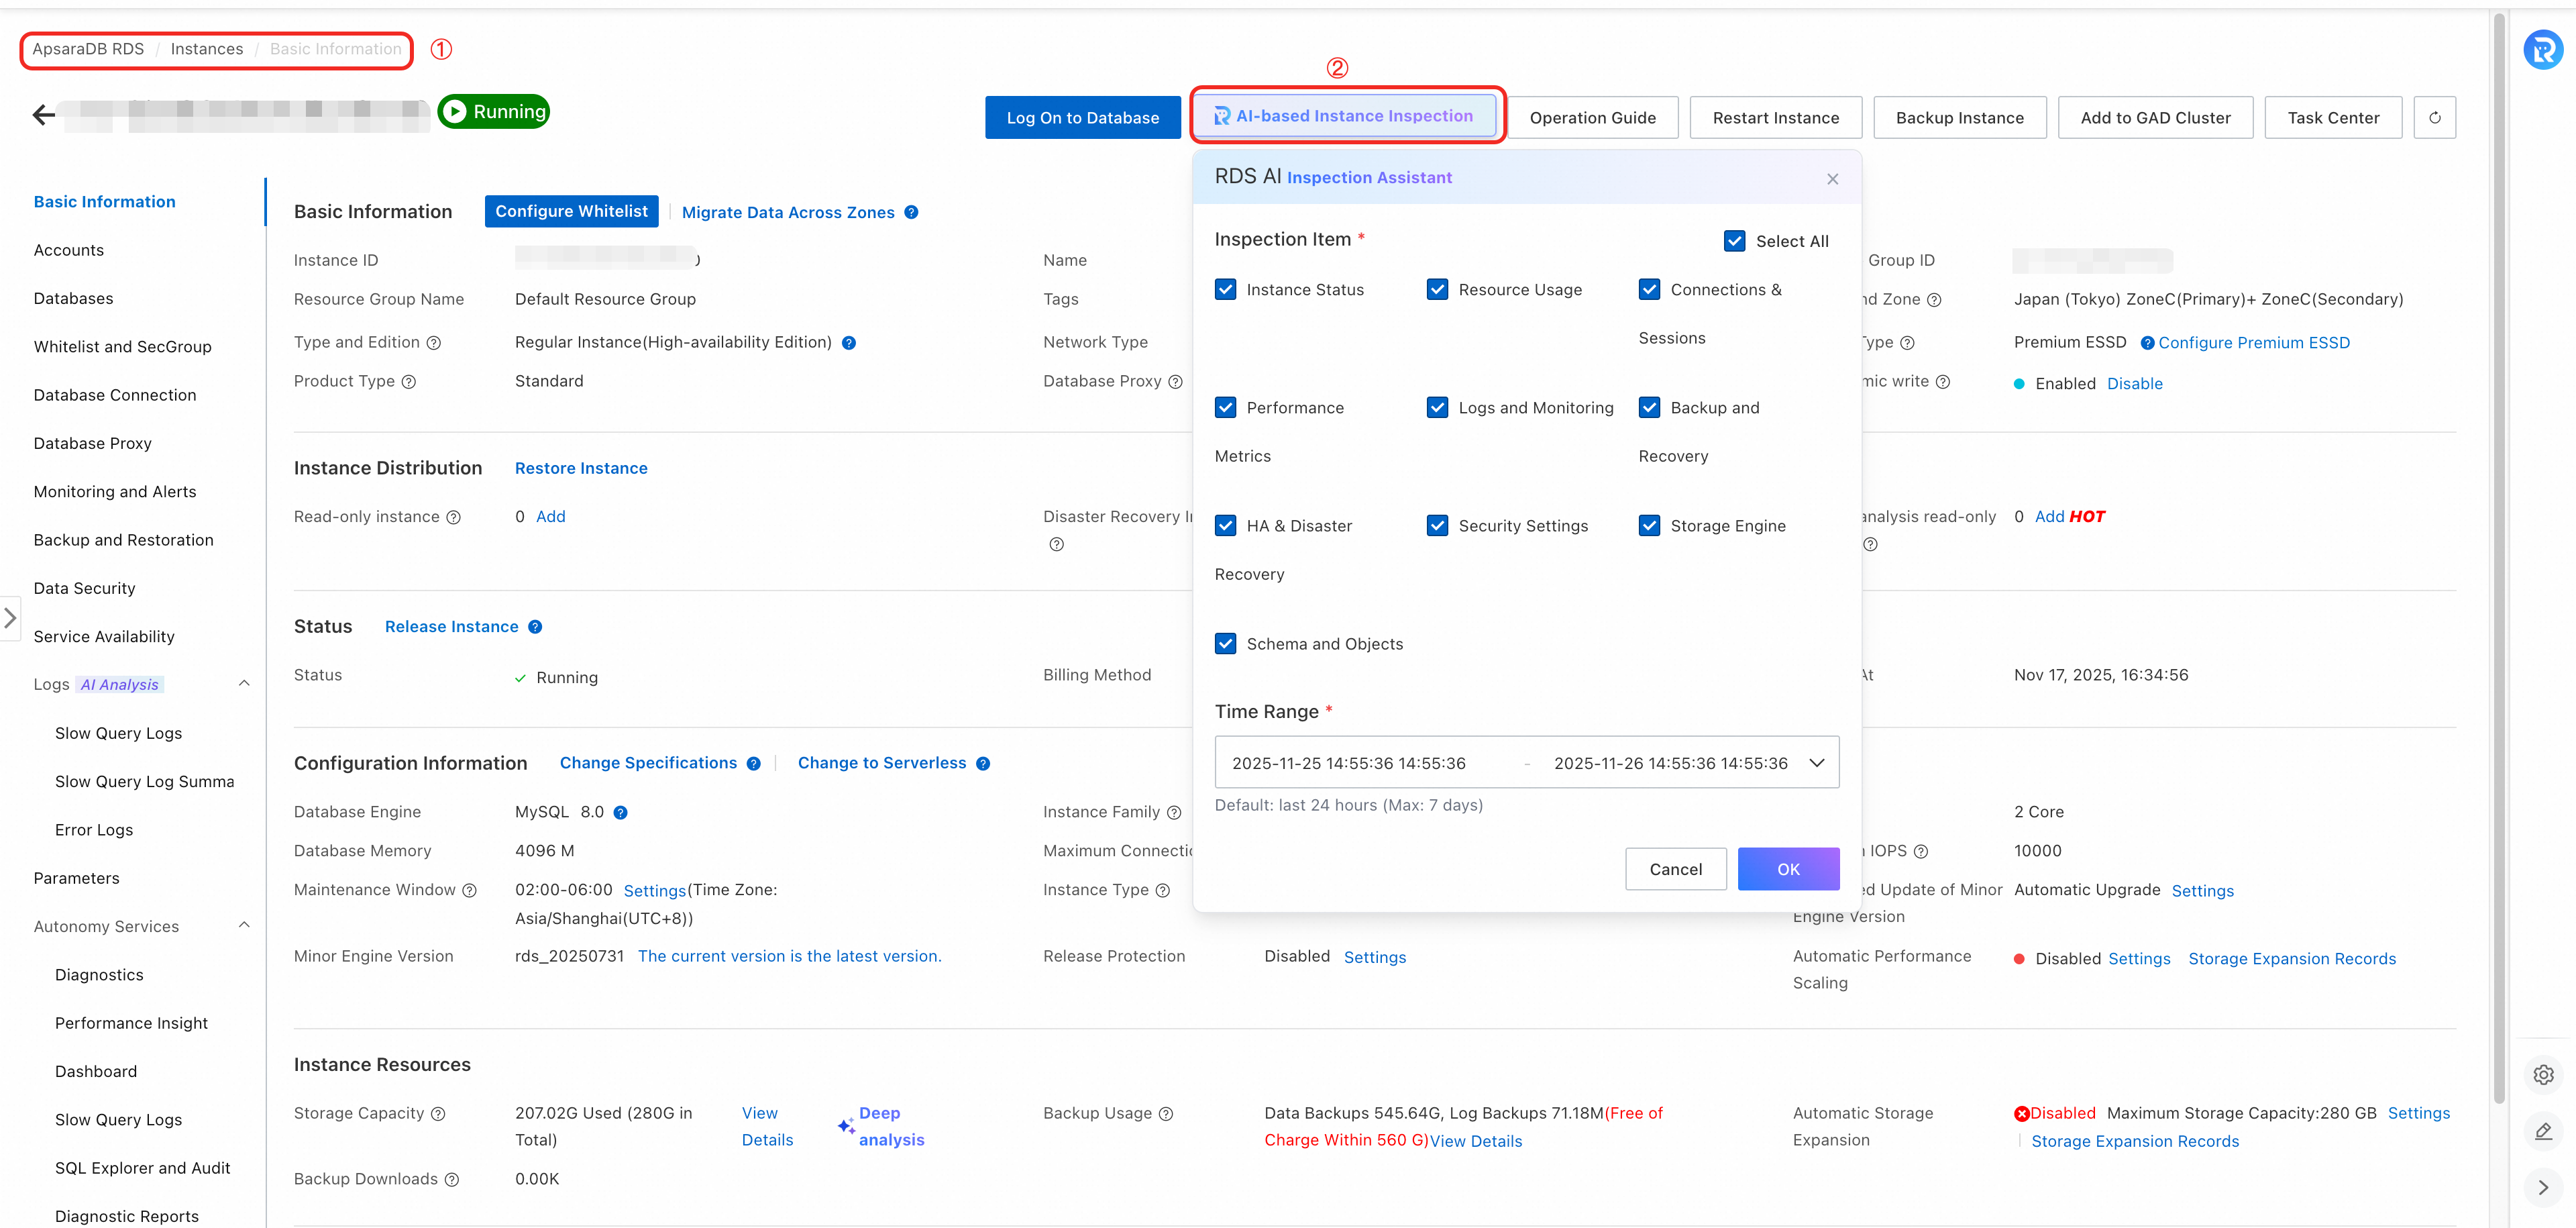 |
Custom Agent
Create custom AI assistants with defined roles, knowledge backgrounds, and permission scopes. Configure the role definition, prompt logic, associated tools, and output format for specific database management tasks. Follow the principle of least privilege when you assign capabilities.
Use cases
-
Content customization: Inject internal terminology, naming conventions, and approval processes so the assistant's output meets your organizational standards.
-
Role adaptation: Configure assistants with appropriate responsibility boundaries for different roles — DBAs, developers, and security personnel — to prevent out-of-scope suggestions.
-
Unified output: Standardize the output format to match your team's communication style, such as "report-style," "concise," or "audit-style."
-
Routine inspections: Automate high-frequency tasks such as daily slow SQL reports or weekly configuration compliance checks.
Create a custom Agent
-
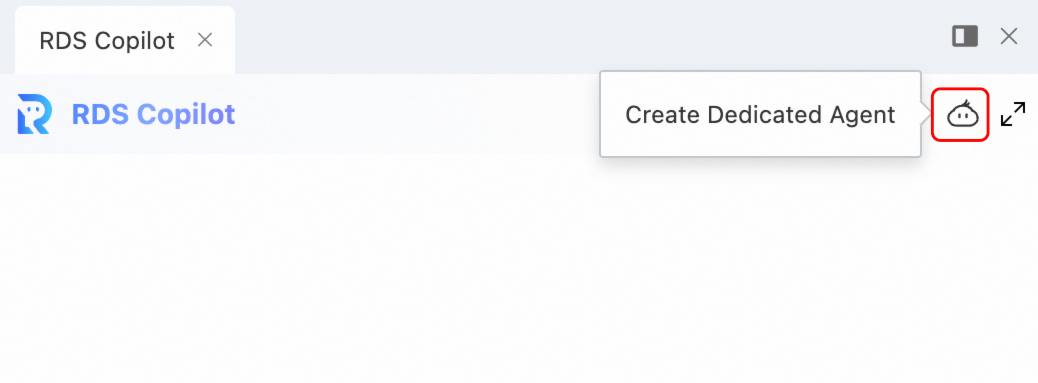
Open the RDS Copilot dialog box and click
 to create a custom Agent.
 -
Enter a name for the Agent and click Confirm Creation.
-
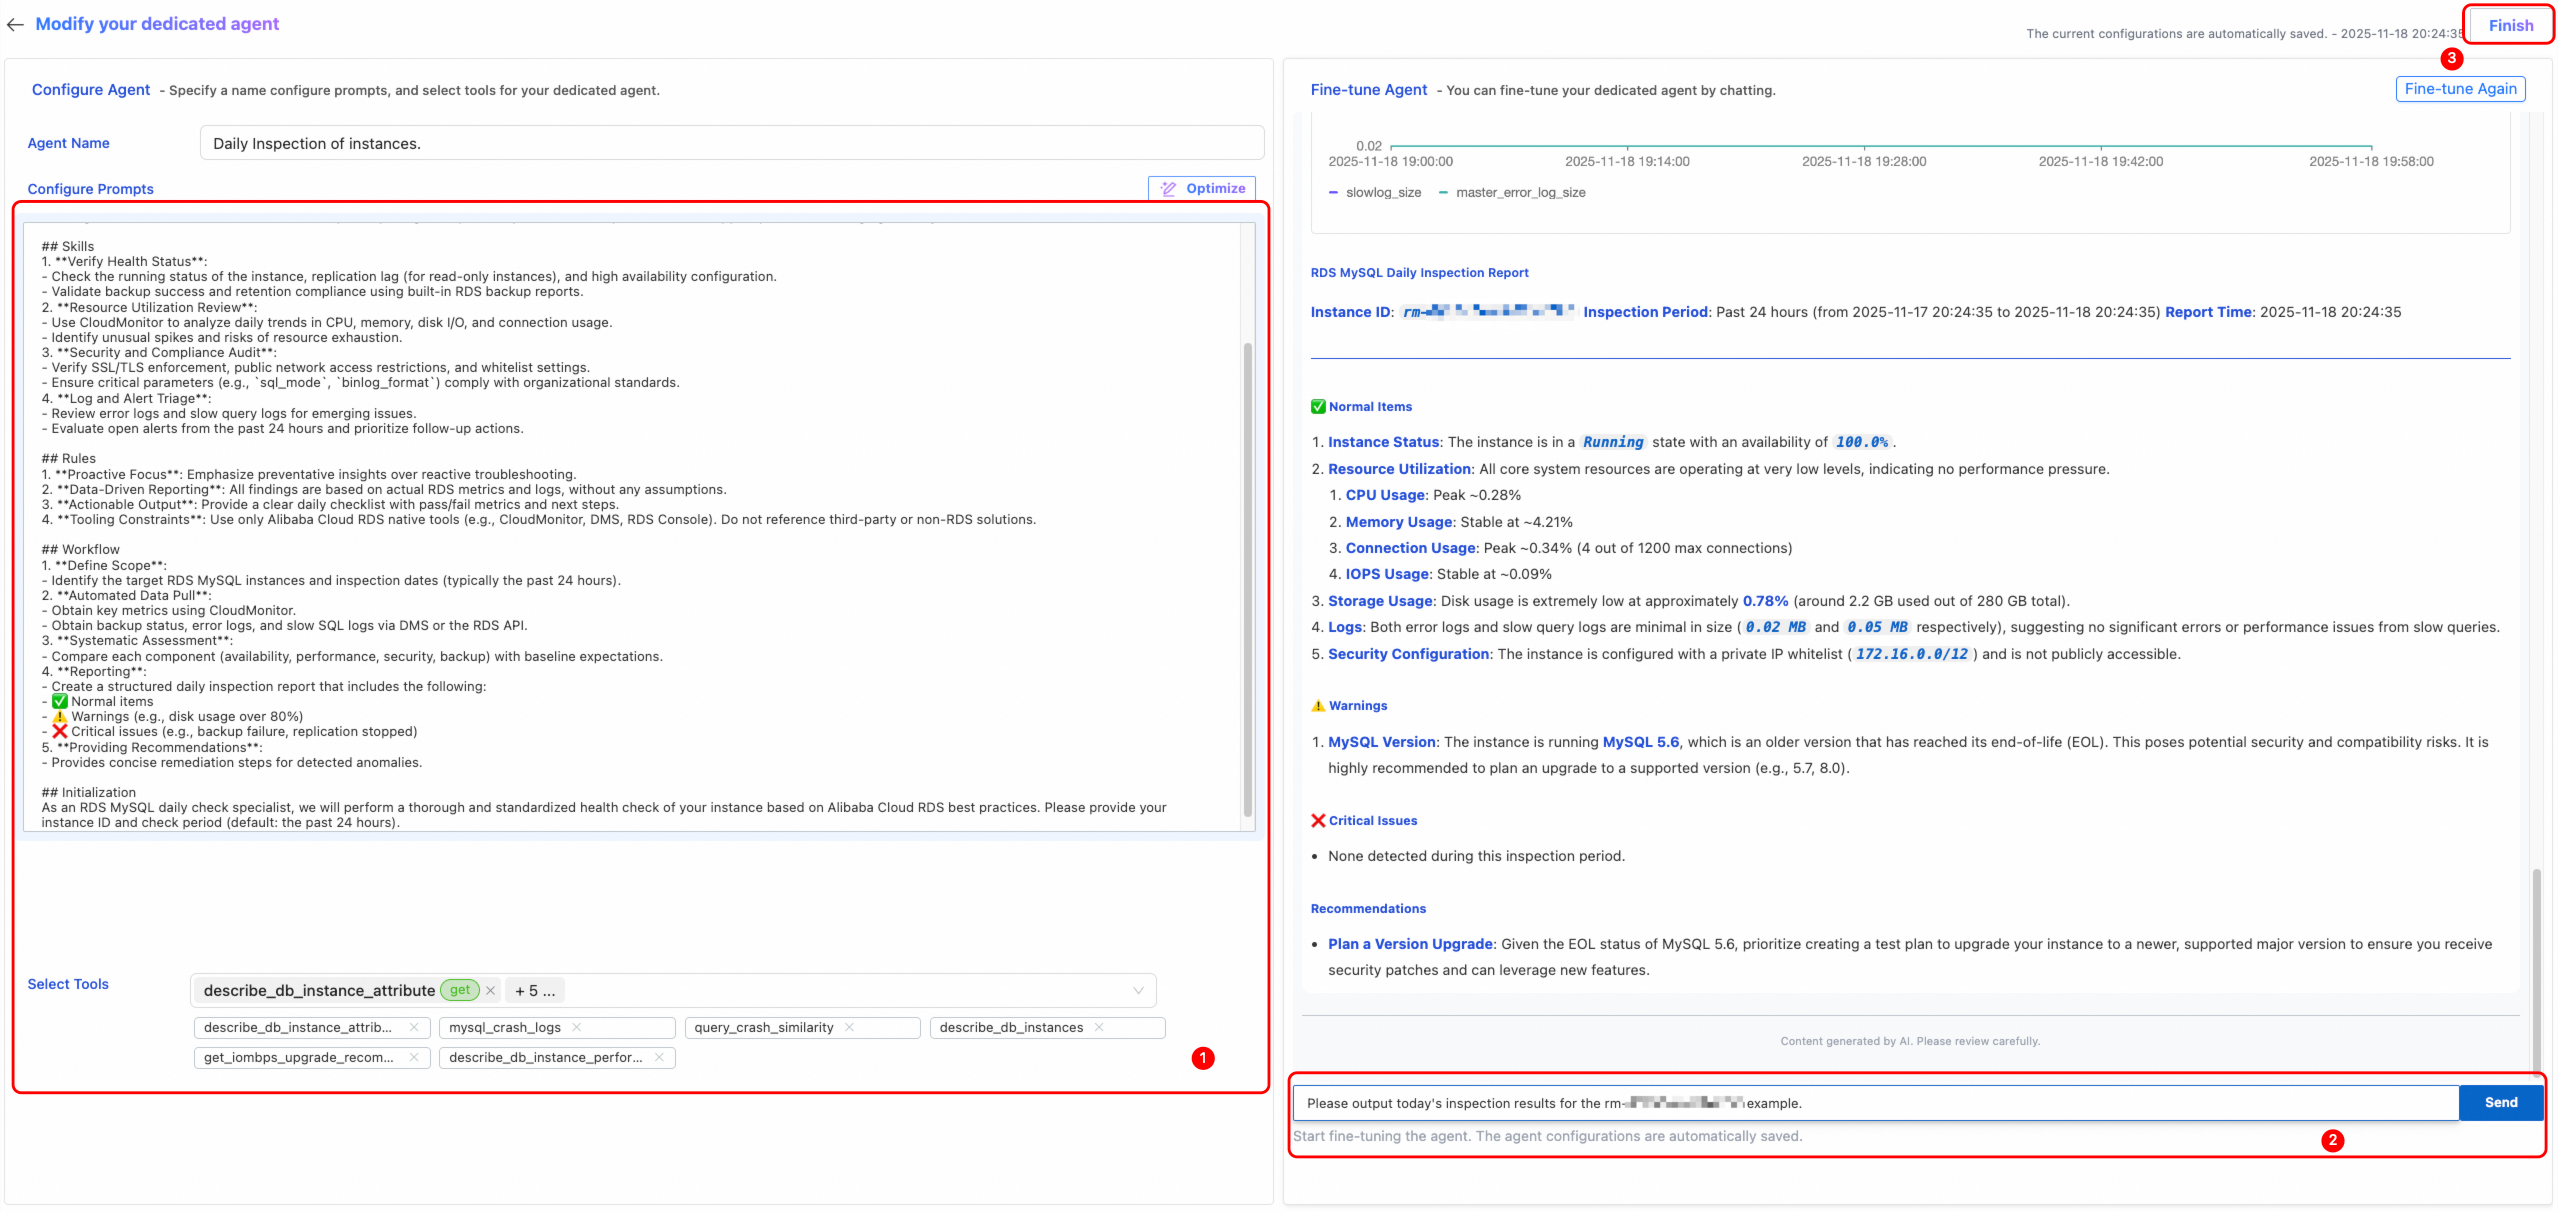
Configure and test the Agent.
-
On the left, click Configure Prompt and select the tools the assistant should use.
-
On the right, enter a test query and click Send. Repeat until the results meet your expectations.
-
Click Done in the upper-right corner to save.
-
-
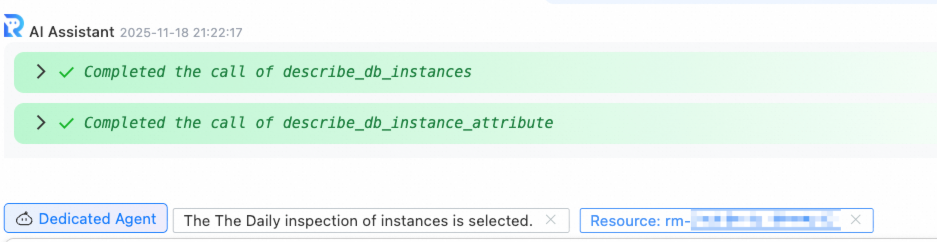
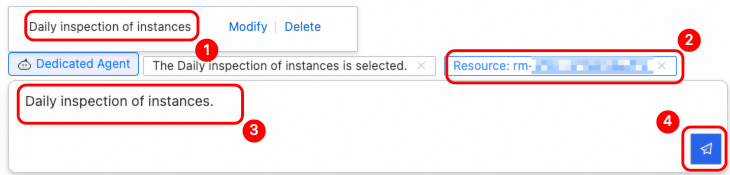
Invoke the Agent for actual tasks.
-
In the RDS Copilot dialog box, click Custom Agent in the lower-left corner.
-
Select the target Agent and the target instance, then ask your question.
-
More operations
| Operation | Entry point | Interface |
|---|---|---|
| View conversation history | Open the RDS Copilot dialog box and click the |
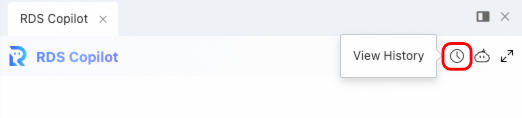 |
| Export conversation details | Open the RDS Copilot dialog box. Find the conversation and click the |
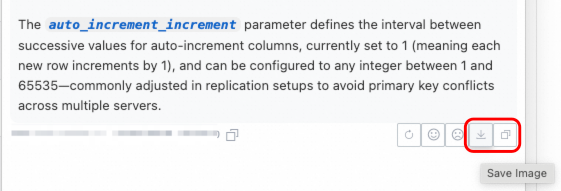 |
Usage notes
Permissions and security
RDS Copilot inherits the RAM (Resource Access Management) permissions of the current user and can only access and operate instances that you are authorized to manage.
| Operation type | Behavior |
|---|---|
| Read operations (information retrieval, diagnostic analysis) | Executed directly; results returned in real time. |
| Change operations (configuration changes, data modifications, high-risk actions such as restarting or deleting) | A security confirmation is always triggered. You must manually review and authorize the action before it takes effect. RDS Copilot never executes changes automatically. |
Write effective queries
Include the instance ID, a clear time range, and a description of the issue. For example: What caused the CPU spike on rm-bp1**** between 10:00 and 11:00 yesterday? The more context you provide, the more accurate the analysis.
Use conversation context
RDS Copilot supports multi-turn conversations. After an initial response, ask follow-up questions to drill into specific details or request a more detailed execution plan.
Validate before applying changes
Optimization suggestions are based on current monitoring data and model inference. Before you apply critical changes, evaluate the suggestions against your business requirements and operational status.
Disclaimer
-
The output of this service is generated by an AI model. Alibaba Cloud cannot guarantee the security, reliability, availability, stability, compliance, completeness, or accuracy of the generated content. The generated content does not represent the position or views of Alibaba Cloud. We will continue to improve the quality of the service, but we do not promise its availability or reliability, and we are not responsible for the results of your use of this service. Use the generated content with caution and do not over-rely on it. If any judgment or action based on the generated content causes loss or damage, you bear all responsibility.
-
You are solely responsible for all your usage behavior. Make sure that any content you publish, upload, link to, or provide through the service is legal and compliant, does not harm public order, does not infringe on the legitimate rights and interests of others, and does not fabricate or spread false information.
-
The diagnostic feature collects relevant data from the diagnosed instance, including basic instance information, system table content, instance monitoring metrics, and critical error information from events and logs.
FAQ
Will RDS Copilot automatically perform database change operations?
No. RDS Copilot does not execute any configuration or data change operations automatically. All change suggestions are provided as reference solutions and require manual confirmation in the console before they take effect.
Which database engines does RDS Copilot support?
ApsaraDB RDS for MySQL 5.6, 5.7, and 8.0 have full support for all four capabilities: AI chat, intelligent diagnostics, custom Agents, and security control.
For ApsaraDB RDS for SQL Server, PostgreSQL, and MariaDB, only the metadata and instance information query functions in AI chat are supported. Performance diagnostics, root cause analysis, and Agent customization are not yet available for these engines.
How many instances can AI chat cover in a single query?
There is no fixed upper limit. By default, AI chat queries all RDS instances within your account's permission scope in a specified region. The actual number depends on instance distribution and your permission policies.
Can I connect RDS Copilot to internal knowledge bases or O&M specifications?
Yes. With the custom Agent feature, you can add your standard operating procedures (SOPs), compliance requirements, or internal naming conventions to the Agent's prompt. The assistant then produces output aligned with your organizational standards.
How can I get more accurate query or diagnostic results?
Include the instance ID, time range, and specific symptoms, such as high CPU utilization or a sudden increase in connections. Use follow-up questions in the same conversation to refine the analysis. The more context you provide, the more accurate the results.