Event analysis
This topic describes the scenarios and usage of the event analysis feature.
Document description: This document is an introduction to Quick Tracking and technical integration and is not used as a sales basis. For specific products and technical services purchased by an enterprise, the commercial purchase contract shall prevail.
Overview
An event is a description of a user's behavior in the process of using a product provided by an enterprise, such as clicking to register, adding to a shopping cart, playing music, and so on.
Event analysis is a statistical analysis of event-based metrics and drill-down analysis based on grouping and filtering conditions. It can help enterprises understand the user usage of products and further explore the main factors that affect the change of metrics. After a query is performed through event analysis, it can be saved as a report and added to a self-made dashboard for display and statistics.
Event: describes the interaction behavior of the user during the use of the product, that is, when, where, and what kind of behavior the user performs, such as clicking to register, adding to the shopping cart, or playing music.
Metrics: Metrics are tools for describing or measuring goals, such as the number of new users.
Attributes: Attributes describe user behavior events in more detail. For example, the "Add to Shopping Cart" behavior includes device common attributes collected by default, such as the operating system and city, and may also include custom attributes such as product names.
Scenarios
Event analysis can solve
Analyze historical trends in core metrics, such as changes in new product registrations over the past month.
Drill-down analysis of core metrics, such as viewing the source of new users by channel.
Observe the core indicator performance of the target population, such as analyzing the "purchase" performance of users aged "20-30".
Take "counting the number of login users from different provinces in the last seven days" as an example:
Click the drop-down to select "application start (preset)" event
Click the drop-down list and select "account ID deduplication" as the statistical indicator.
Click "add group" and select the system attribute "province" as the group attribute
Click Start Analysis
View analysis results

Operating Instructions
Page Composition
The event analysis feature consists of the following components:
In the upper-right corner of the workspace, you can create and update event analysis and add it to the dashboard. In the More section, you can view and export the list of saved reports. Add health indicators for different event analysis
Information configuration area: the user can perform operations such as event, indicator, attribute setting, grouping and time selection.
In the Analysis Results section, you can view the visual charts and detailed data of the analysis results.
Function Operation
Select Event Metrics
Event metrics and custom metrics are supported.
Select event metrics:

Event metrics support selecting page and tracking events
After you select an event, you need to select the metrics related to the event that you want to query. Event metrics support preset metrics and property metrics. Preset metrics support "deduplication", "times", "per capita" calculation. Attribute metrics are classified into character metrics and numeric metrics. Character metrics support "deduplication" and numeric metrics support "deduplication", "cumulative value", "maximum value", "minimum value", "average value", "lower quartile", "median", and "upper quartile". For more information about the specific metric type, metric name, and metric meaning, see Appendix 1: Select an event metric.
Custom indicator: provides four operations of addition, subtraction, multiplication, division, parentheses, and constants for indicators.

The name and description of the custom metric. The name can be 15 characters in length, and can contain letters, digits, underscores, and calculated symbols (+-*/).
In the input box, enter the metric formula to be used for calculation, such as A + B and A- B. The calculation formula supports constant, +-*/and ().
You can choose to display the result as a percentage, an integer, or two decimal places. (Percentage by default).
The simple metrics that are used for compound calculation. You can specify up to three simple metrics in four operations. You can set filter conditions for each simple metric.
Add Filter Condition
Supports filtering by system attributes, global attributes, event attributes, channel attributes, and user attributes. For more information, see Add filter conditions.
2. Different filtering symbols are supported according to different types of attributes. For more information about the specific filter symbols and symbol definitions, see Add Filter Condition.
3. The attribution is calculated when filtering with or without a value. For more information, see Add filter conditions.
4. Enter attribute values to filter.
5. Multiple attribute filter conditions are supported and the combination of or is supported for attribute grouping and analysis.
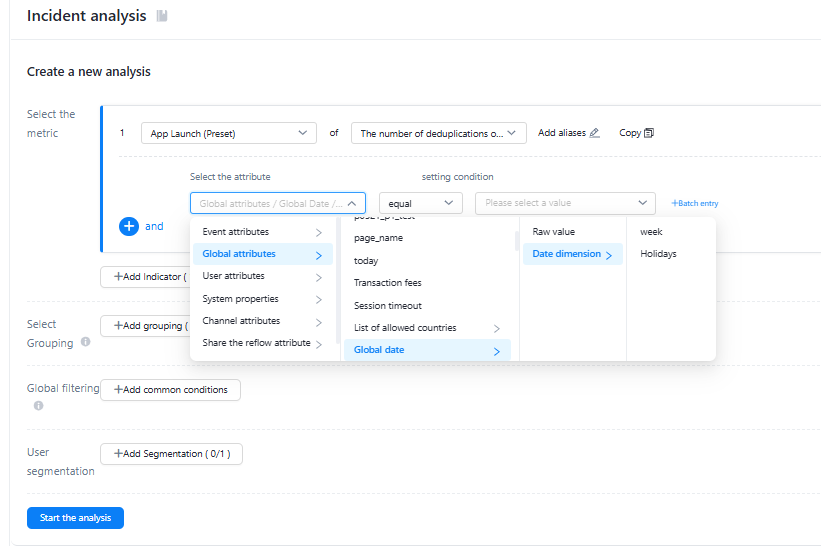
6. Attribute values support dimension filtering, such as date dimension: holidays, week.
Import Attribute Values
1. Effective filtering conditions: conditional filtering under metrics and global filtering
2. Click the Batch Import button. The Batch Enter Attribute Values pop-up window appears.
Delimiter: a comma and a line feed (carriage return). You can select two types of characters at the same time. The OR relationship takes effect.
If you want to import data in batches, the input box contains attribute values. After batch upload and save, it is modified to "overwrite modification"
Select an attribute group
You can add groups of metrics to analyze the performance of events in different dimensions. For example, you can add a channel group to view the new activations brought by different channels and the daily activity of launches in different cities. You can also analyze with two attributes.
Add a global filter
If you select two or more event metrics, global filtering supports common filtering based on common attributes between different events. The specific filtering capability and the attribute filtering capability of the same single event are set.
Add user groups
You need to look at the data of a specific group of people, such as the number of orders purchased last week in the "high-value active user group", that is, you can filter the number of orders purchased by "filtering user groups". For more information about how to create a user group, see Crowd Insight.
Select a time range

You can select the time range and time granularity for the query as required. You can select a time range in two ways: Relative Period and Fixed Period. In the Relative Mode, the default time is set to the past seven days and is displayed by day.
-The "relative period" is based on the date range pushed forward or backward by an anchor point, which will change with time. It has three dimensions of the past X days, weeks, and months. It also supports custom time filtering conditions for the past X days, weeks, and months. The day is a complete natural day, and the week is selected from Monday to Sunday, and the month is the natural month (from the 1st to the last day of each month)
The detailed rules are as follows:
Past N Days: The current time is used to push forward the entire N days.
Past N Weeks: indicates n complete weeks forward based on the current time. If the current time is the last day of the week, the past N weeks include the week in which the current time is located. Example: If the current time is 7.20 (Tuesday), then the last week is 7.12-7.18 (Monday-Sunday). If the current time is 7.18 (Sunday), then the last week is 7.12-7.18.
Past N Months: indicates n complete months forward based on the current time. If the current time is the last day of the month, the past N months include the month in which the current time is located. Example: If the current time is 7.20, then the past month is 6.01-6.30; if the current time is 6.30, then the past month is 6.01-6.30.
-"Fixed period" You can directly select the start date in the calendar box, click OK, the current time range will be selected for data analysis (fixed period without time range limit).
View analysis charts
After setting the query criteria and clicking Start Analysis, you can view the analysis results.
The chart style supports "line", "column chart", "ranking chart", "circular chart", "indicator" and "indicator trend" to display the chart.
Click the "More" button in the upper right corner and select "Export Data" to download the Excel file.
Save common metrics for subsequent re-query. You can click the Save button in the upper-right corner.
After the existing saved metrics are updated and edited, you can click the "Update" button in the upper left corner to update them.
After modifying a metric in an existing saved metric analysis, you can click Save As in the upper right corner to save the new metric in the metric list.
View SQL statements
On the Analysis Chart page, you can view the query SQL of the current behavior analysis. Click Copy to copy the query SQL. 
View detailed data
You can view the detailed data of the statistical results. The total data is the deduplication data within the time range. You can view the detailed data by time dimension.
Save Data to Report 

Click Save in the upper right corner to open the Save Report dialog box. To save the report, you need to fill in and select the following items;
1. Enter a report name
2. Select the time period for saving the report.
-Impact of different time periods on reports
Select a relative time period, and the report date can be updated as the query time passes.
If you select a fixed period, the report date does not change based on the time selected on the kanban.
If no time period is selected, the report date displays data from the past 7 days by default.
3. Click the OK button to save the data to the report list.
Add a report to the dashboard
For a saved report, you can choose to add the report to the kanban. Click the "Add to kanban" button in the upper right corner to pop up the Add to kanban pop-up window. To add a kanban, you need to fill in the following information:
Enter Report Name
Select the added kanban
Select the type of display you want the chart to display.
Select the display layout of the chart in the self-made kanban
Advanced Settings allows you to set the default time granularity to day, week, or month. You can enable the filter switch in the kanban.
Click "OK"
Detailed data event logs

1. For the query results of event analysis, click any indicator value on the detailed data table to generate a report based on the event log details corresponding to the selected indicator result value.
2. Click the "get event details" button to pop up the save file pop-up window.
3. Save and click to enter the "Download Center" and jump to the event details report (offline) to view the download task.
Save detailed data as a group
1. For the query results of event analysis, click any indicator value on the detailed data table to generate a report based on the event log details corresponding to the selected indicator result value.
2. Click the Save as Crowd button to pop up the Save pop-up window.
3. The group name can be customized according to the business situation.
4. Account disclosure range support: not public (only visible to you), fully public (visible to all members), and partially public (visible to specified members).
5. Click the "OK" button to save and click the crowd to save the successful "jump view" to jump to the user profile page to view the saved crowd.