Difference calculation compares values between two data points to measure changes across time periods or dimensions, such as the difference between April and March sales, or between Product A and Product B sales.
Prerequisites
-
You have created a dashboard. For more information, see Create a Dashboard.
-
A dataset is selected and chart fields are configured. For more information, see Configure Chart Fields.
Limitations
-
Totals and subtotals are not included in difference calculations. If difference calculation is configured for a field, totals and subtotals will automatically be disabled (displayed as "-").
-
Empty values are not included in difference results and do not affect other data results. Empty values remain empty (displayed as "-").
-
This analysis method is based on the returned result set calculation, with a current limit of 10,000 in the public cloud. If the total returned data exceeds 10,000, calculation results might not meet expectations.
-
When you need to sort data, sort it first before performing difference calculations.
-
When you need to calculate with multiple datasets, associate the datasets first, then perform calculations based on the complete associated dataset. Calculating on unassociated datasets might lead to results that do not match actual situations.
-
Difference calculation is unavailable when cross tables or detailed tables contain only measure fields without dimension fields.
-
The following charts support difference calculation.
Difference calculation method
Description
Supported chart types
Overall difference
Performs difference analysis on the overall data.
-
Line/area charts: line chart, area chart, stacked area chart, 100% stacked area chart, and combination chart.
-
Column/bar charts: column chart, stacked column chart, 100% stacked column chart, circular column chart, ranking chart, bar chart, stacked bar chart, 100% stacked bar chart, waterfall chart, bullet chart, box plot, and histogram.
-
Bubble/scatter charts: bubble chart, scatter chart, and facet scatter chart.
-
Table charts: cross table, detailed table, and heat map.
-
Pie/ring charts: pie chart, rose chart, radar chart, and treemap chart.
-
Geographic charts: color map, bubble map, heat map, flow map, and symbol map.
-
Metric charts: metric card and metric trend chart.
-
Funnel/conversion charts: funnel chart and comparison funnel chart.
-
Other charts: word cloud.
Within-group difference
Groups data by a specific dimension and performs difference analysis within each group.
-
Table charts: cross table.
-
Configuration Entry
In the Fields panel of the chart, find the measure field for which you want to use difference calculation, click the  icon on the right, and select Advanced Calculation > Difference from the dropdown list. Then set the difference calculation method according to your business scenario.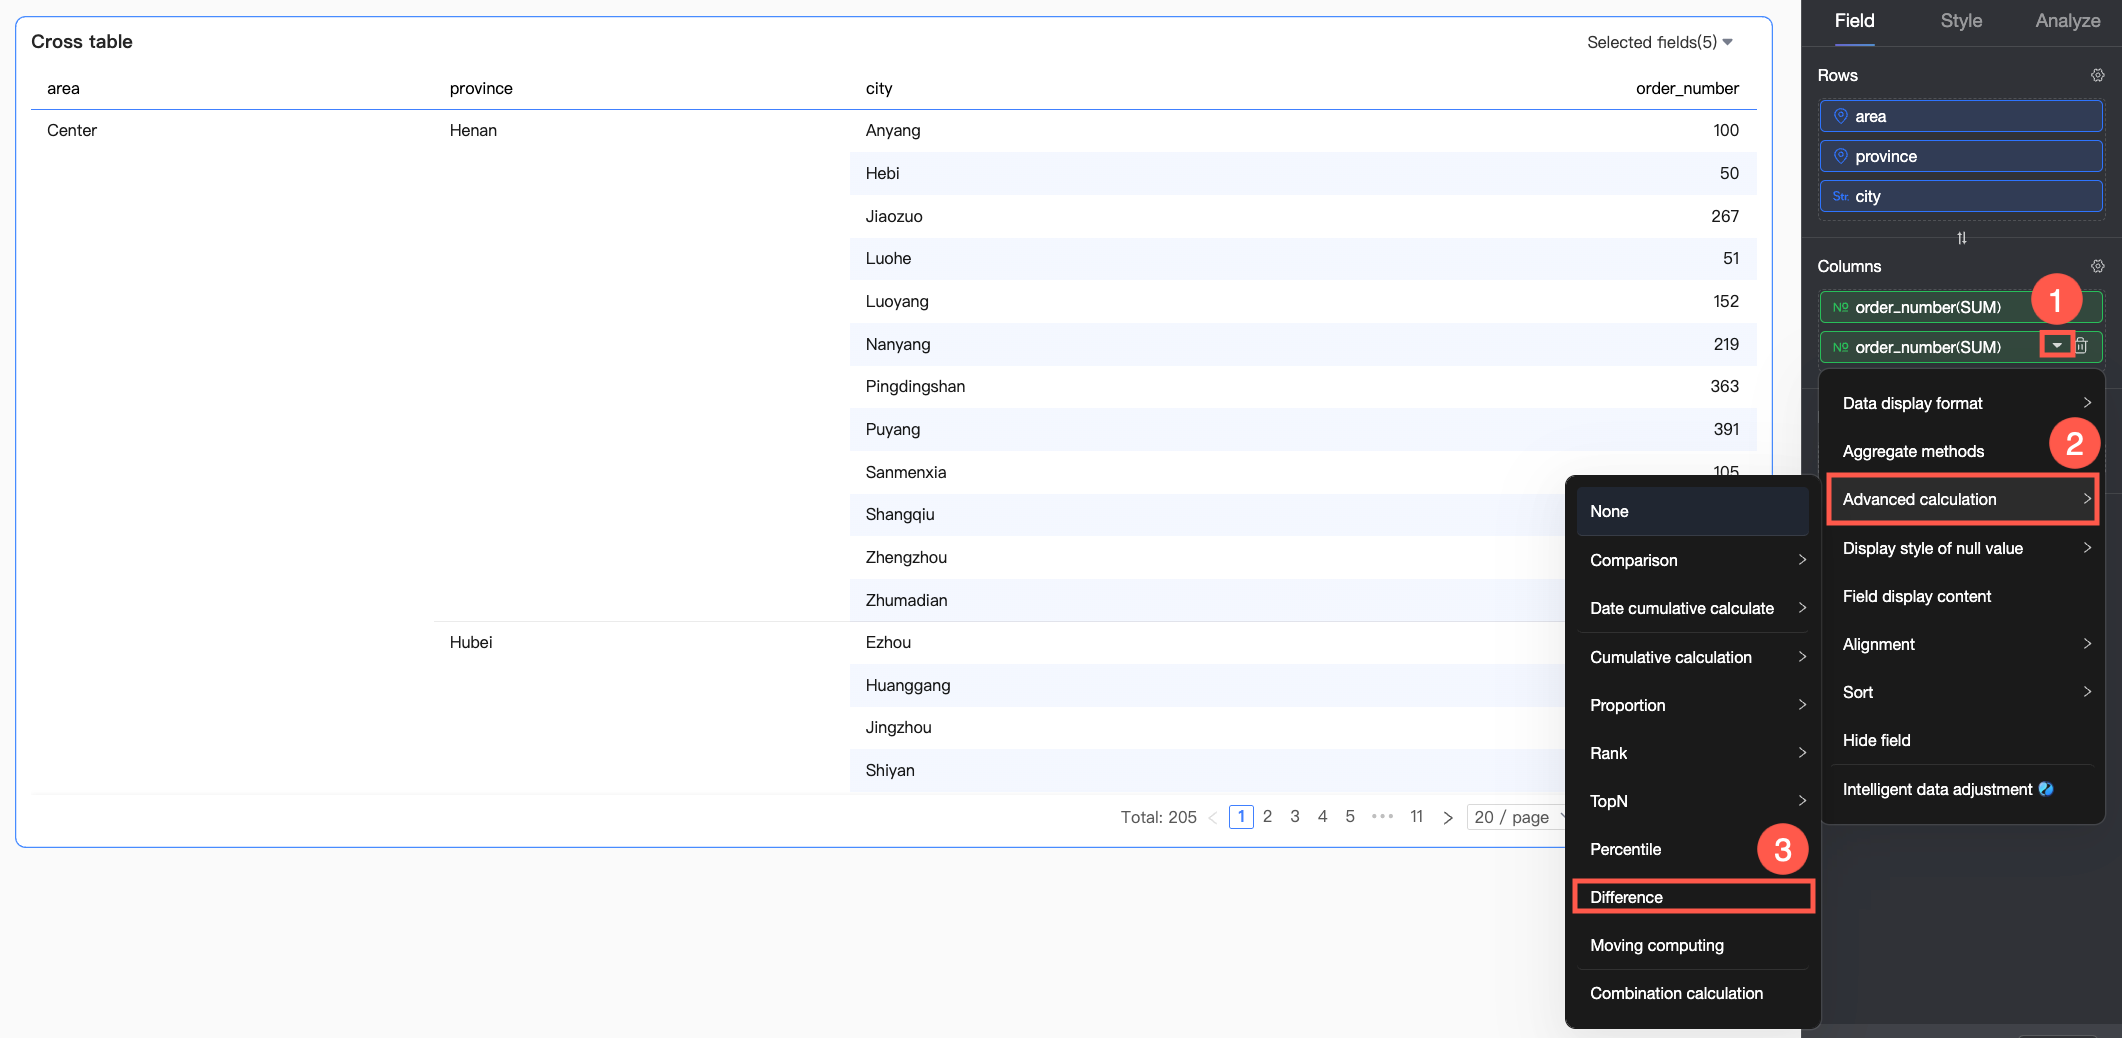
Cross tables use a different configuration from other charts, as shown below.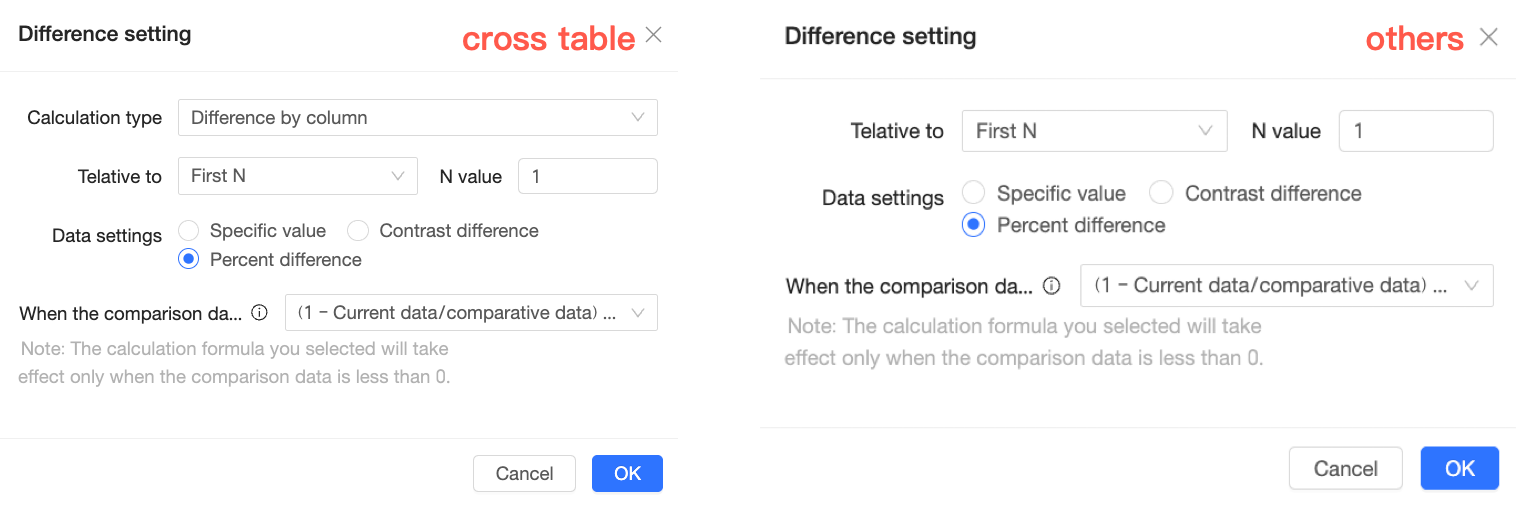
|
Chart type |
Calculation type |
Limitation |
Calculation logic |
|
Cross table |
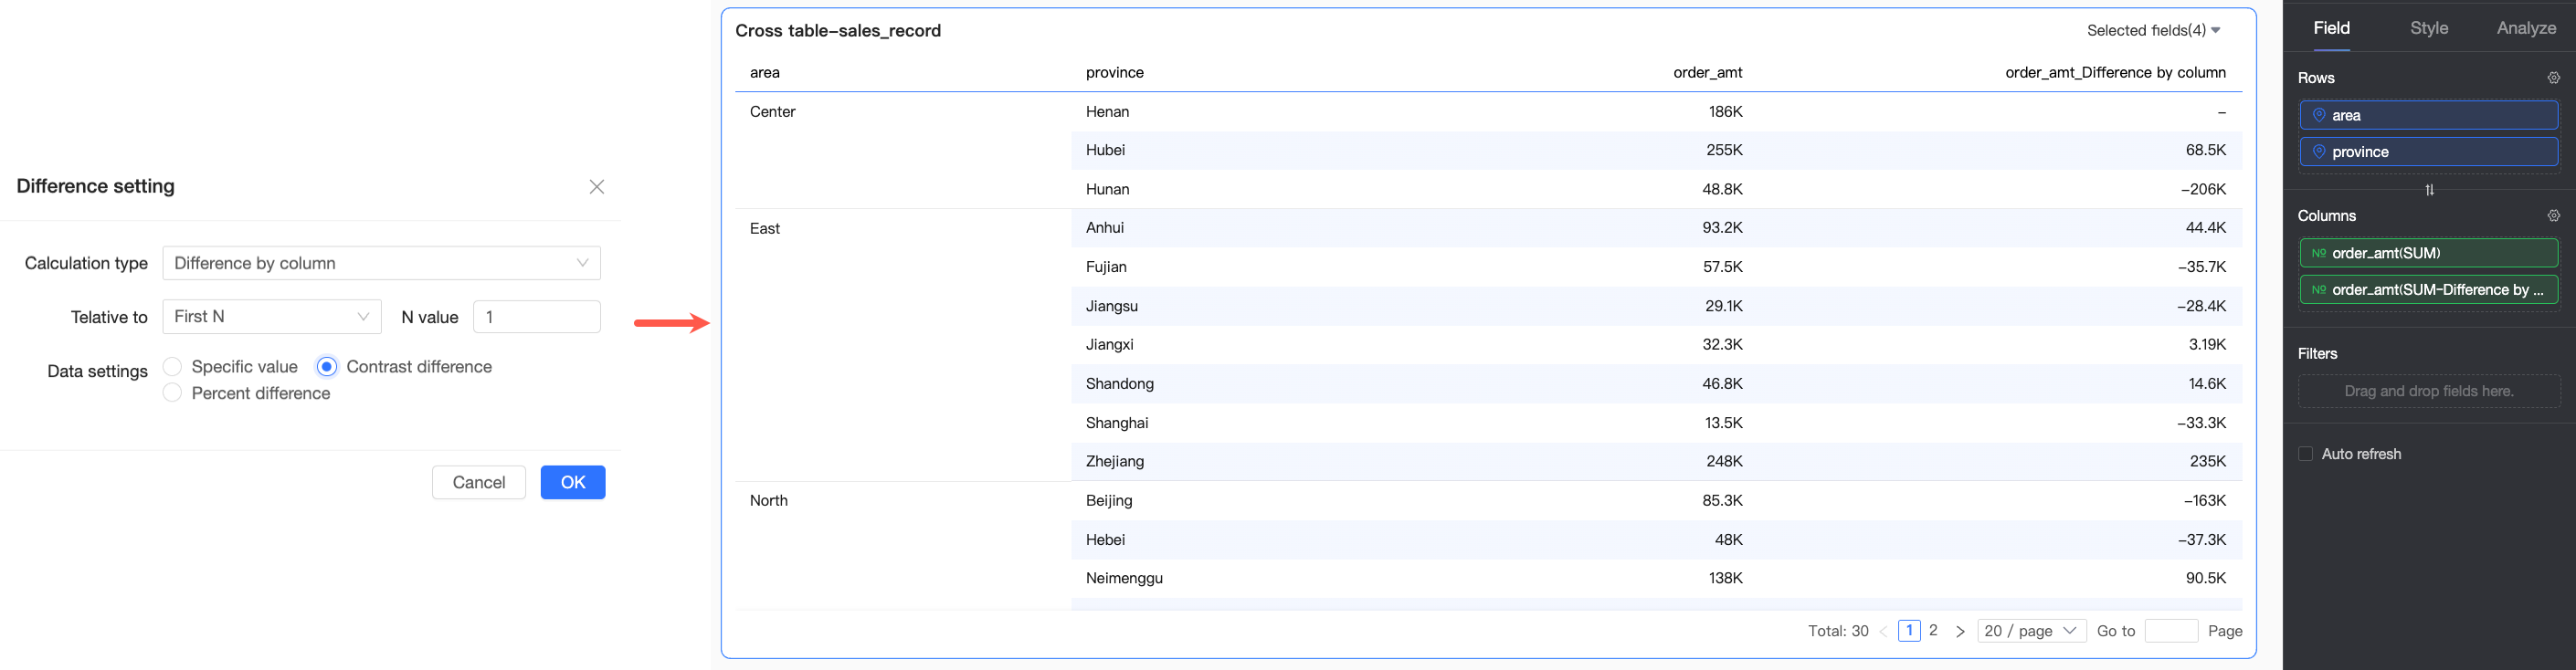
Column difference |
Dimension fields in the Row area |
Performs difference calculation with each column as an independent analysis unit. |
|
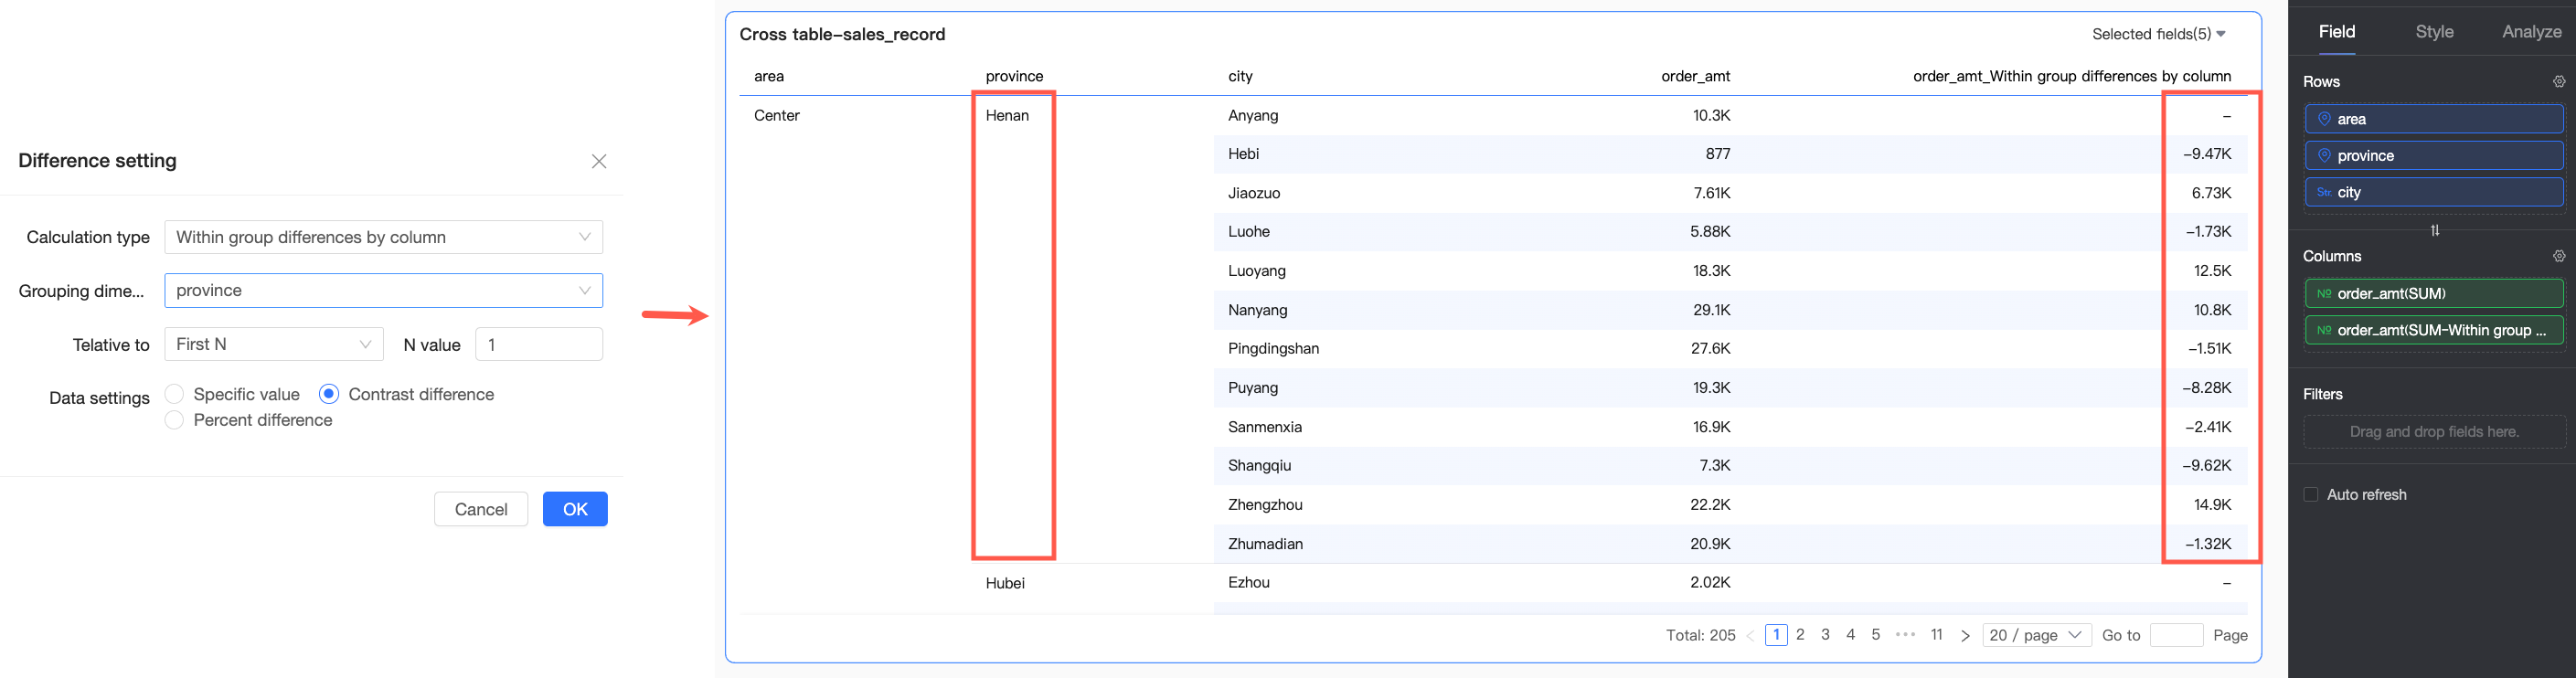
Within-column group difference |
Two or more dimension fields in the Row area |
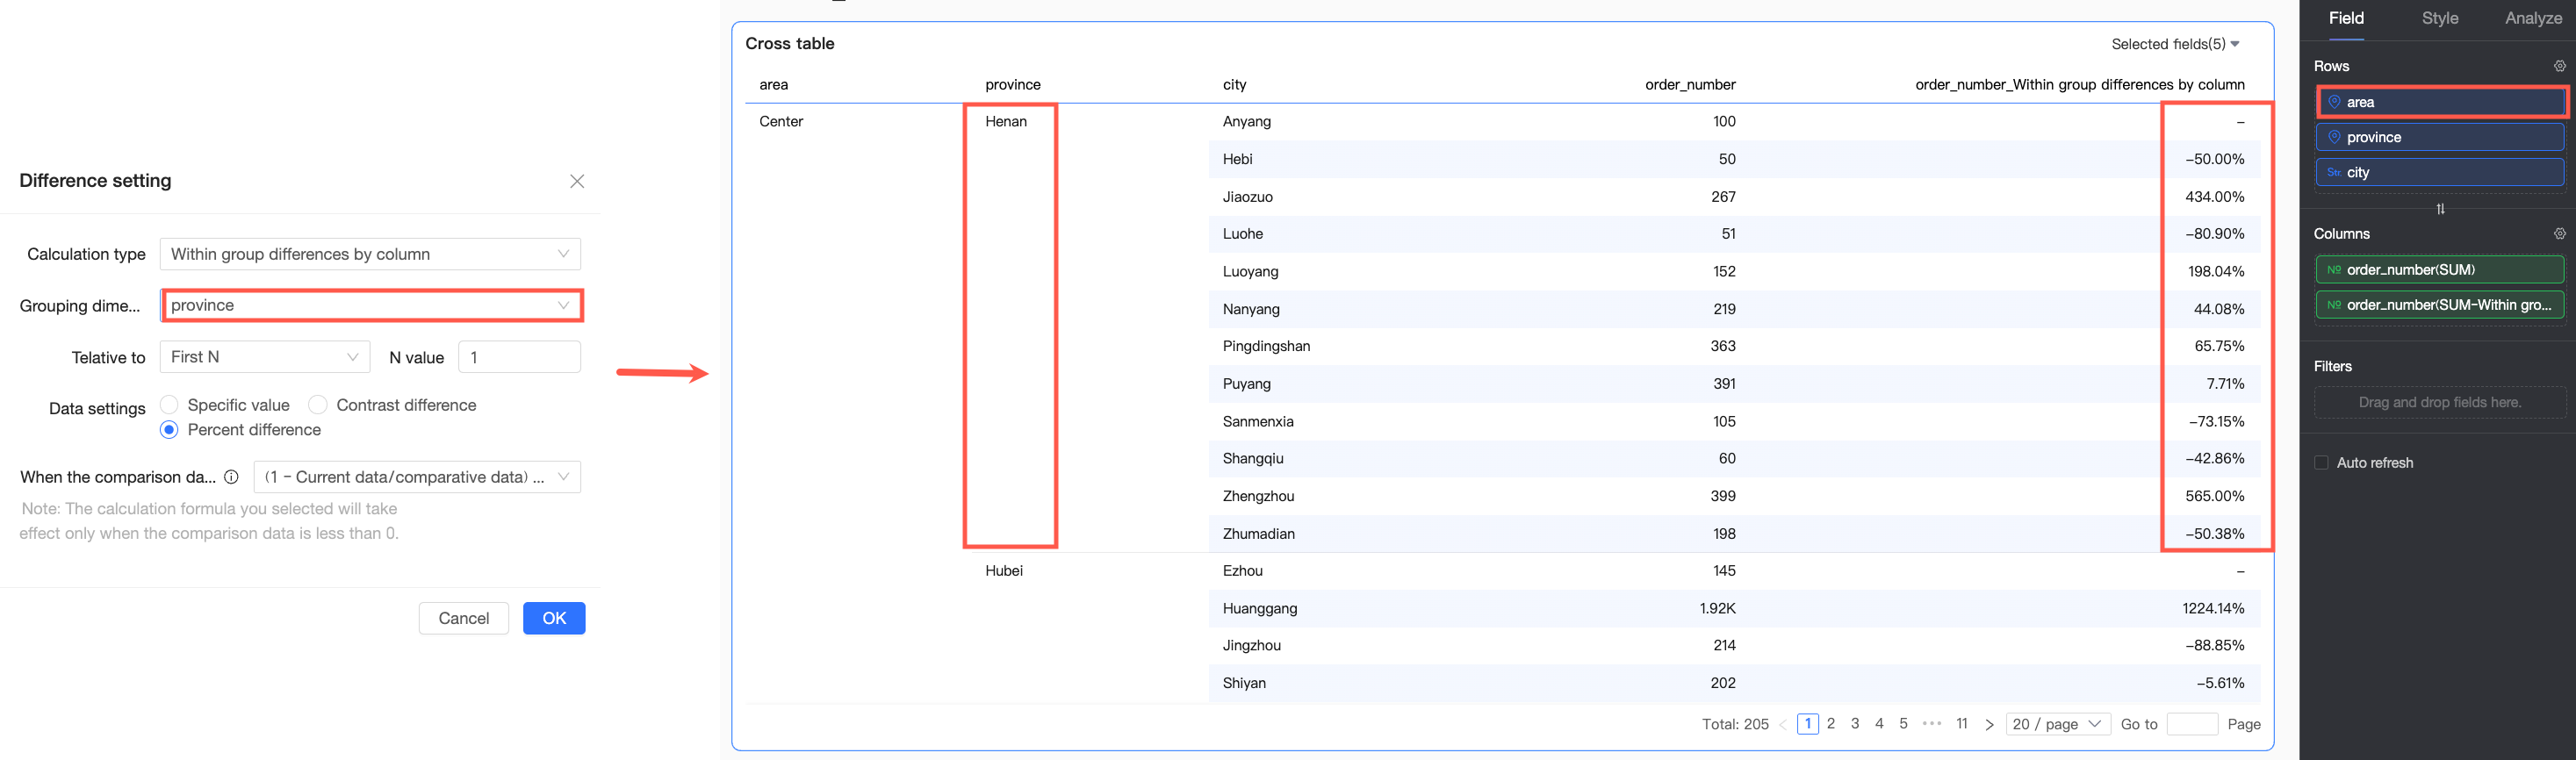
Groups single-column data by the selected dimension and performs difference calculation within each group. The grouping logic is: starting from the first dimension in the Row area up to the selected grouping dimension, all dimensions in between are treated as a whole for grouping operations. For example, in the image below, the Region and Province fields will be used for grouping operations. |
|
|
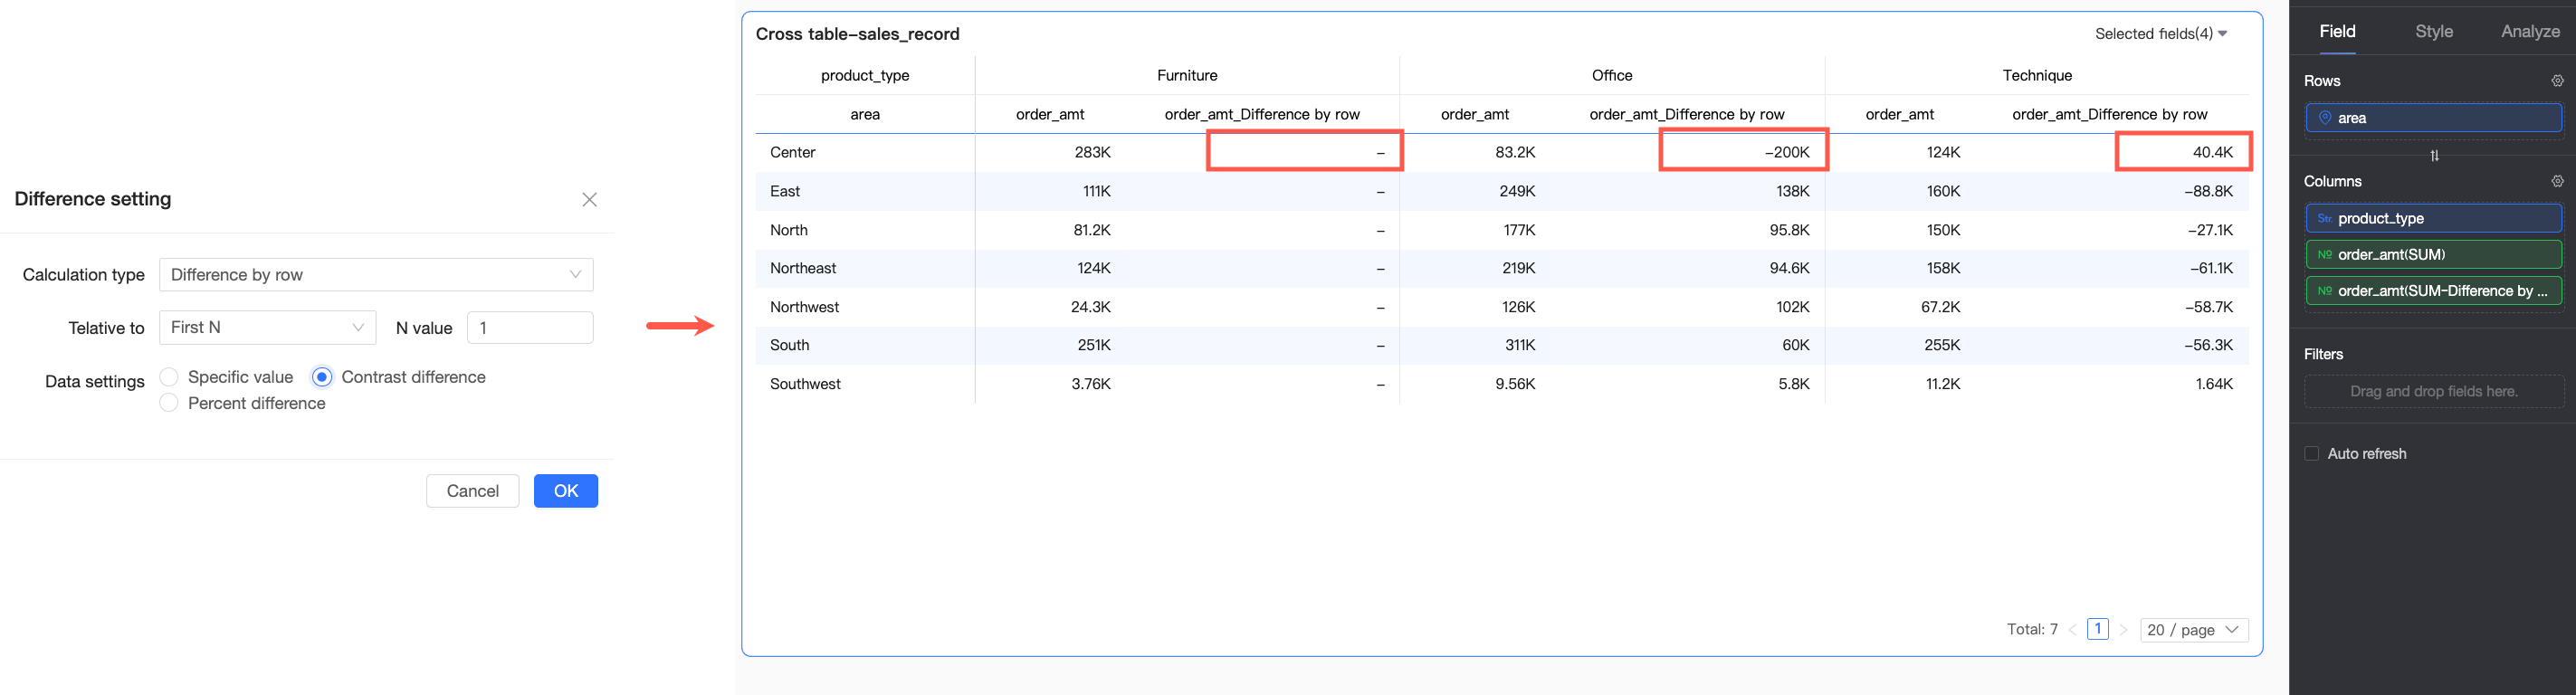
Row difference |
Dimension fields in the Column area |
Performs difference calculation with each row as an independent analysis unit. |
|
|
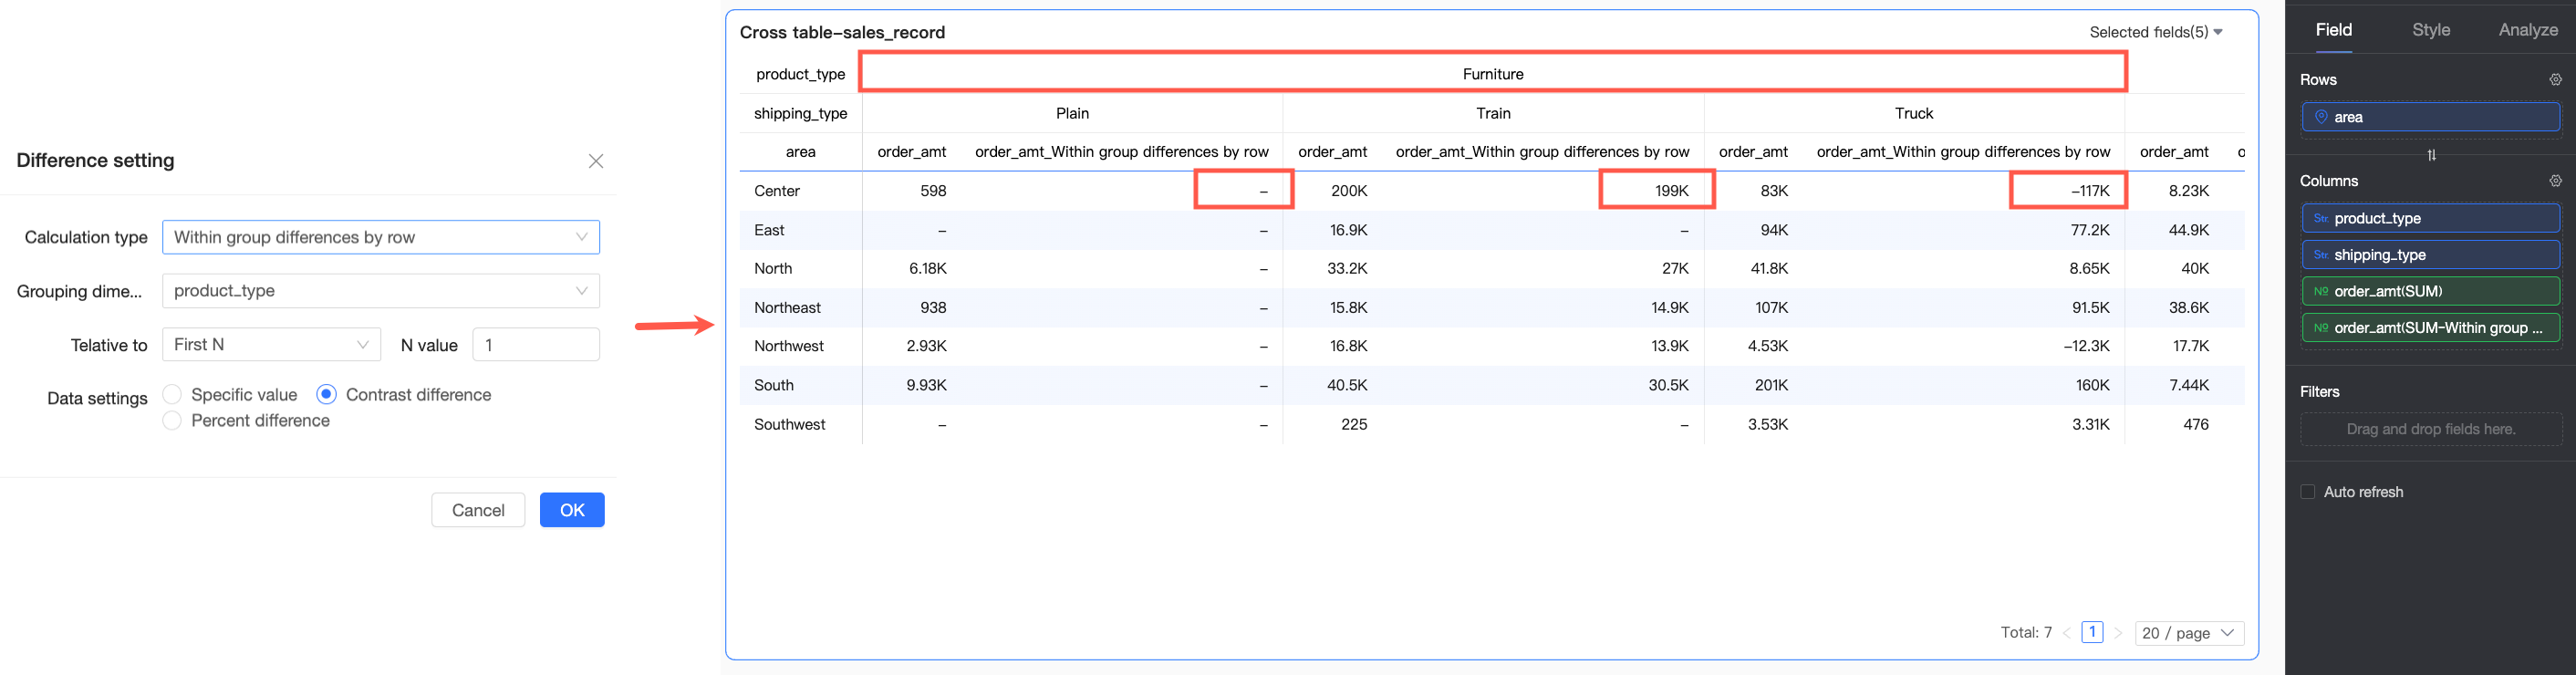
Within-row group difference |
Two or more dimension fields in the Column area |
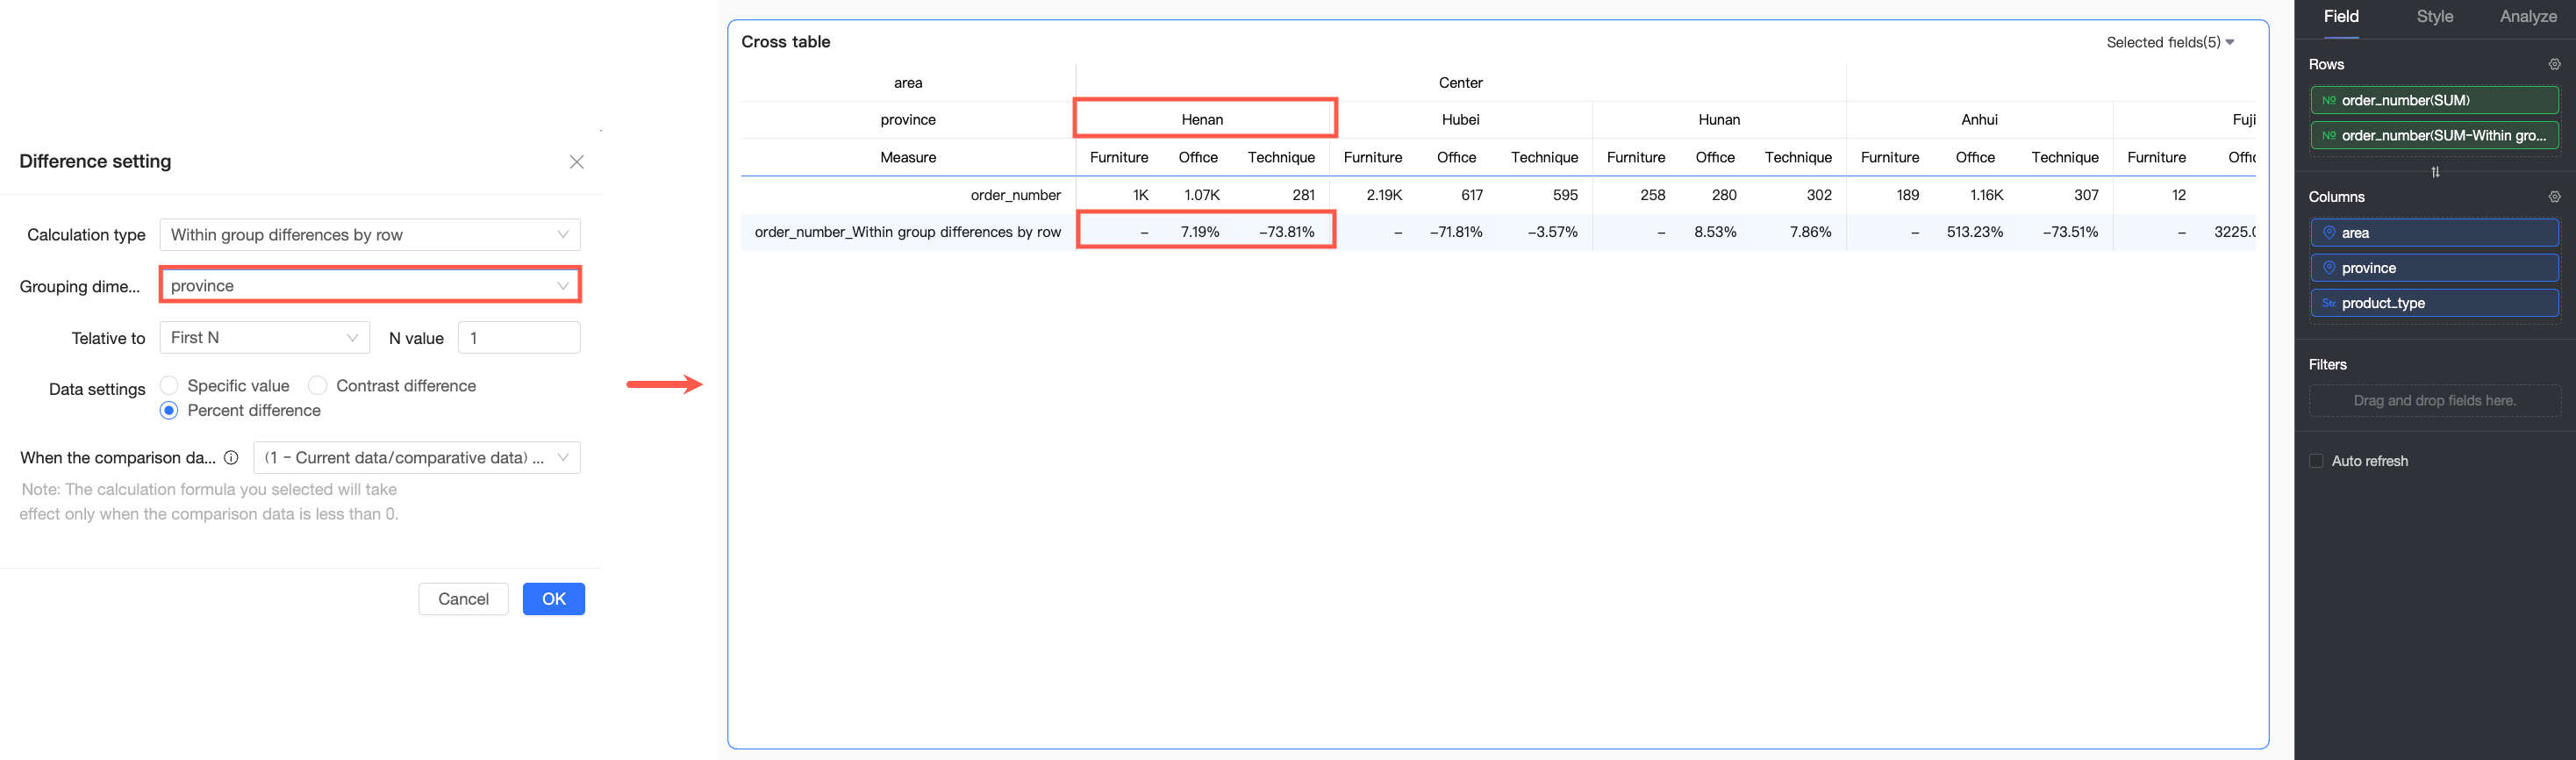
Groups single-row data by the selected dimension and performs difference calculation within each group. The grouping logic is: starting from the first dimension in the Column area up to the selected grouping dimension, all dimensions in between are treated as a whole for grouping operations. For example, in the image below, the Region and Province fields will be used for grouping operations. |
|
|
Other charts |
Overall difference |
/ |
Performs difference calculation on the overall data. |
Examples
The following examples illustrate how difference calculation works in practice.
Example 1: Metric card
This example uses a metric card to show difference calculation.
Log on to the Quick BI console.
-
Follow the steps shown in the image below to access the dashboard editing page.

-
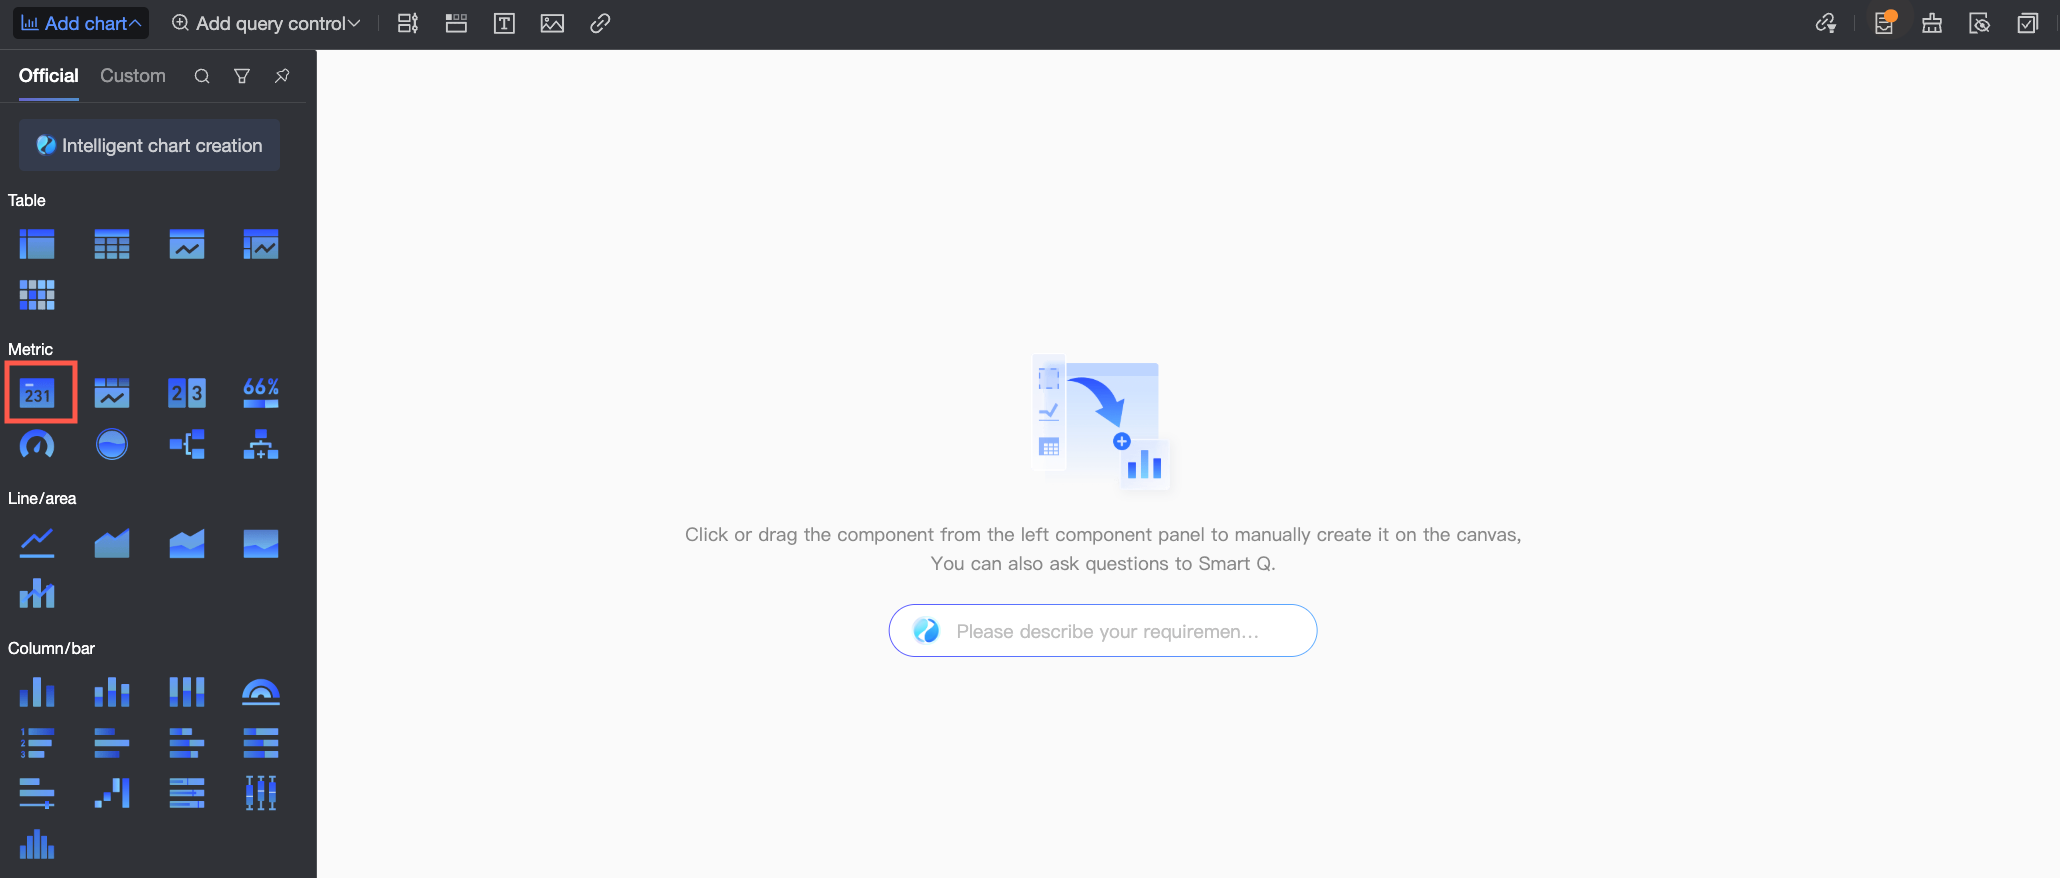
In the top menu bar, click Add Chart, find Metric Card, and click or drag it to the dashboard area.
-
In the Data Panel's Fields tab, configure the metric card data.
Select the required dimension and measure fields, and double-click or drag them to the target areas.
-
In the Dimensions list, find Region, and double-click or drag it to the Row area.
-
In the Measures list, find Order amount, and double-click or drag it twice to the Column area.
Note-
The two Order amount fields in the Column area display the original data and the difference calculation value respectively.
-
When two duplicate fields are placed in the measures area, a "Duplicate measure exists" prompt will appear. You can ignore this for now and update the data after completing the configuration.
-
-
-
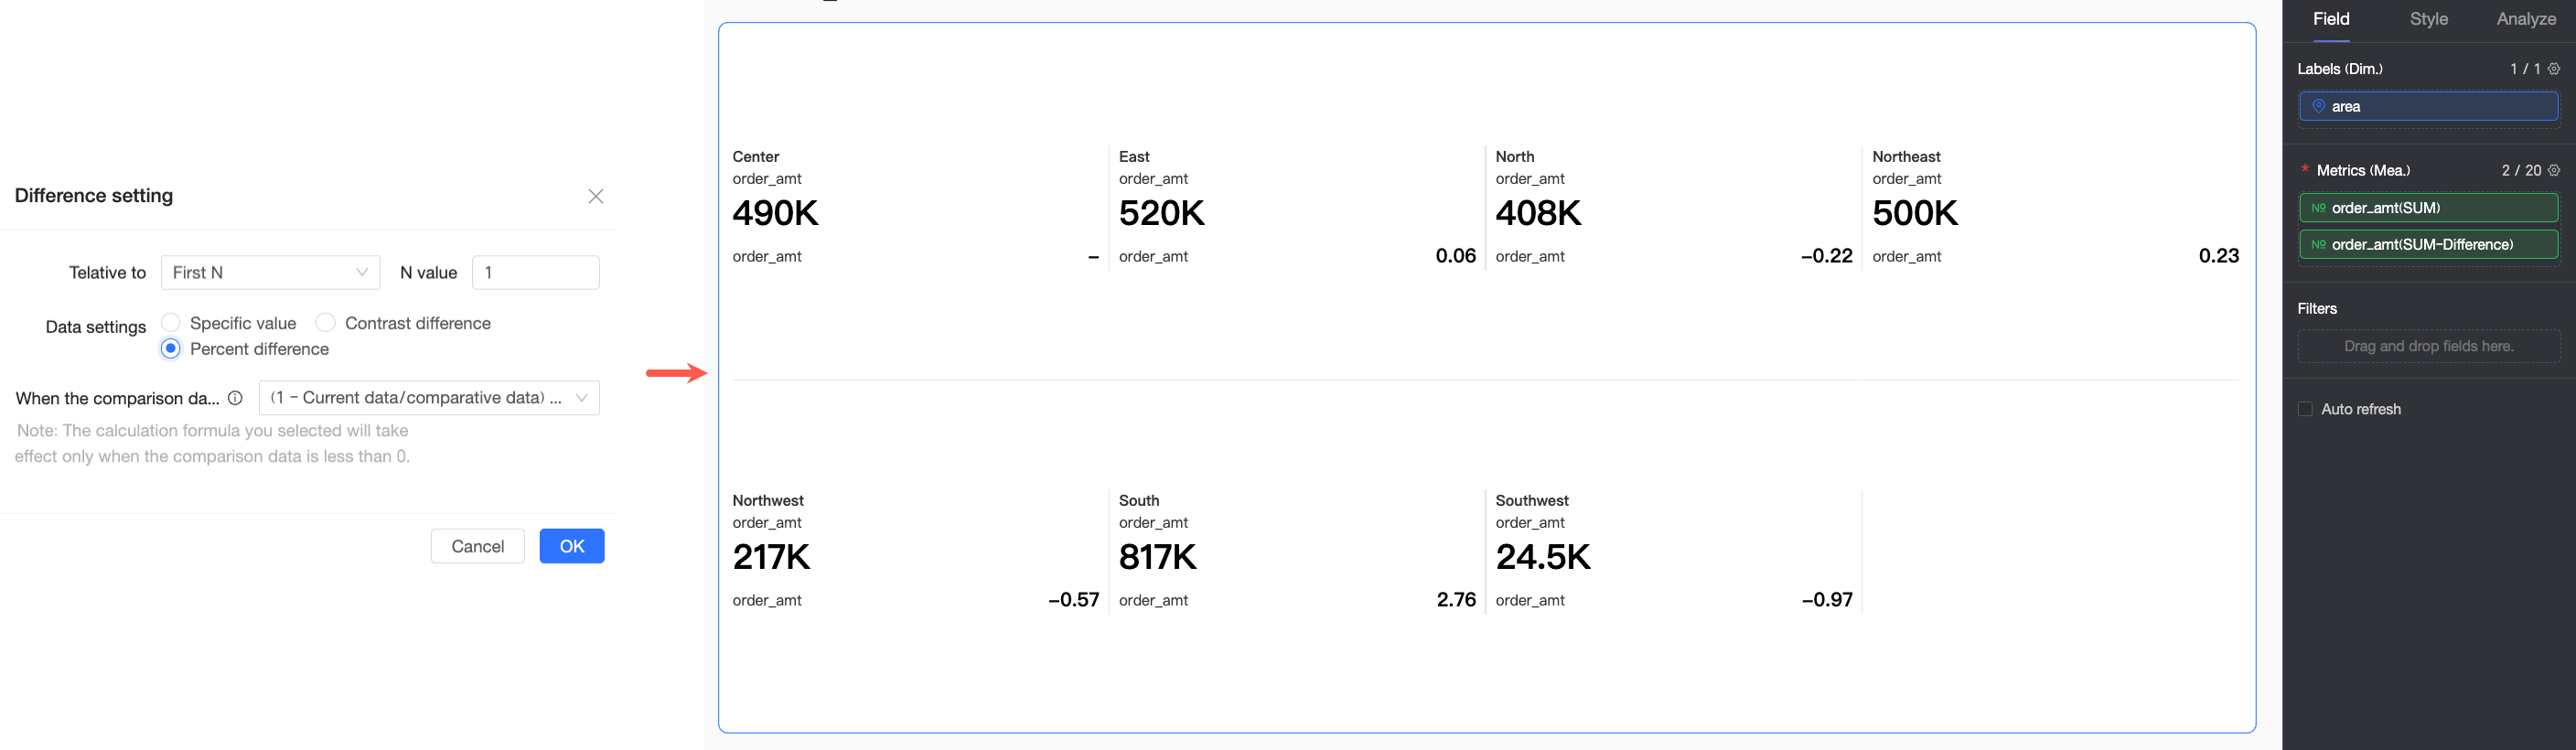
Click the
 icon next to the second Order amount field, select Advanced Calculation > Difference, and in the Difference Settings dialog box, configure the specific difference calculation method for the current chart.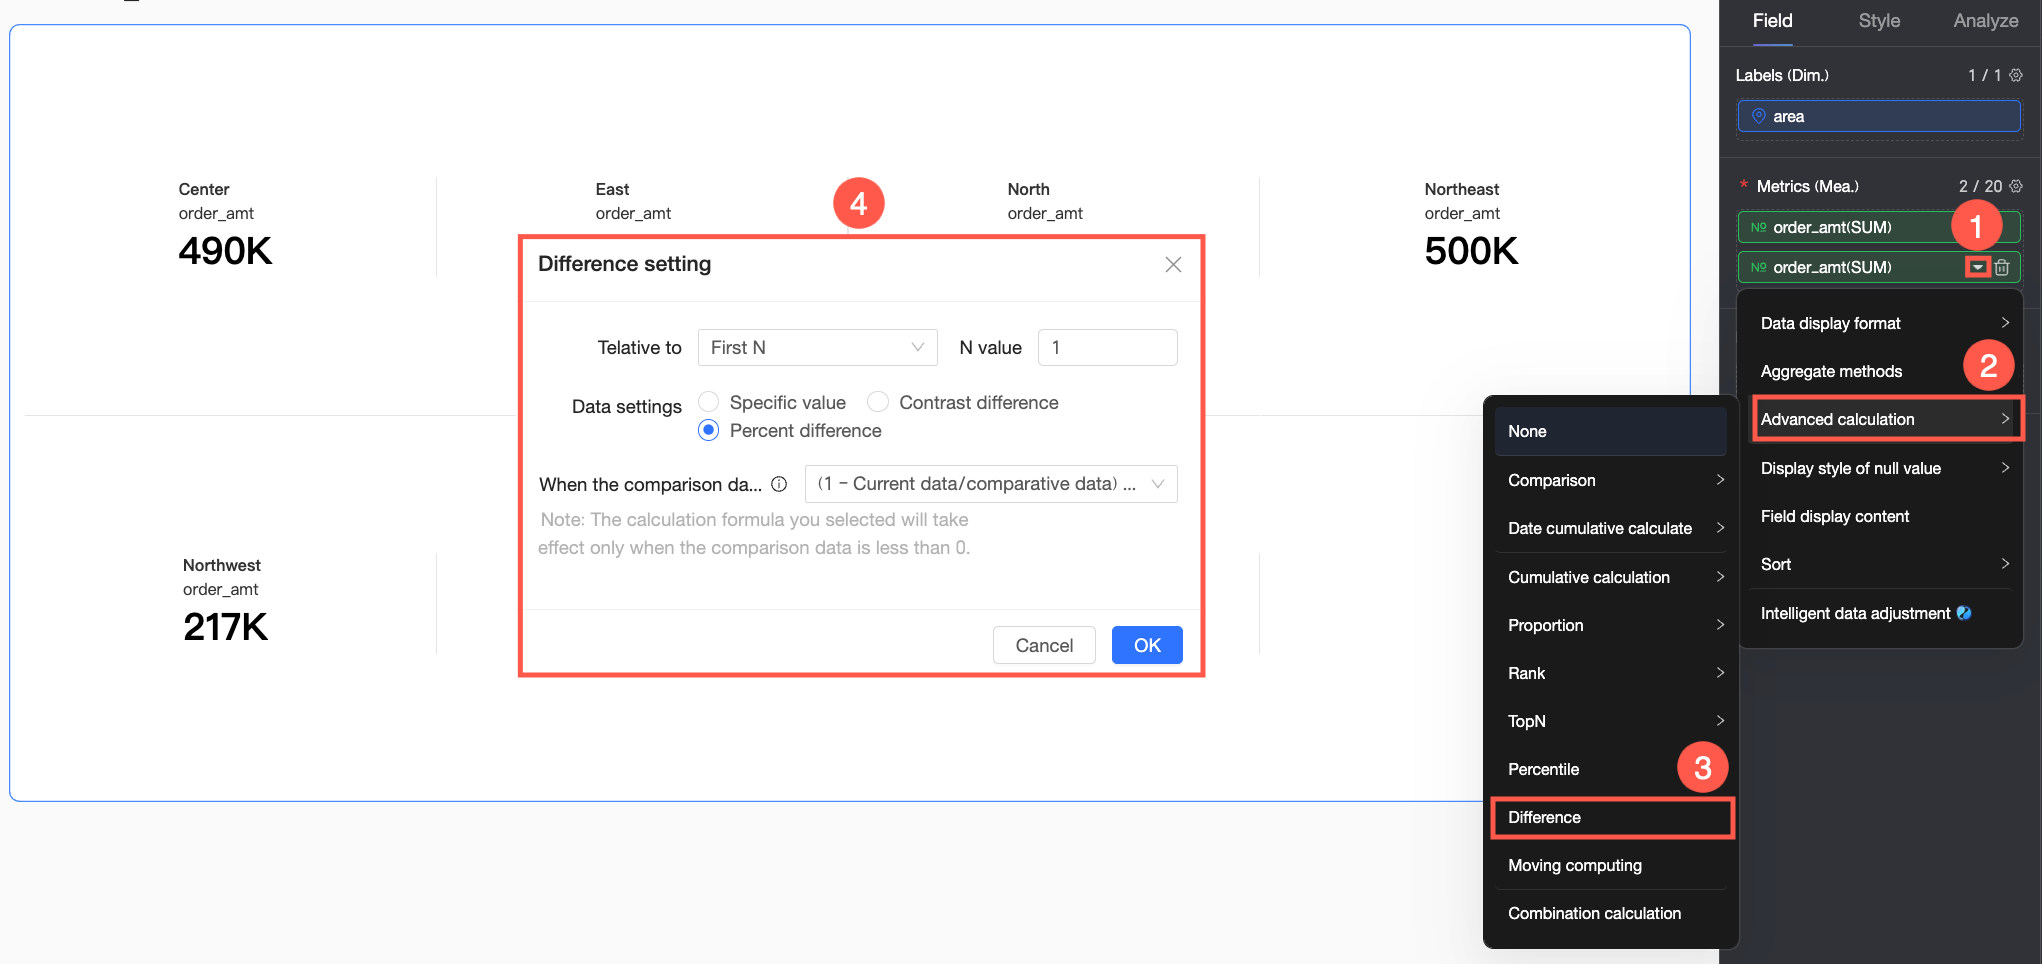
-
Relative to, N value: Set which specific data point the current data point should be compared with, and the specific number that N represents.
Relative to type
Description
Example effect
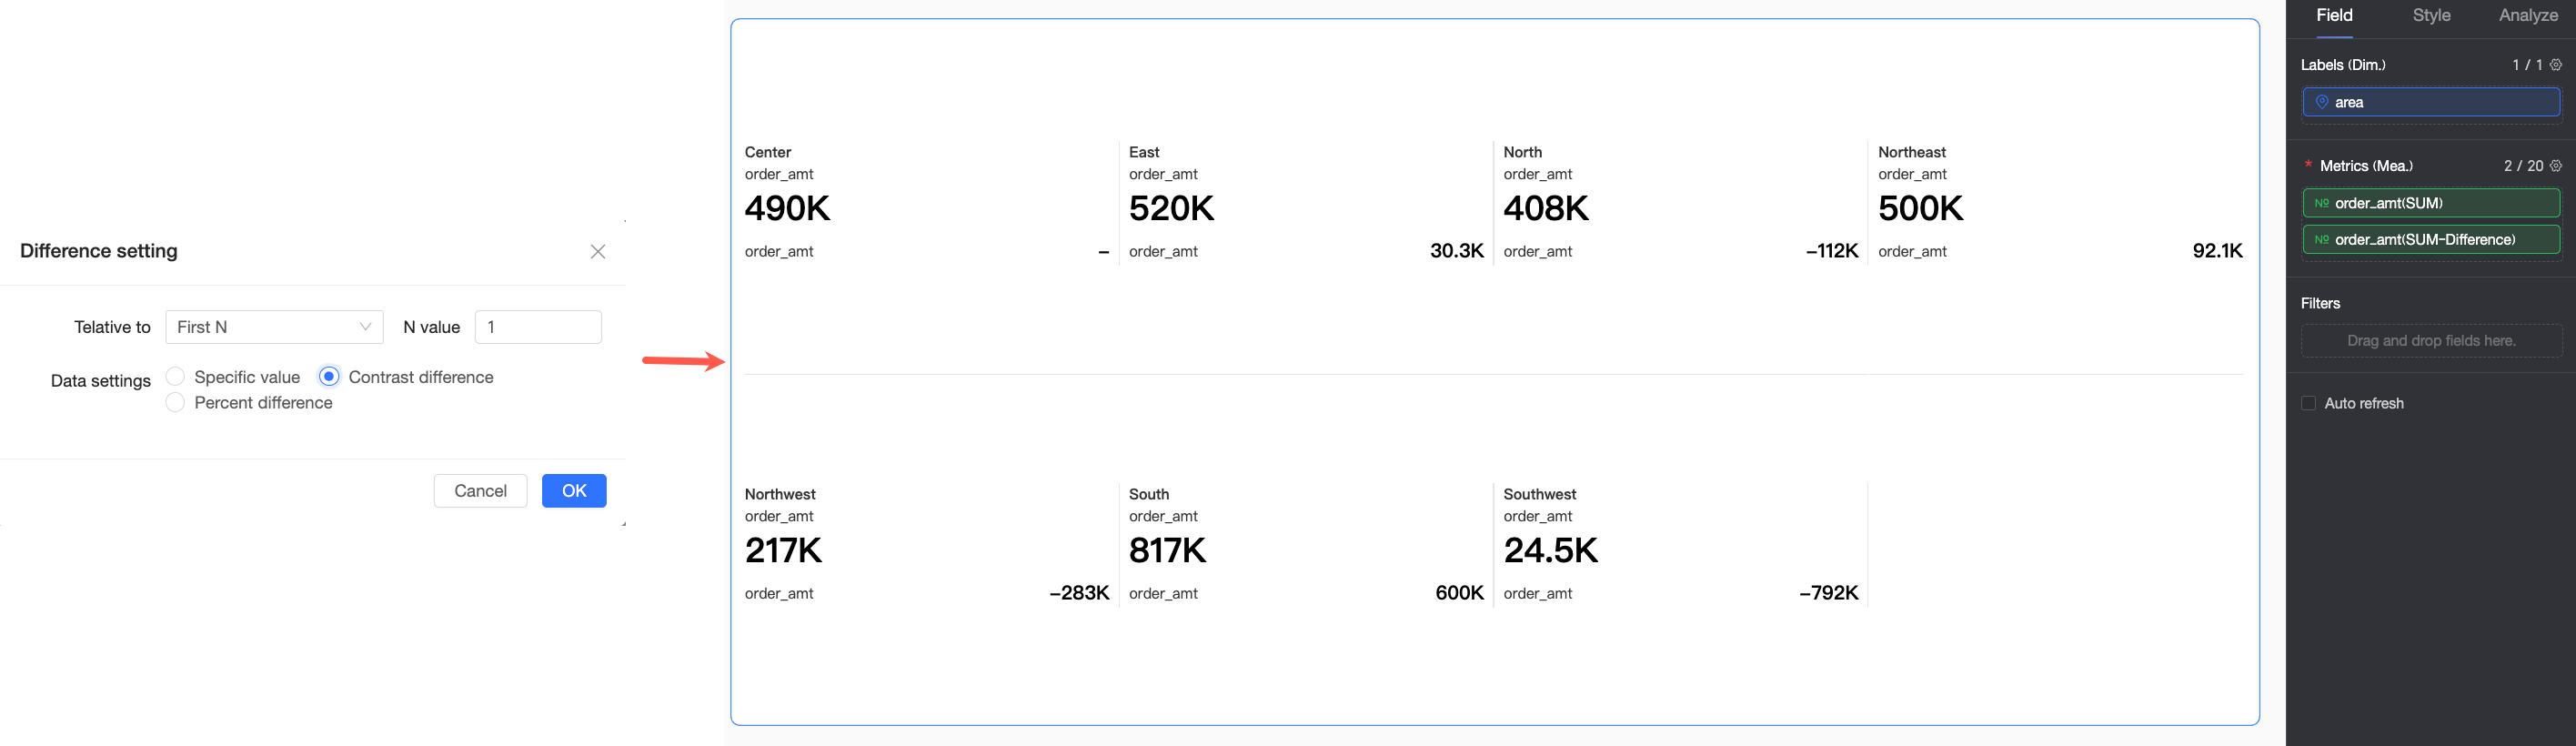
Previous N
Compare with the Nth data point before the current data point.
The difference between the current data point and the previous 1 data point. For example: the difference between East China sales and Northeast China sales.
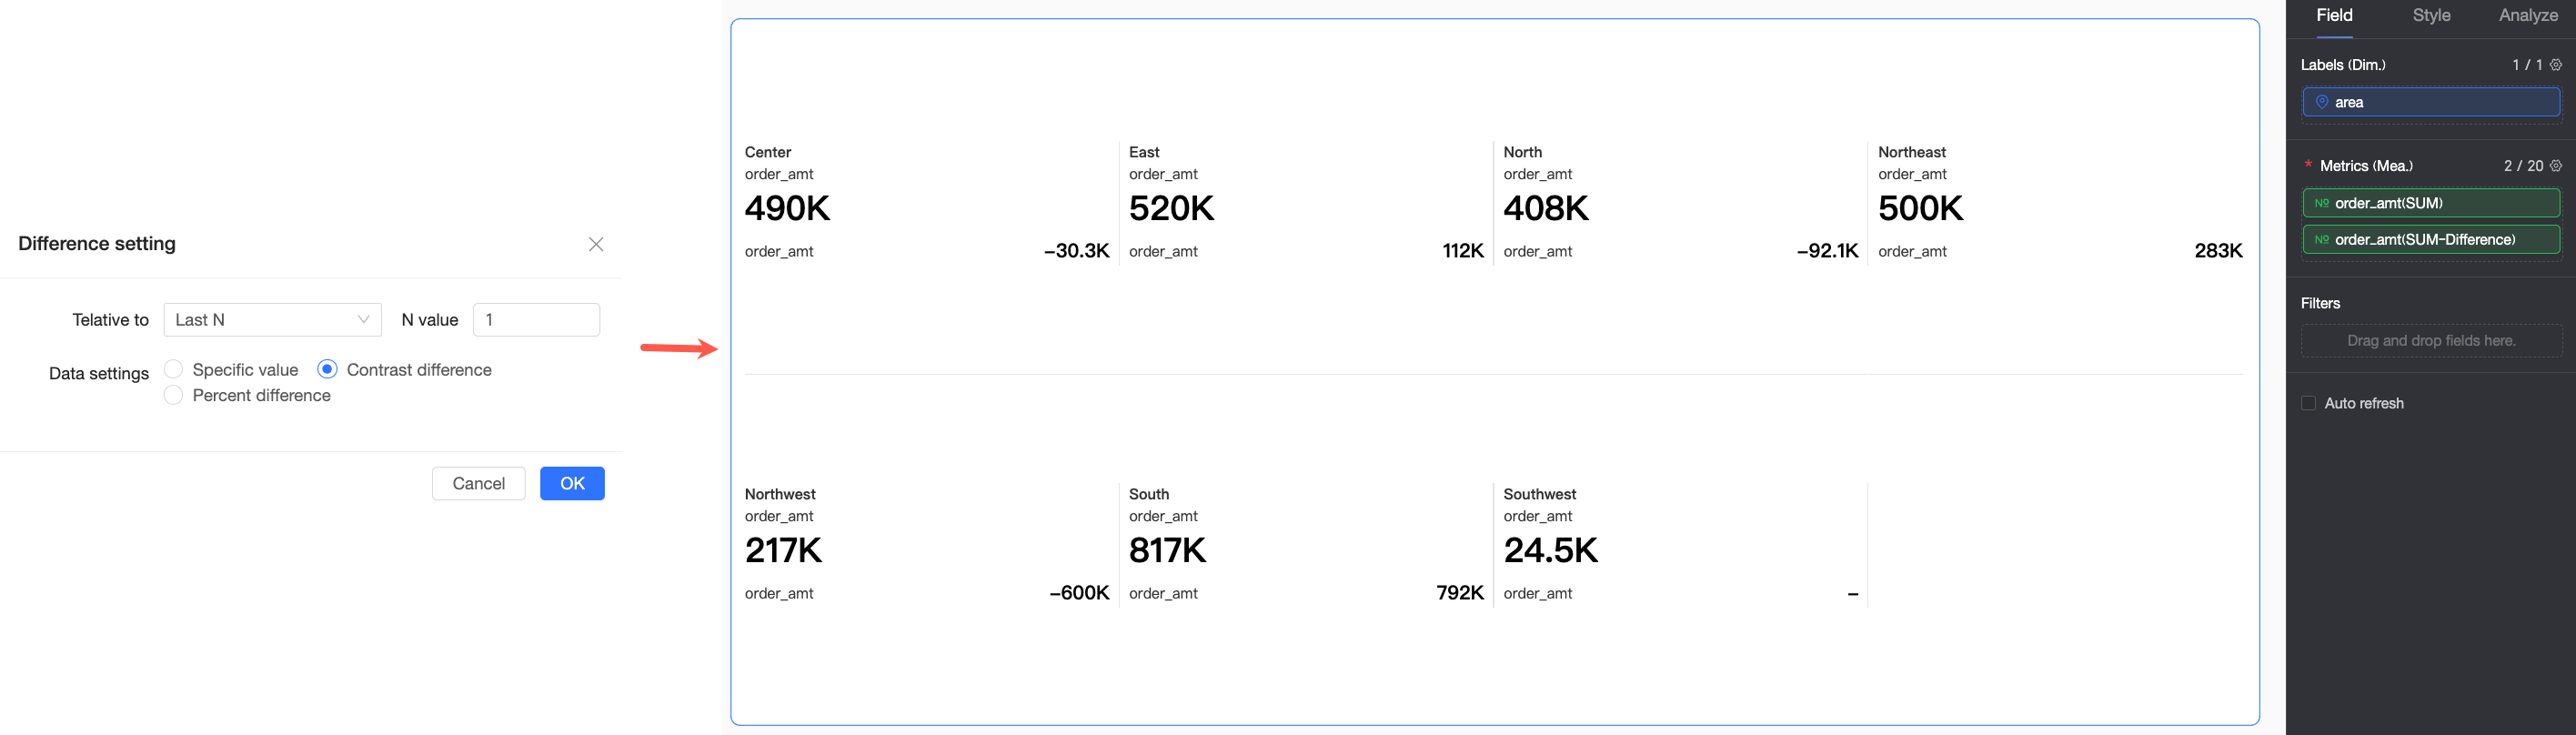
Next N
Compare with the Nth data point after the current data point.
The difference between the current data point and the next 1 data point. For example: the difference between East China sales and Central China sales.
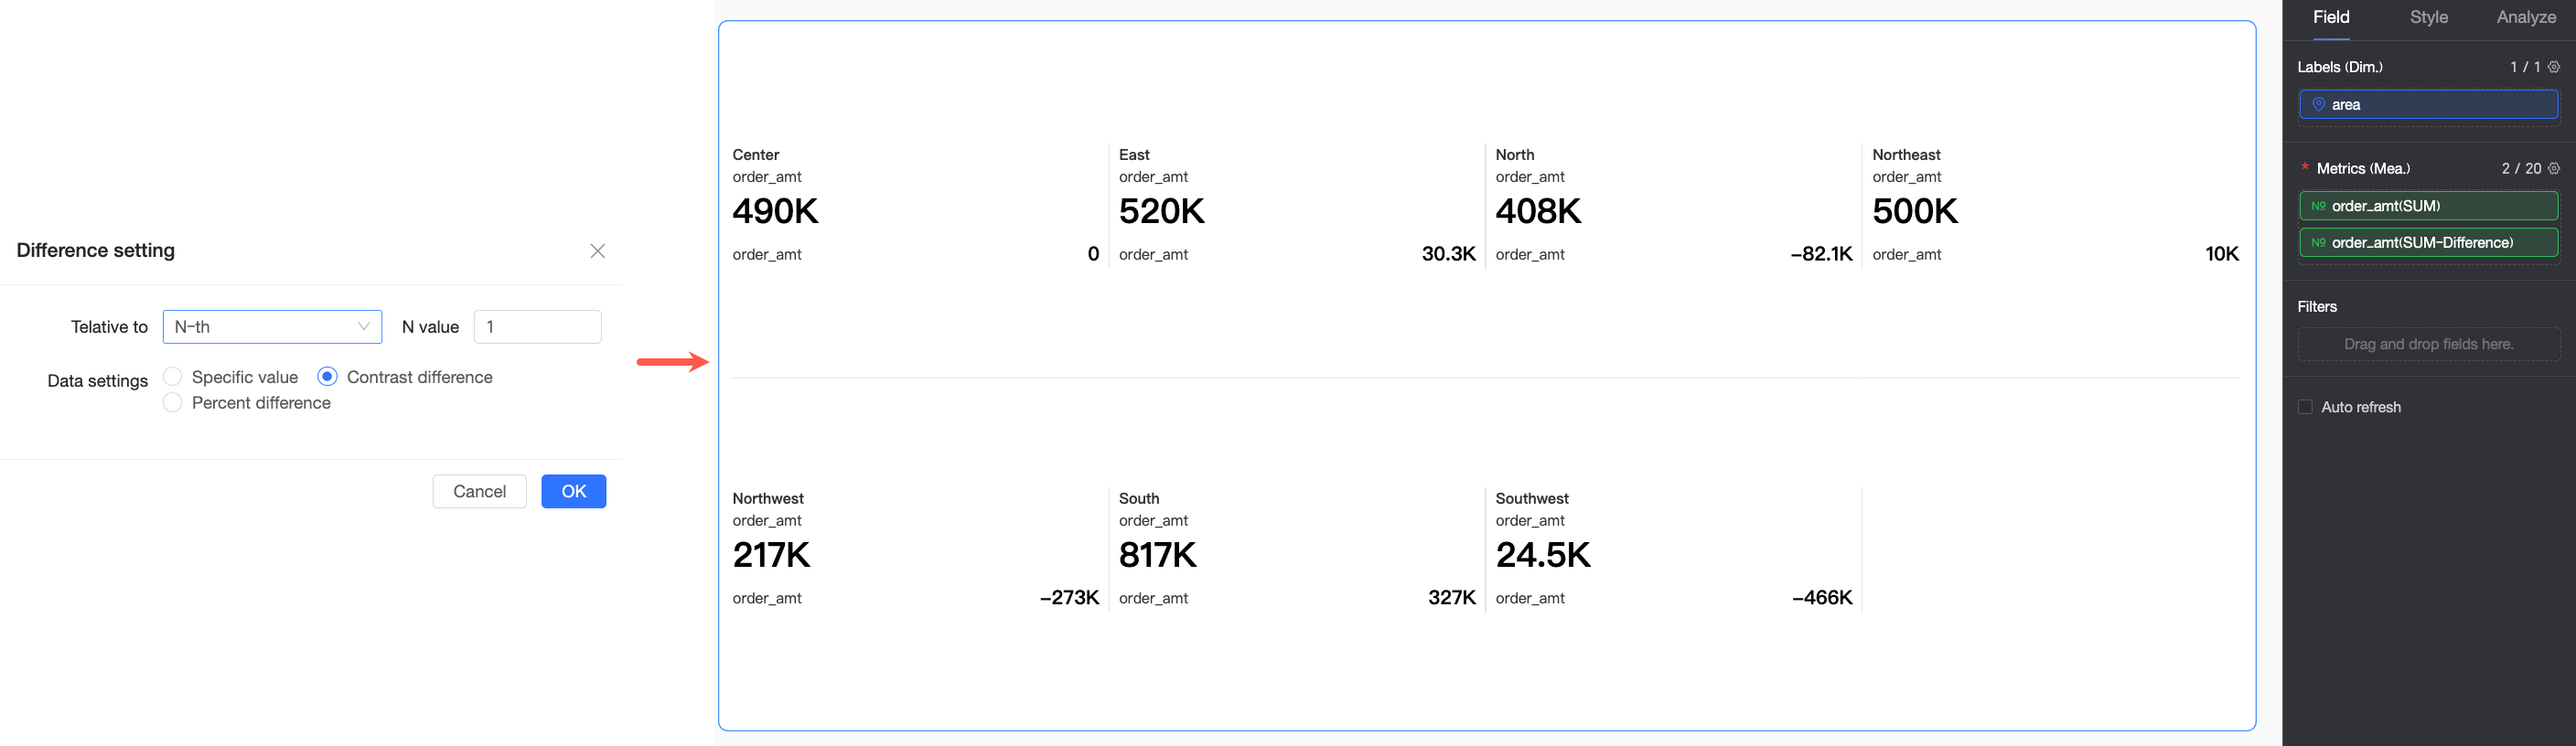
Nth
Compare with the Nth data point in the overall data.
The difference between the current data point and the 1st data point in the overall data. For example: the difference between sales in each region and Northeast China sales.
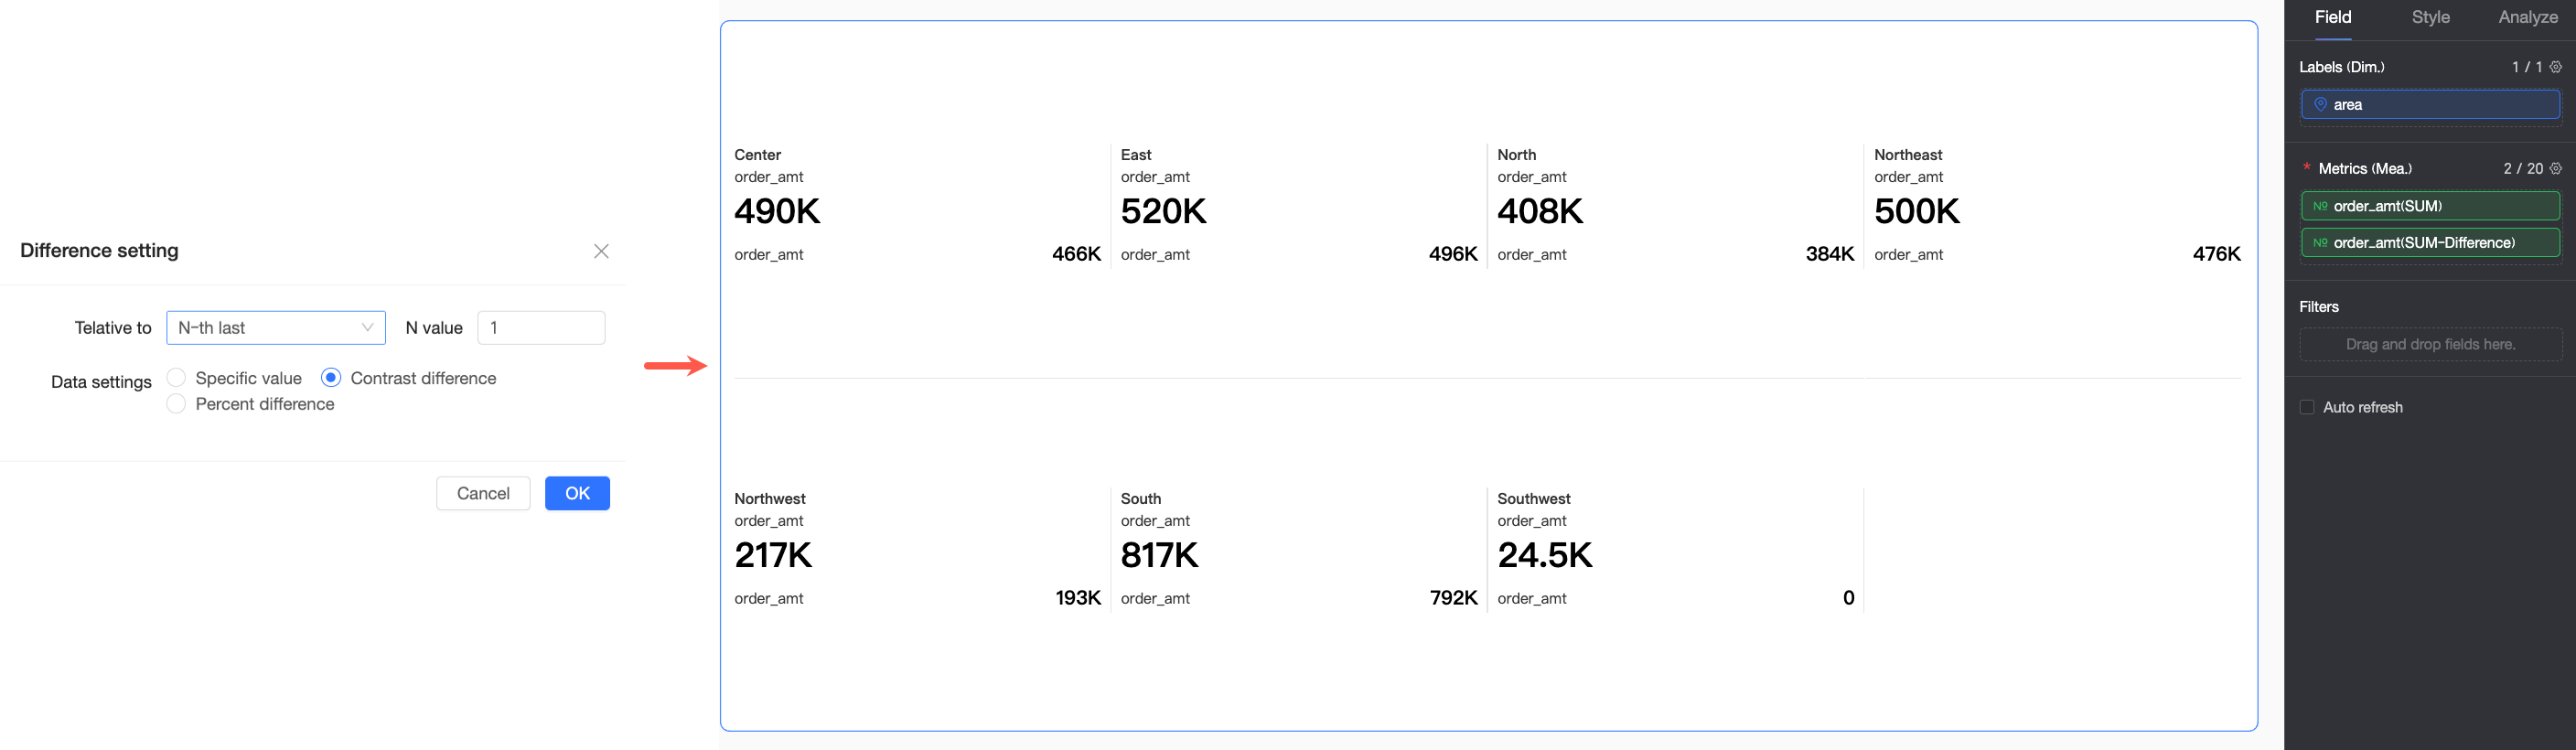
Nth from last
Compare with the Nth data point from the end of the overall data.
The difference between the current data point and the Nth data point from the end of the overall data. For example: the difference between sales in each region and Southwest China sales.
-
Data Settings: Set how the difference values are displayed.
Display type
Description
Example effect
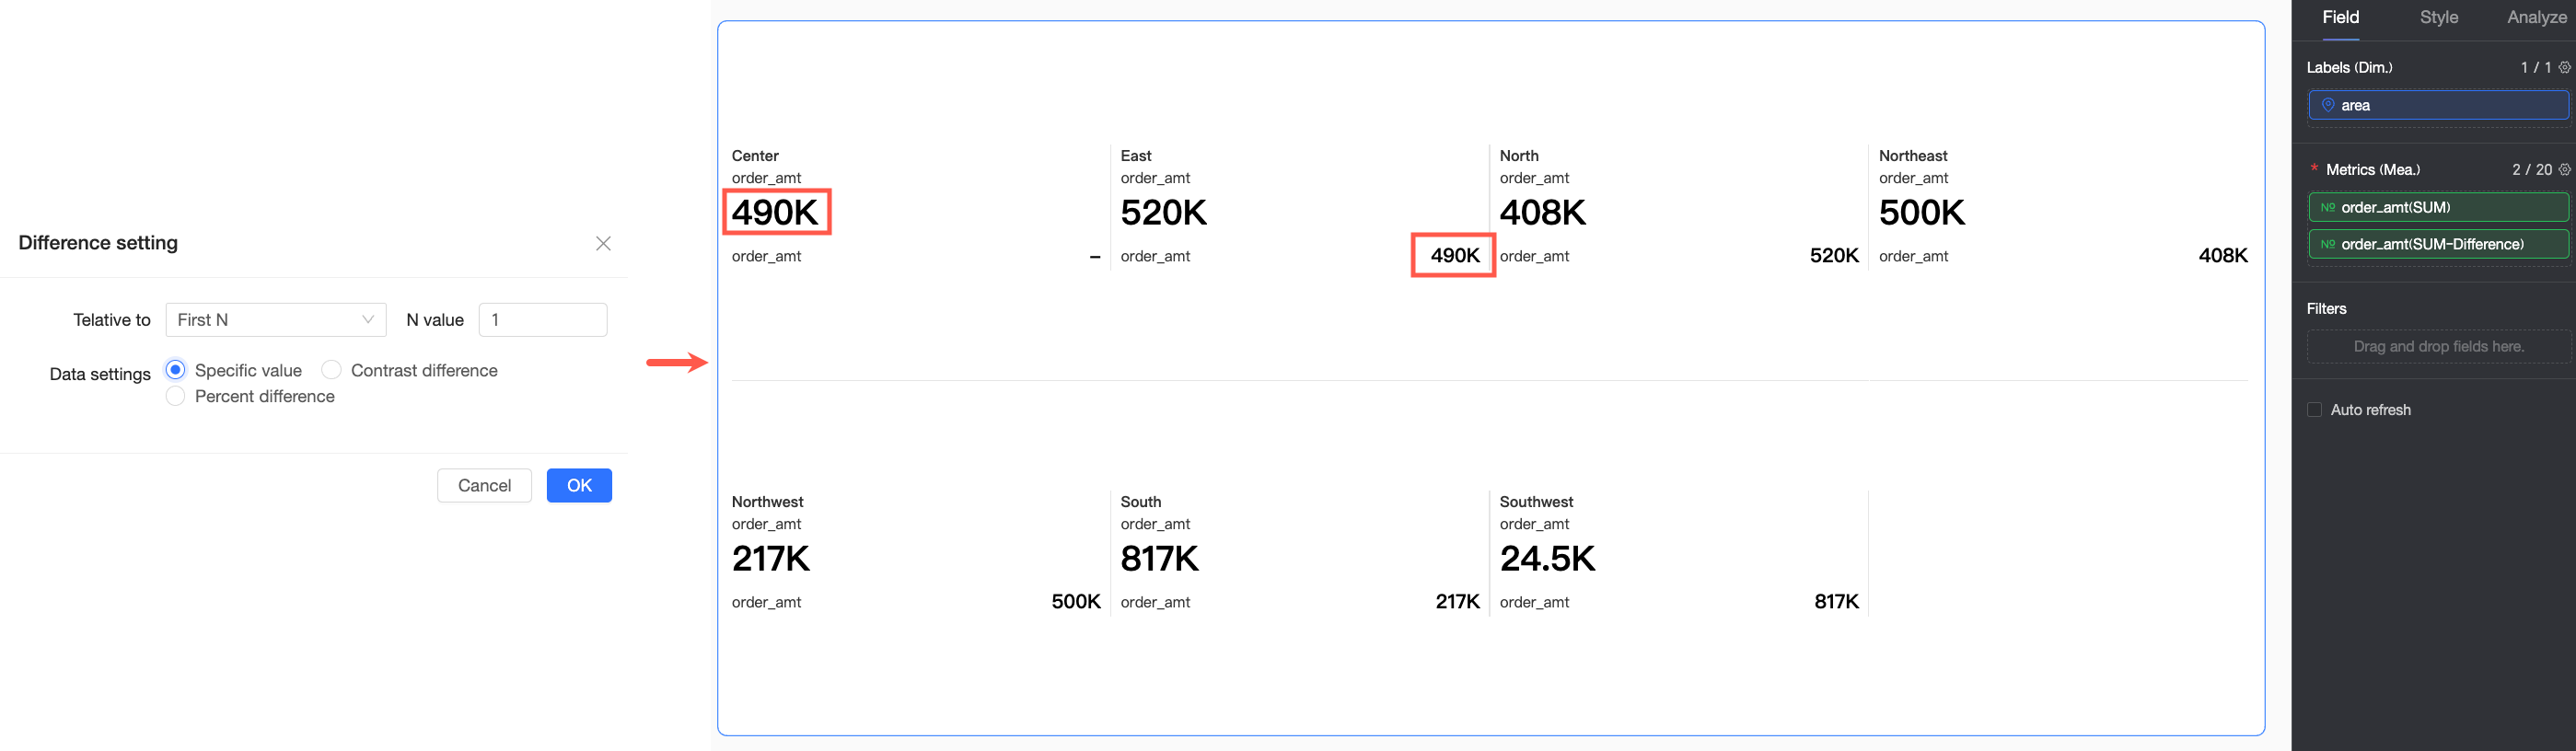
Specific value
Directly display the specific value of the comparison data point.
The comparison data point for East China sales is Northeast China sales, which is 212.6K.
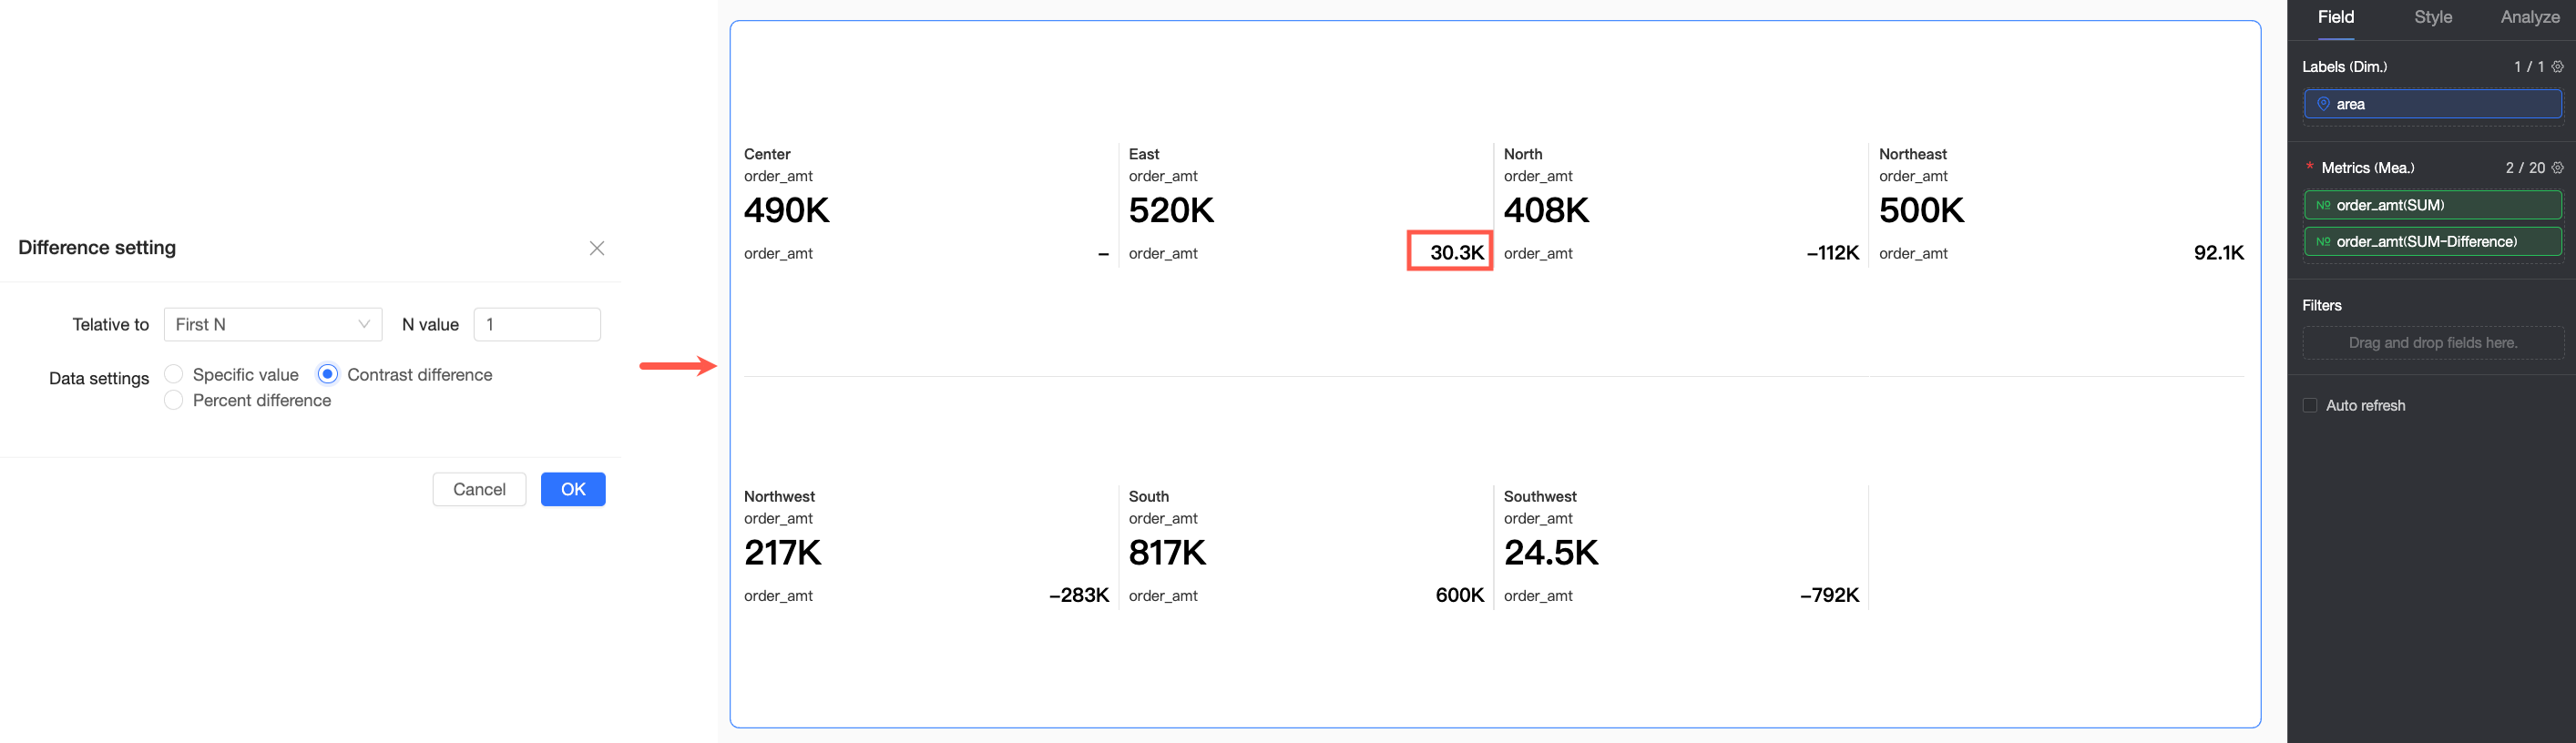
Comparison difference
Display the difference between the current data point and the comparison data point.
The difference between East China sales and Northeast China sales is: 270-212.6=57.39K.
Difference percentage
Display the difference between the current data point and the comparison data point as a percentage, calculated as: (Current data - Comparison data)/Comparison data × 100%.
You can set how the difference percentage is calculated when the comparison data value is less than 0.
-
(1 - Current data/Comparison data) × 100%: Represents the proportion of the difference between current data and comparison data relative to the comparison data. Suitable for measuring the degree of improvement or deterioration of current data relative to comparison data.
-
(Current data/Comparison data - 1) × 100%: Represents the multiple of change of current data relative to comparison data. Suitable for measuring the growth multiple or reduction multiple of current data relative to comparison data.
-
Display as "-": Directly display negative comparison data as "-". Suitable for avoiding calculation results that are difficult to interpret or potentially misleading due to negative comparison data.
The percentage decrease of Central China sales relative to East China sales is 0.568.
-
-
Example 2: Cross table
Cross tables offer additional difference calculation options not available in other charts.
|
Difference calculation type |
Configuration description |
Example effect |
|
Column difference |
This example performs difference calculation on the overall data by column. |
|
|
Within-column group difference |
In this example, the first dimension field in the row area is Region, and the grouping dimension is Province. Therefore, grouping is performed by matching Region and Province fields, and the within-group difference calculation is ultimately performed by the Province dimension. |
|
|
Row difference |
This example performs difference calculation on the overall data by row. |
|
|
Within-row group difference |
In this example, both the first dimension field in the row area and the grouping dimension are Product Type. Therefore, grouping is performed by matching the Product Type field, and difference calculation is performed within each group. |
|