SQL Explorer gives you deep visibility into SQL workload behavior in PolarDB for PostgreSQL. Use it to:
Diagnose slow queries and identify the SQL statements consuming the most resources
Compare SQL performance across two time windows to catch regressions
Audit all DQL, DML, and DDL statements executed against the database
Analyze traffic by source to understand where requests originate
Replay production traffic in a test environment to validate capacity before scaling
SQL Explorer is part of Database Autonomy Service (DAS) and integrates several sub-features under a single interface.
Sub-features
Sub-feature | What it does |
Search (Audit) | Query and export logs of all SQL statements, including database name, status, and execution time |
SQL Explorer | Diagnose SQL health, troubleshoot performance issues, and analyze service traffic |
SQL Review | Analyze the global SQL payload to locate suspicious statements and get optimization recommendations |
Traffic Replay and Stress Testing | Replay production traffic and run stress tests to determine whether the instance type needs scaling |
Security Audit | Automatically detect threats such as SQL injection and new access sources |
Transaction Analysis | View transaction type, count, and details for a specific thread within a time range |
Quick Transaction Analysis | Identify the start and end statements of any transaction that contains a specific SQL statement |
Prerequisites
Before you enable SQL Explorer, make sure that:
DAS Enterprise Edition is enabled for your Alibaba Cloud account. Different Enterprise Edition versions support different regions. For details, see Databases and regions supported by each edition.
(For RAM users) The RAM user has the AliyunPolardbReadOnlyWithSQLLogArchiveAccess permission to use the Search feature. Alternatively, use a custom policy to grant permissions including the export feature. For details, see Use a custom policy to grant a RAM user permissions to use the search and export features in SQL Explorer and Audit.
Performance considerations
SQL Explorer records all DQL, DML, and DDL statements executed on the cluster. Data is collected directly from the database kernel and has minimal CPU overhead.
The storage used by SQL Explorer data is provided by DAS and does not consume storage space on your database instance.
Enabling or disabling the audit log in SQL Explorer and Audit changes the kernel parameter log_statement:Enabling the audit log sets log_statement = all.Disabling the audit log sets log_statement = ddl.Billing
Enterprise Edition V0
SQL Explorer uses pay-as-you-go billing only; subscription billing is not supported. Charges appear under PolarDB in your bill.
Region | Price |
Regions in the Chinese mainland | USD 0.0013 per GB-hour |
China (Hong Kong) and regions outside China | USD 0.0019 per GB-hour |
Enterprise Edition V0 or later
For the latest pricing, see DAS billing.
Enable SQL Explorer
Log on to the PolarDB console.
In the upper-left corner, select the region where your cluster is deployed.
Click the cluster ID.
In the left navigation pane, choose Log And Audit > SQL Explorer.
Enable SQL Explorer. If DAS Enterprise Edition is not yet enabled, follow the on-page instructions to enable it.
Click a tab to view the corresponding information.
Display By Time Range: Select a time range to view the Execution Duration Distribution, Execution Duration, and Executions for all SQL statements. View and export details in the Full Request Statistics section.
Note: The SQL Explorer UI exports up to 1,000 SQL logs. To export more logs over a larger time range, use the Audit feature.
Display By Comparison: Select a time range to compare Execution Duration Distribution, Execution Duration, and Executions across two periods. Comparison results appear in the Requests By Comparison section.
Source Statistics: Select a time range to view all request sources.
Parameters reference
Execution Duration Distribution
The Execution Duration Distribution tab shows how SQL query execution times are distributed over the time range you specify. Statistics are collected every minute, grouped into seven ranges:
Range | Meaning |
| Execution time from 0 ms to 1 ms |
| Execution time greater than 1 ms and up to 2 ms |
| Execution time greater than 2 ms and up to 3 ms |
| Execution time greater than 3 ms and up to 10 ms |
| Execution time greater than 10 ms and up to 100 ms |
| Execution time greater than 0.1 s and up to 1 s |
| Execution time greater than 1 s |
Chart colors indicate cluster health: a larger blue area means healthier execution; larger orange or red areas indicate degraded performance.
Execution Duration
The Execution Duration tab shows execution durations for all SQL queries within the selected time range.
Full Request Statistics
The Full Request Statistics section shows details per SQL template, including:
SQL text
Execution duration percentage
Average execution duration
Execution trend
Execution duration percentage formula:
(Execution duration of the SQL template × Number of executions)
÷ (Total execution duration of all SQL statements × Total executions)
× 100%
A higher percentage means the cluster spends proportionally more resources on that SQL template.
Click an SQL ID to view the performance trend and sample data for statements using that SQL template.
SQL Sample
The SQL Sample tab shows the client that initiated each sampled SQL request. SQL samples are encoded in UTF-8.
Modify the SQL log retention period
Log on to the PolarDB console.
In the upper-left corner, select the region where your cluster is deployed.
Click the cluster ID.
In the left navigation pane, choose Log And Audit > SQL Explorer.
In the upper-right corner of the SQL Explorer page, click Service Settings.
Modify the storage duration and click OK.
If DAS Enterprise Edition V3 is enabled, you can set different retention durations for each sub-feature.
Export SQL log entries
Log on to the PolarDB console.
In the upper-left corner, select the region where your cluster is deployed.
Click the cluster ID.
In the left navigation pane, choose Log And Audit > SQL Explorer.
Click Audit on the right side of the Export tab.
Configure Exported Fields and Export Time Range, then click OK.
In the confirmation dialog, configure Task Name and CSV Separator, then click Confirm To Submit A Task.
After submitting the task:
The task cannot be canceled.
If the task fails, you are not charged.
Task data is retained for 7 days.
Up to 10,000,000 records are exported per task. If the record count exceeds this limit, narrow the time range and resubmit.
It takes about 5 minutes to process and archive the latest data. If you need the most recent data, wait a few minutes before submitting the export.
After the export completes, click Task List in the upper-right corner of the SQL Explorer page, then click Download in the Actions column to download the file.
Disable SQL Explorer
After you disable the SQL Explorer feature, all SQL audit logs are deleted. Before you disable the SQL Explorer and Audit feature, we recommend that you export the SQL audit logs as a file and download the file to your computer. If you enable the SQL Explorer and Audit feature again, SQL audit logs are recorded from the point in time at which the SQL Explorer and Audit feature is enabled.
Log on to the PolarDB console.
In the upper-left corner, select the region where your cluster is deployed.
Click the cluster ID.
In the left navigation pane, choose Log And Audit > SQL Explorer.
Click Service Settings.
If DAS Enterprise Edition V3 is enabled, clear all features under the SQL Explorer and Audit module, then click Submit.
Otherwise, disable the SQL Explorer and Audit feature.
Confirm the prompt and click Submit And Unsubscribe.
Storage used by SQL Explorer and Audit data is released approximately one hour after the feature is disabled.
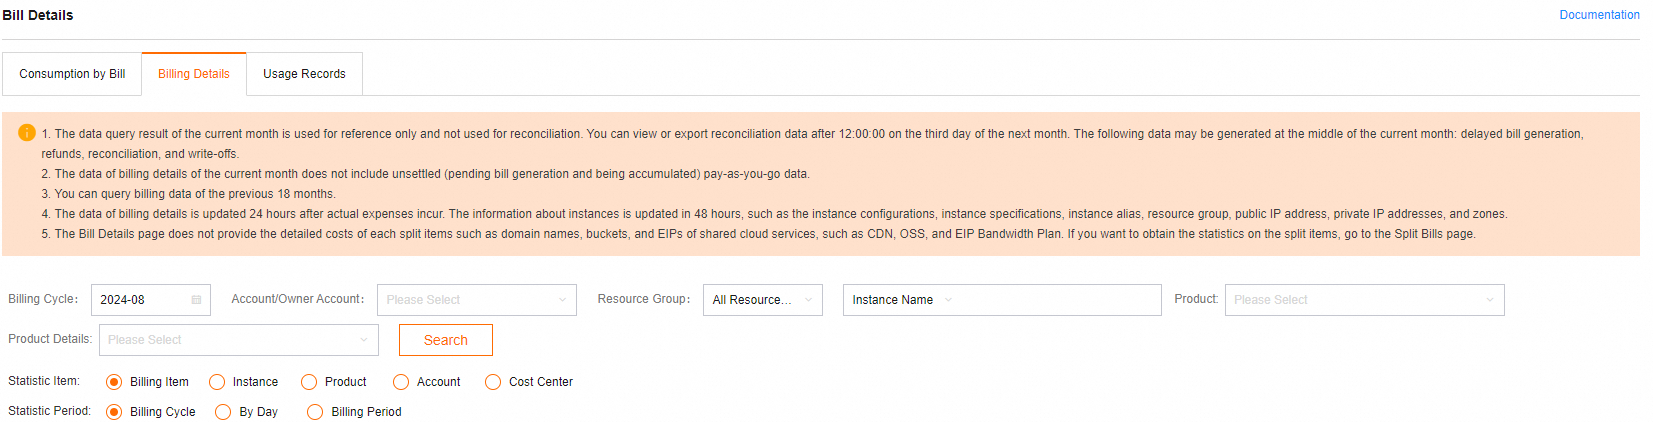
View audit log size and billing details
Log on to the Alibaba Cloud Management Console. In the upper-right corner, click Expenses.
In the left navigation bar of the Expenses And Costs page, go to Billing Management > Bill Details.
On the Bill Details tab, click Billing Details and search by Instance ID. Filter results where the Billing Item column shows sql_explorer.
What's next
Audit (Search) — Query and export full SQL audit logs
SQL Explorer — Deep-dive into SQL health and traffic analysis
SQL Review — Analyze global SQL payload for optimization opportunities
Traffic Replay and Stress Testing — Validate capacity before scaling
Security Audit — Detect SQL injection and access anomalies
Transaction Analysis — Analyze transactions by thread and time range
Quick Transaction Analysis — Trace transaction boundaries for a specific SQL statement