SQL Review analyzes the SQL workload on a database instance across two time windows—a diagnostic period and a baseline period—and surfaces optimization opportunities you can act on directly from the console. Use it for routine health checks, post-release validation, or investigating a sudden performance regression.
Prerequisites
Before you begin, make sure that:
The database instance is connected to DAS and in the Normal Access state
SQL Explorer and Audit is enabled for the instance. For details, see the Enable SQL Explorer and Audit section in "Overview"
Supported databases and regions
SQL Explorer and Audit is available in two versions. The new version uses a combination of hot storage and cold storage, which reduces costs compared to the previous version.
For differences between the two versions, see the What are the differences between the new and previous versions of SQL Explorer and Audit? section in "FAQ."
Instances in the China (Heyuan) and China (Ulanqab) regions do not support migration from DAS Enterprise Edition V1 to DAS Enterprise Edition V2.
Instances in China (Qingdao), China (Guangzhou), China (Zhangjiakou), China (Hong Kong), and Singapore support migration only for data stored for no more than 30 days. To migrate data stored for more than 30 days, modify the storage duration before migrating. See the Modify the storage duration of data generated by SQL Explorer and Audit section in "Overview." Reducing the storage duration causes DAS to immediately delete data stored beyond the new limit. Proceed with caution.
| Version | Database | Regions |
|---|---|---|
| New version | ApsaraDB RDS for MySQL, PolarDB for MySQL | China (Hangzhou), China (Shanghai), China (Qingdao), China (Beijing), China (Shenzhen), China (Guangzhou), China (Heyuan), China (Zhangjiakou), China (Ulanqab), China (Hong Kong), Singapore |
| Previous version | ApsaraDB RDS for MySQL, ApsaraDB RDS for SQL Server, PolarDB for MySQL | China (Hangzhou), China (Shanghai), China (Qingdao), China (Beijing), China (Shenzhen), China (Zhangjiakou), China (Hohhot), China (Chengdu), China (Guangzhou), China (Heyuan), China (Ulanqab), China (Hong Kong), Singapore, Malaysia (Kuala Lumpur), Indonesia (Jakarta) |
| Previous version | ApsaraDB RDS for PostgreSQL | China (Hangzhou), China (Shanghai), China (Beijing), China (Shenzhen), China (Zhangjiakou), Singapore, Malaysia (Kuala Lumpur), Indonesia (Jakarta) |
| Previous version | PolarDB-X 2.0 | China (Hangzhou), China (Shanghai), China (Beijing), China (Shenzhen), Singapore |
How it works
SQL Review compares SQL execution data from two time ranges you define:
Diagnostics time range: the period to analyze (1 hour to 8 days).
Comparison time range: the baseline period of equal length, ending before the diagnostic period starts.
After the analysis completes, SQL Review generates results across up to nine diagnostic modules. Each module focuses on a specific signal—resource consumption, execution failures, new statements, performance trends, and so on.
Diagnostic modules
SQL Review provides nine modules. For a first-time analysis, a routine health check, or post-release validation, start with Index Optimization Suggestions, Top SQL, and Failed SQL—these three cover the most common sources of performance issues. Use the remaining modules to investigate specific signals.
| Module | What it shows |
|---|---|
| Index Optimization Suggestions | Missing or improvable indexes, the DDL statements to apply them, and the expected benefit |
| SQL Rewrite Suggestions | Inefficient SQL statements and rewrite suggestions to improve execution |
| Top SQL | Top 10 statements by resource consumption, average scanned rows, or total executions |
| Added SQL | Statements that appear in the diagnostic period but not in the baseline period |
| Failed SQL | Statements that failed, with SQL ID, sample, database, error code, and error count |
| SQL Feature Analysis | Execution statistics grouped by SQL type (SELECT, INSERT, UPDATE, DELETE, and so on) |
| SQL with Execution Variation | Statements with significant changes in scanned rows or execution count between the two periods |
| SQL with Deteriorated Performance | Statements whose average scanned rows, execution count, or execution duration exceeded a defined change rate |
| Top Tables by Traffic | Top 100 tables by traffic, with per-table counts for SELECT, INSERT, UPDATE, and DELETE statements |
Run an SQL review
Create a review task
Log on to the DAS console.
In the left-side navigation pane, click Instance Monitoring.
Find the instance and click its ID to open the instance details page.
In the left-side navigation pane, choose Request Analysis > SQL Explorer and Audit. Click the SQL Explorer tab, then click the SQL Review tab.
Click Create SQL Review.
In the Create SQL Review panel, configure the following parameters and click OK.
| Parameter | Description |
|---|---|
| SQL Review Name | A name for the task. |
| Select database | The database within the instance to analyze. |
| Diagnostics Time Range | The time range to analyze. Must fall after DAS Enterprise Edition was enabled and within the SQL Explorer data storage duration. The minimum range is 1 hour; the maximum is 8 days. For accurate results, use a range of at least 24 hours. SQL statements executed at the same time cannot be reviewed more than once. |
| Comparison time range | The baseline time range. Must be the same length as the diagnostic time range, must not overlap with it, and must end before the diagnostic period starts. Must also fall after DAS Enterprise Edition was enabled and within the SQL Explorer storage duration. |
| Diagnostic content | The modules to include. Select one or more. For a first-time analysis or routine check, start with Index Optimization Suggestions, TOP SQL, and Failed SQL. |
View and manage review tasks
In the upper-right corner of the SQL Review tab, select a time range and click Search to list the tasks created within that range.
For each task, the Actions column provides the following options:
Details: Open the task results. See Review the results.
Download: Save the results to your local machine.
Share: Share the results with users who have DAS console access.
Click the (+) icon before a task name to expand the subtasks and view each subtask's status. Click Details in a subtask row to view that subtask's results.
Review the results
Open a task and click Details to view the results. The Overview tab gives a summary across all modules. Switch to a specific module tab to investigate further.
A recommended diagnostic workflow:
Check Top SQL to identify statements consuming the most resources or running most frequently.
Check Failed SQL to catch execution errors that may affect application reliability.
Check Index Optimization Suggestions and apply or verify the recommended DDL changes.
If the workload changed recently (after a deployment or code release), check Added SQL for new statements that may be causing regressions.
For statements flagged in SQL with Execution Variation, drill into SQL with Deteriorated Performance to focus on those with measurable regression.

Index optimization suggestions
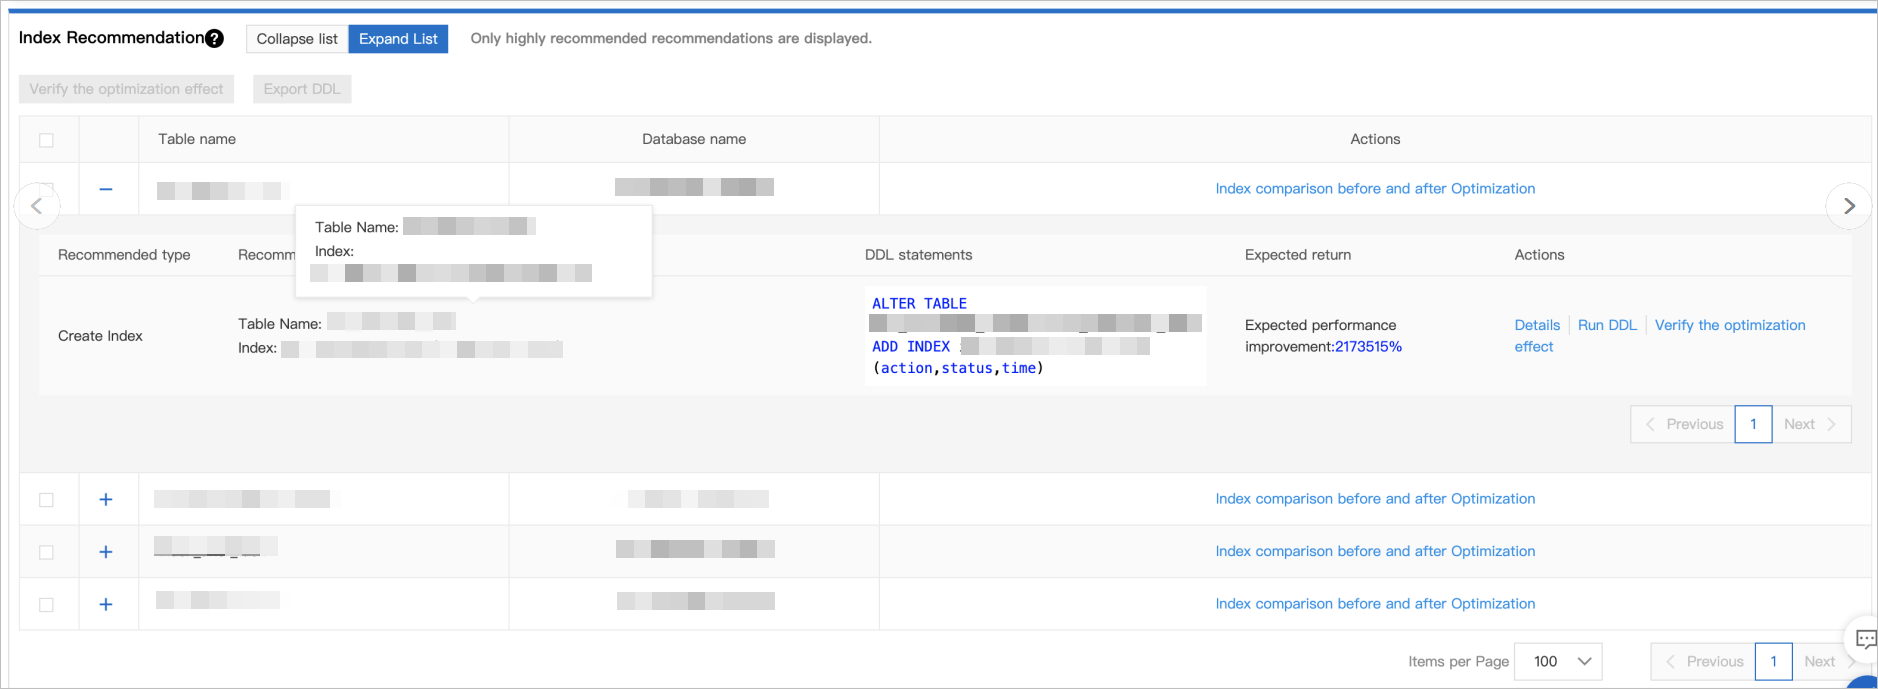
Click the (+) icon before a table name to expand the index suggestions for that table. Each suggestion shows the Suggestion Details, DDL Statements, and Expected Return columns.

From here, you can:
Click Details to read the full suggestion.
Click Run DDL to apply the suggested index change.
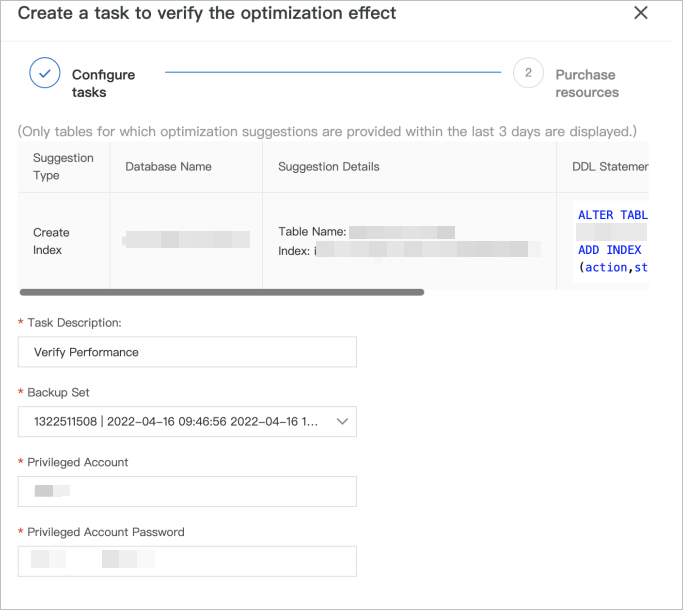
Click Verify Optimization Improvement to validate the suggestion in an isolated environment before applying it to the original instance.

SQL rewrite suggestions
This tab lists SQL statements flagged as inefficiently executed, along with rewrite suggestions.
Click Optimize in the Actions column to open the SQL Diagnostic Optimization page, where you can review the optimized statement, its execution plan, and diagnostic details.
If you accept the suggestion, click Copy in the upper-right corner and paste the optimized statement into your database client or Data Management (DMS) for execution. Click Cancel to discard the suggestion.

Top SQL
This tab shows three ranked lists: Top 10 Resource-consuming SQL Statements, Top 10 SQL Statements with Maximum Average Number of Scanned Rows, and Top 10 Most Frequently Executed SQL Statements.
If a statement appears near the top of multiple lists, it is a significant contributor to database load and worth optimizing first.
Click an SQL ID to view the statement details.
Click Optimize to open the SQL Diagnostic Optimization page. Accept the suggestion by clicking Copy and pasting the statement into your database client or DMS, or click Cancel to discard it.

Added SQL
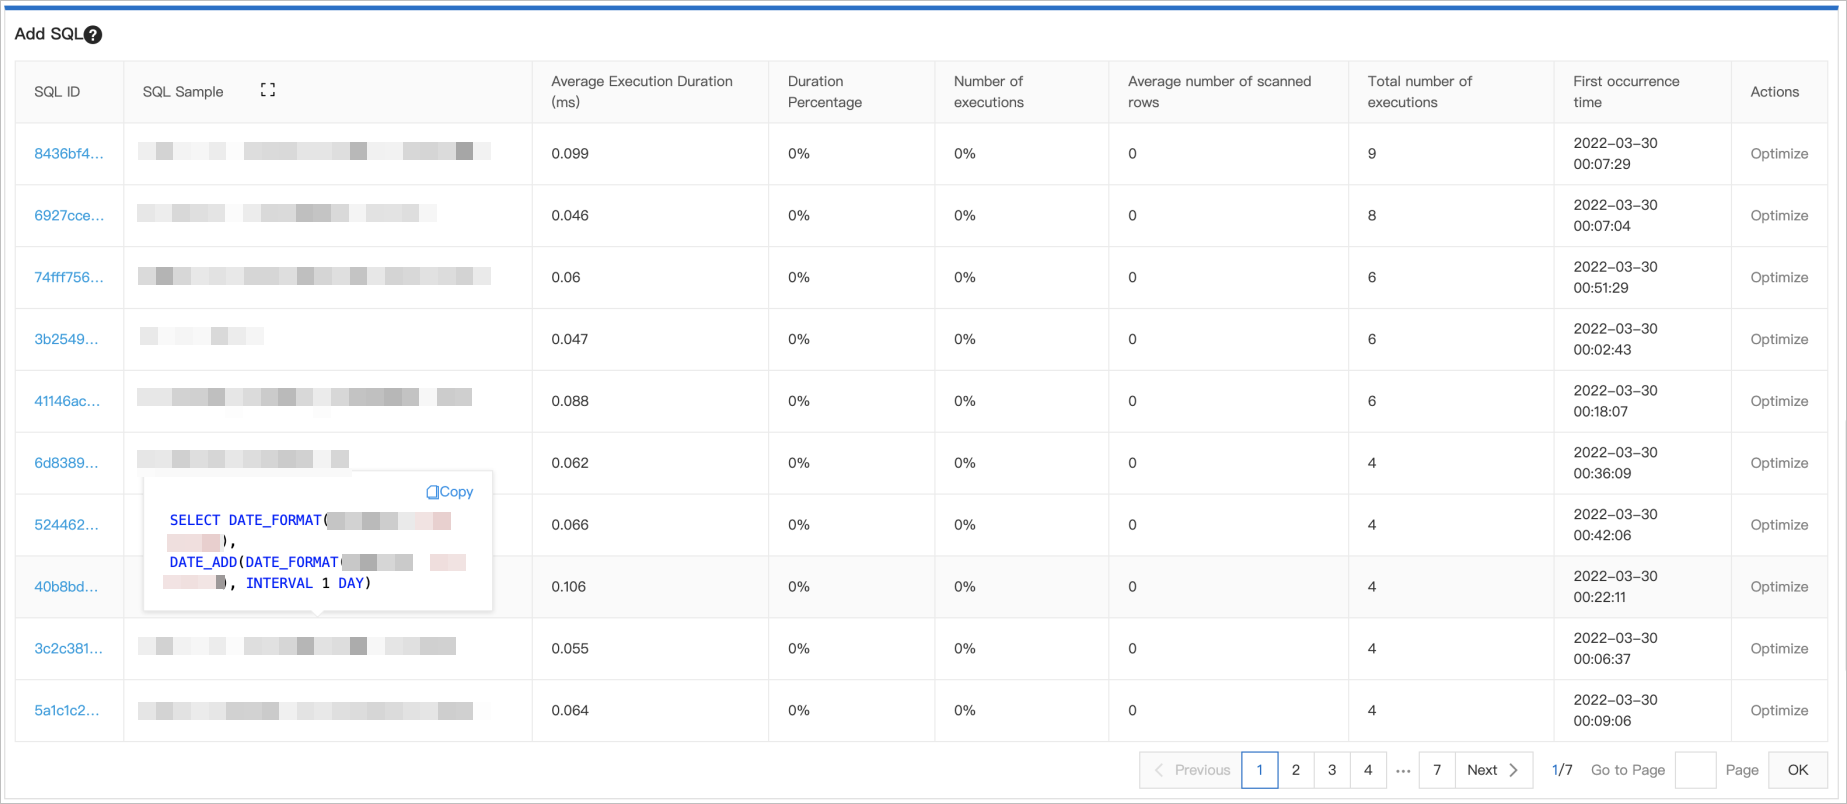
This tab shows statements that appear in the diagnostic period but not in the baseline period. Use this to verify that new SQL introduced by a deployment or code change is behaving as expected.
Click an SQL ID to view the statement details.
Click Optimize to open the SQL Diagnostic Optimization page and review optimization suggestions.

Failed SQL
This tab lists statements that failed during the diagnostic period, with the SQL ID, SQL sample, database, error code, and number of failures.
Click an SQL ID to view the statement details.

SQL feature analysis
This tab breaks down all SQL statements by type and shows the number of SQL templates for each type.
Click Number of SQL Templates to open the SQL Template Details page. From there, click an SQL ID to view the statement details.

SQL with execution variation
This tab groups statements by change intervals based on scanned rows and execution count, showing how the workload distribution shifted between the two time periods.
Click Details to open the Execution Trend Details page. From there:
Click an SQL ID to view the statement details.
Click Optimize to open the SQL Diagnostic Optimization page and review optimization suggestions.

SQL with deteriorated performance
This tab lists statements from the SQL with Execution Variation results whose average scanned rows, total executions, or average execution duration exceeded the defined change rate threshold. These statements show measurable regression compared to the baseline and warrant attention.
Click an SQL ID to view the statement details.
Click Optimize to open the SQL Diagnostic Optimization page and review optimization suggestions.

Top tables by traffic
This tab lists the top 100 tables by traffic in the database. For each table, it shows the table name, database name, number of SQL templates, total executions, and counts for SELECT, INSERT, UPDATE, and DELETE statements, along with average execution duration.
Click a table name to view its fields and indexes.
Click Related SQL Statements to see all SQL statements associated with that table.
