Enable distributed tracing to monitor LLM application performance, visualize call chains, and identify bottlenecks.
Overview
EAS integrates with ARMS to add observability to LLM applications, enabling you to trace call chains, identify performance bottlenecks, and surface errors.
Tracing provides:
-
Call chain visualization: Maps the full request path with clear logs.
-
Performance monitoring: Tracks response time, token consumption, and error counts to identify bottlenecks.
-
Issue identification: Pinpoints issues via Trace IDs with contextual root-cause analysis.
-
Evaluation: Validates accuracy and reliability of LLM outputs using trace data.
Key concepts
-
Trace
The complete execution path of a request in a distributed system, composed of multiple spans. Each trace has a unique TraceID for tracking request flows and pinpointing bottlenecks or errors.
-
Span
A basic unit in a trace representing a specific operation. Records operation name, start time, and end time.
-
Python probe
Automatically collects call chain data and performance metrics from Python applications. Install a Python probe when deploying an EAS service to enable tracing.
-
Evaluation
Assesses LLM application answers across multiple dimensions. Contact your business manager to confirm specific evaluation dimension names.
Limitations
This feature supports only Python-based LLM applications developed with LangChain, LlamaIndex, or DashScope.
Prerequisites
-
Activate ARMS Application Monitoring. For more information, see Activate ARMS.
-
Activate LangStudio by following Authorize the PAI service account.
-
If using a Resource Access Management (RAM) user or RAM role, grant the
AliyunPAILLMTraceFullAccesspermission to the user or role. For more information, see Manage permissions for a RAM role and Manage RAM user permissions.
Step 1: Prepare sample code
This walkthrough uses a simple prediction service to demonstrate deployment, invocation, and trace viewing.
This example uses the DashScope API with Flask to build a web service that calls Generation.call for text generation. Activate DashScope and obtain an API key as described in Call the Tongyi Qianwen API for the first time. Set DASHSCOPE_API_KEY as an environment variable when deploying the service. Example app.py:
import os
import json
import flask
import dashscope

app = flask.Flask(__name__)

def run_query(query):
    """Run a query."""

    response = dashscope.Generation.call(
        api_key=os.getenv('DASHSCOPE_API_KEY'),
        model="qwen-plus",
        messages=[
            {'role': 'system', 'content': 'You are a helpful assistant.'},
            {'role': 'user', 'content': query}
        ],
        result_format='message'
    )
    return response


@app.route('/api/trace_demo', methods=['POST'])
def query():
    """
    Post data example:
    {
        "query": "capital of china"
    }
    """
    data = flask.request.get_data("utf-8")
    query = json.loads(data).get('query', '')
    response = run_query(query)
    return response.output.choices[0].message.content


if __name__ == '__main__':
    app.run(host='0.0.0.0', port=8000)
Step 2: Enable tracing
When deploying an EAS service, turn on Tracing in Service Features. If your image lacks a built-in tracing component, configure the probe installation and startup commands. Manually install a Python probe.
-
Image with built-in tracing: Turn on Tracing. No additional configuration required.
-
Image without built-in tracing: Turn on Tracing and configure third-party libraries and the startup command.
Parameter
Description
Command to Run
Add
aliyun-bootstrap -a install && aliyun-instrument python app.py. This installs and starts the ARMS Python probe. app.py is the main prediction service file. Also add aliyun-bootstrap to third-party libraries for the probe installer.Third-party Library Settings
Add
aliyun-bootstrapto download the probe installer from PyPI.

This example uses an image without built-in tracing. Key deployment parameters are listed below. Deploy a service in the console. After deployment:
-
View the service deployment status on the EAS page.
-
View the registered application on the Application List page in the ARMS console. The application name is the same as the EAS service name.
|
Parameter |
Description |
|
|
Environment Information |
Deployment Method |
Select Image-based Deployment. |
|
Image Configuration |
This topic uses the default image: . You can also enter a prepared custom image on the Image Address tab. |
|
|
Directly Mount |
Mount the sample code to the service instance. For this example, click OSS and configure:
Skip this step if your custom image already includes the prediction service file. |
|
|
Command |
This topic sets the command to |
|
|
Environment Variables |
The sample code calls the DashScope API. Click Add and add this environment variable:
|
|
|
Third-party Library Settings |
Set the third-party libraries to |
|
|
Service Access |
VPC |
To use the tracing feature, you must configure a virtual private cloud (VPC). Select a VPC, vSwitch, and Security group in the region. EAS services cannot access the Internet by default. The sample code requires Internet access for DashScope API calls. Configure access following Scenario 1: Allow an EAS service to access the Internet. |
|
vSwitch |
||
|
Security Group Name |
||
|
Features |
Tracing Analysis |
Turn on the Tracing switch and configure the third-party libraries and startup command in the Environment Context section. |
Step 3: View traces
An evaluation tool based on traces helps developers verify the accuracy and reliability of LLM application outputs:
Call the EAS service
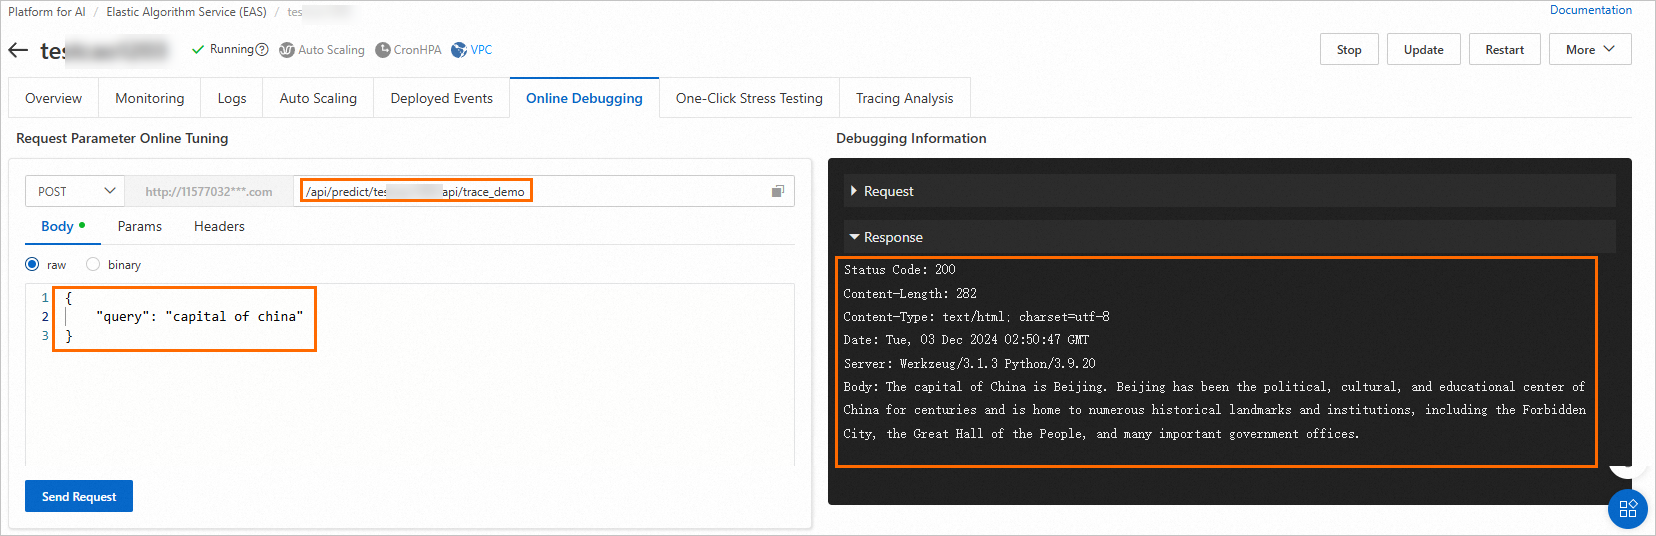
This example uses online debugging. You can also invoke the service via API calls.
-
On the Elastic Algorithm Service (EAS) page, find the target service and click
 > Online Debugging in the Actions column.
 -
On the Body tab, send request data to the specified address based on your defined prediction service.
This topic uses the service interface defined in the sample app.py file. The following figure shows an example result:
View trace information
By default, trace data is stored for 30 days from the time it is generated. To extend the storage period, contact the ARMS team for custom configuration.
-
Switch to the Trace Query tab on the Tracing Analysis tab to view trace information.

-
Find the target trace and click View Traces in the Actions column to go to the Trace details page.
View the service input, output, and log details on this page.
Note: If you use a RAM user or a RAM role, you must grant the
AliyunARMSReadOnlyAccesspermission to use this feature.
-
To share trace details, click the share icon
 to generate a one-time address.
Note: If you use a RAM user or a RAM role, you must grant the
cms:CreateTicketpermission before you can use this feature.
Step 4: Evaluate application performance
EAS supports two trace-based evaluation methods:
-
Method 1: Evaluate a single trace: Manually select a trace from the EAS service for evaluation. Suitable for the development or testing phase to debug a specific trace and verify its logic and performance.
-
Method 2: Evaluate traces in batches online: Periodically evaluate sampled traces from the running EAS service. Suitable for large-scale performance testing or feature validation to understand overall system status.
By default, trace data is stored for 30 days from the time it is generated. To extend the storage period, contact the ARMS team for custom configuration.
Method 1: Evaluate a single trace
-
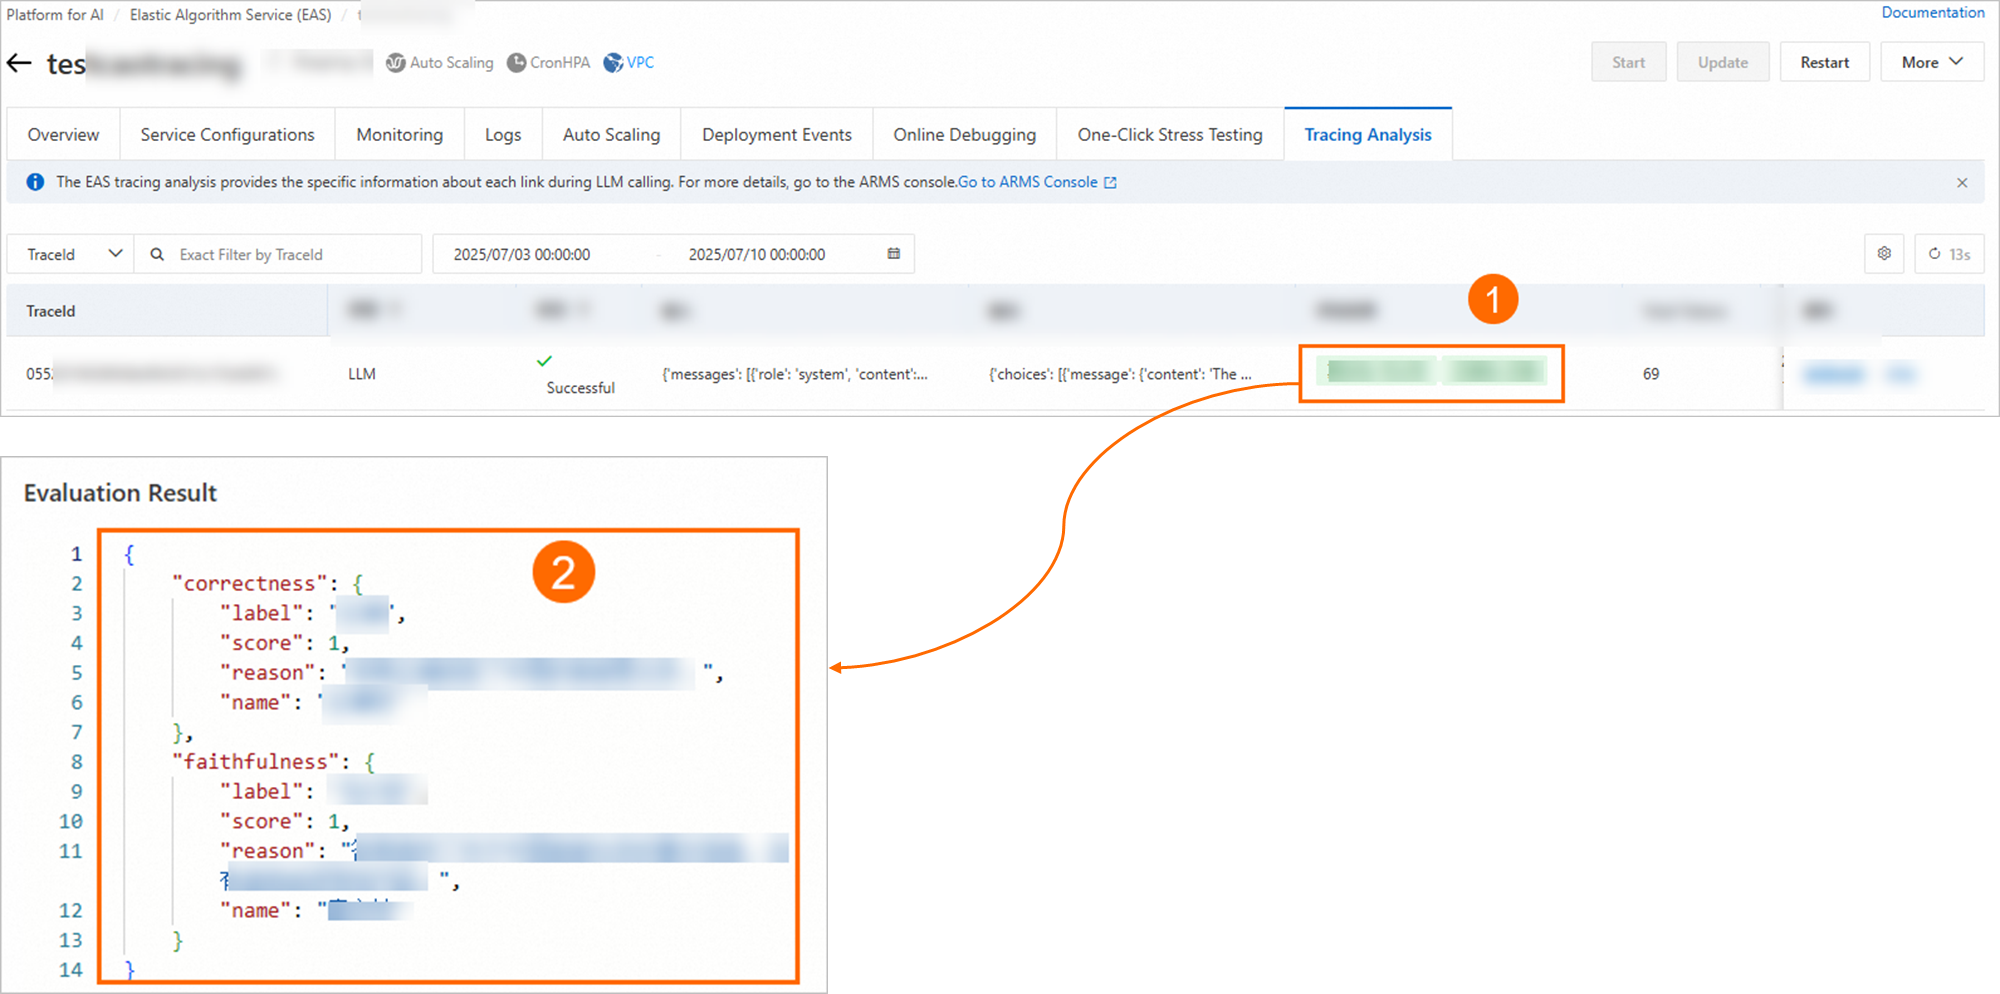
On the Trace Query tab of the Tracing Analysis tab, find the target trace and click Evaluate in the Actions column. Then, in the Evaluate configuration panel, configure the following parameters.

-
Evaluation Metrics: This is a fixed configuration and cannot be changed. The evaluation is performed based on the following dimensions.
Evaluation Metric
Description
Correctness
Determines whether the answer correctly addresses the question based on the input and reference text.
Faithfulness
Determines whether the answer is generated based on the input and reference text and whether it contains hallucinations.
Retrieval Relevance
Determines whether the retrieved results are relevant to the input question. It includes the following four metrics:
-
nDCG: Normalized Discounted Cumulative Gain
-
Hit Rate
-
Precision@K
-
MRR: Mean Reciprocal Rank
-
-
Model Settings: The LLM used to evaluate the trace. After initial setup, this configuration is automatically backfilled for subsequent evaluations.
Parameter
Description
Model Selection
The following two models are supported:
-
PAI Judge Model
-
qwen-max (Model Studio model)
Note-
To use a Model Studio model, configure an Internet connection for EAS.
-
Model Studio model calls are billed separately. Billing.
-
Model Token
Enter the token for the selected model:
-
Judge model: Go to the Judge Model page, activate the PAI judge model, and obtain a token.
-
qwen-max: Obtain a token from Call the Tongyi Qianwen API for the first time.
-
-
Extraction Configuration: In the Query Extraction Configuration, Answer Extraction Configuration, and Context Extraction Configuration sections, configure the parameters in the following table to extract the corresponding content:
-
Query Extraction Configuration: Extracts the user query content (input).
-
Answer Extraction Configuration: Extracts the system-generated answer (output).
-
Context Extraction Configuration: Extracts the text or background information provided to the system (documents).
Parameter
Description
SpanName
Finds a span that matches the SpanName.
JsonPathInSpan
The format is a.b.c. This parameter cannot be empty. It extracts a value from a specified element of the matched span.
JsonPathInSpanValue
The format is a.b.c. This parameter can be empty. After the element corresponding to JsonPathInSpan is found, if the element's content is a JSON string, JsonPathInSpanValue is used to extract the corresponding value.
You can click View Traces in the Actions column to obtain the configuration content from the Trace details page. The following table shows configuration examples:
Extraction Configuration
How to obtain
Example value
Query Extraction Configuration
This topic provides an example where JsonPathInSpanValue has no value:

For an example where JsonPathInSpanValue has a value, see the following figure.

-
JsonPathInSpanValue has no value
-
SpanName: LLM
-
JsonPathInSpan: attributes.input.value
-
JsonPathInSpanValue: Because the content of the JsonPathInSpan element is not a JSON string, this parameter is empty.
-
-
JsonPathInSpanValue has a value
-
SpanName: LLM
-
JsonPathInSpan:
attributes.input.value -
JsonPathInSpanValue: Because the content of the JsonPathInSpan element is a JSON string, enter
text[0]here.
-
Answer Extraction Configuration

-
SpanName: LLM
-
JsonPathInSpan:
attributes.output.value -
JsonPathInSpanValue: This parameter is empty.
Context Extraction Configuration
The sample service in this topic does not include a context extraction configuration. For an example, see the following figure:

-
SpanName: retrieve
-
JsonPathInSpan:
attributes.retrieval.documents[*].document.contentImportantOnly the context configuration supports using an asterisk (*).
-
JsonPathInSpanValue: Because the content of the JsonPathInSpan element is not a JSON string, this parameter is empty.
-
-
-
After you configure the parameters, click Confirm.
When a result appears in the Evaluation Result column (as shown in the following figure), the evaluation is complete. Click the result to view its details.
Method 2: Evaluate traces in batches online
-
On the Online Evaluation tab of the Tracing Analysis tab, click New Assessment.
-
On the Create Evaluation Task page, configure the following parameters and then click Confirm.
Parameter
Description
Basic Configuration
Task Name
Enter a custom task name.
Evaluation Configuration
Evaluation Metrics
This is a fixed configuration and cannot be changed. The evaluation is performed based on the following dimensions:
-
Correctness: Determines whether the answer correctly addresses the question based on the input and reference text.
-
Faithfulness: Determines whether the answer is generated based on the input and reference text and whether it contains hallucinations.
-
Retrieval Relevance: Determines whether the retrieved content is relevant to the input question. It includes the following four metrics:
-
nDCG: Normalized Discounted Cumulative Gain
-
Hit Rate
-
Precision@K
-
MRR: Mean Reciprocal Rank
-
Model Selection
The following two models are supported:
-
PAI Judge Model
-
qwen-max (Model Studio model)
Note-
To use a Model Studio model, configure an Internet connection for EAS.
-
Model Studio model calls are billed separately. Billing.
-
Model Token
Enter the token for the selected model:
-
Judge model: Go to the Judge Model page, activate the PAI judge model, and obtain a token.
-
qwen-max: Obtain a token from Call the Tongyi Qianwen API for the first time.
Sampling Start and End Time
Select the start and end dates for sampling.
Sampling Policy
The following sampling policies are available:
-
Time window-based sampling: Captures one trace at regular intervals (every x minutes).
-
Probability-based sampling: Randomly captures a specified percentage of traces.
QCA Extraction Configuration: Trace data is formatted as a JSON string. The QCA extraction configuration defines the path to the QCA within this JSON structure. The value at this path represents the specific QCA content.
Query Extraction Configuration
-
Query Extraction Configuration: Extracts the user query content (input).
-
Answer Extraction Configuration: Extracts the system-generated answer (output).
-
Context Extraction Configuration: Extracts the text or background information provided to the system (documents).
Configure SpanName, JsonPathInSpan, and JsonPathInSpanValue to extract the corresponding content. Configuration details: Extraction Configuration.
Answer Extraction Configuration
Context Extraction Configuration
When the task Status shows Completed, all evaluations are finished and no new results will be generated.
-
-
After the evaluation is complete, you can view the results in the Evaluation Result column of the evaluation task. You can also click the task name to view its details.
-
View evaluation results: The system calculates and displays the average score from all successful evaluations. A score closer to 1 indicates higher quality.

-
View evaluation details:

-
After creation, manage the task by updating, stopping, deleting, or cloning it. Cloning duplicates the configuration into a new task.