The cache hit rate alone cannot indicate whether the cache capacity of an OSS accelerator is appropriate when the cache hit rate is lower than expected or when you evaluate opportunities to reduce the capacity. A cache heatmap shows the access and space distributions of cached data and helps you determine whether to adjust the cache capacity of the accelerator.
Cache heatmap monitoring is in invitational preview. To use this feature, submit a ticket to request access.
Feature overview
To determine whether to adjust the cache capacity of an accelerator, check the following information together:
OSS accelerator cache hit rate (cache hit rate): indicates the acceleration effectiveness of the current cache.
OSS accelerator cache space utilization (space utilization): the percentage of the total used capacity occupied by each
segsegment in the cache heatmap.Cache heatmap: shows the access traffic distribution within the selected time range and a snapshot of the space distribution of cached data at query time. This information explains why the cache hit rate is high or low.
The cache hit rate measures acceleration effectiveness, the cache heatmap explains access patterns, and space utilization indicates the percentage of cached space occupied by each seg segment. Together, these metrics help you determine whether the current cache capacity is appropriate:
When the cache hit rate is low: If a small portion of cached data receives most of the access traffic, the workload has clear access hotspots and increasing the capacity may improve the cache hit rate. If the access traffic distribution is similar to the space usage distribution, the workload is typically dominated by random access. Evaluate the benefits before you increase the capacity.
When the cache hit rate remains high: Check the space utilization and the access traffic and space usage of the least recently accessed data to determine whether the capacity can be reduced. Use the measured relationship between cache capacity and cache hit rate to assess the impact of a capacity reduction.
For information about how to access and query cache heatmaps in the console, see Monitor accelerators.
Chart description
On the monitoring page of an OSS accelerator, you can view the cache heatmap in the Cache Heatmap Monitoring card.
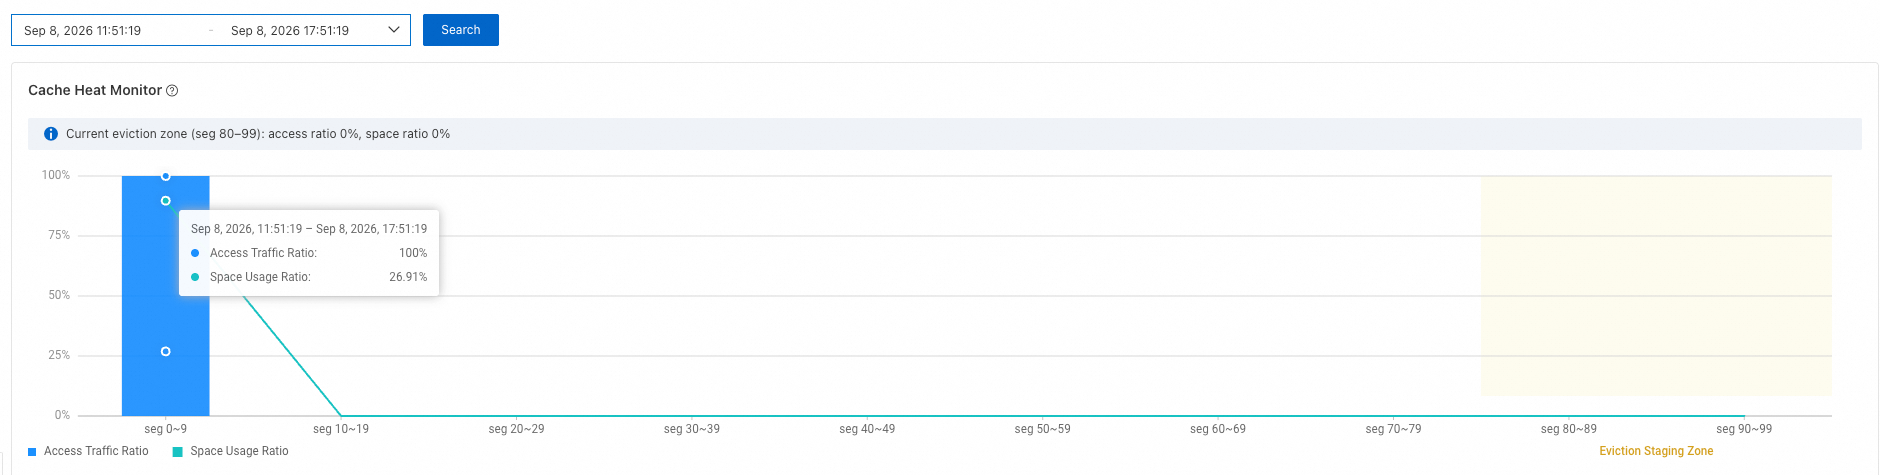
The horizontal axis represents the order in which cached data was last accessed, not chronological time. From left to right, the data changes from most recently accessed to least recently accessed. Based on this order, the system evenly divides the cached data into 10 segments, from seg 0~9 through seg 90~99:
seg 0~9is on the far left of the chart and represents the most recently accessed data.seg 90~99is on the far right of the chart and represents the least recently accessed data.
This topic refers to the access order as relative age. Relative age changes as cache access activity continues. It is neither the object creation time nor the duration for which an object has been cached, and cannot be converted into a fixed number of minutes or hours. For example, data in seg 90~99 may have remained unaccessed for only a few minutes on a busy instance with high QPS, but for several hours on an idle instance. Relative age indicates only the access order of cached data in the current chart. Do not directly compare the same seg across different time periods of the same instance or across different instances, or interpret it as the same length of time.
After the cache of an OSS accelerator becomes full, the least recently accessed data is evicted first when new data needs to be cached. Therefore, this topic refers to seg 80~99 as the eviction preparation zone. The banner at the top of the console abbreviates this term as the eviction zone.
The Cache Heatmap Monitoring card contains the following elements.
Card element | Description | Value type |
Time range | Specifies the period for which access traffic is collected. | Affects the access traffic ratio. The space usage ratio remains a point-in-time snapshot. |
Eviction zone banner | Displays the aggregate access and space ratios for the eviction preparation zone ( | Key statistics for the selected time range. |
Access traffic ratio (bar chart) | Distribution of access requests among the | An incremental value that represents access generated within the selected time range. |
Space usage ratio (line chart) | The | A snapshot value that represents the current distribution of cached data among the |
To help you assess how frequently cached data is accessed, this topic groups the 10 seg segments into the following four zones.
Zone | Range | Description | Typical pattern |
Active zone |
| Hot data that was accessed most recently. This data contributes most to the cache hit rate. | Access traffic is typically concentrated in this zone. |
Warm zone |
| Data that is reused to some extent and is gradually becoming cold. | The zone occupies some space, and access traffic decreases across its segments. |
Cold zone |
| Data that has not been accessed for a relatively long time. | The space usage ratio is low. |
Eviction preparation zone |
| The coldest data, which is evicted first. | It is normal for this zone to occupy space while receiving almost no access traffic. If the space ratio is close to 0, data may be evicted before it becomes cold. |
The console marks the eviction preparation zone with a light yellow background. Active zone, warm zone, and cold zone are terms used in this topic to facilitate analysis. The console chart does not display labels for these zones.
At extremely high IOPS, the system may discard some access heat data, but the relative proportions and overall trend among the seg segments remain consistent. This does not affect decisions about increasing or reducing the capacity. To view absolute access traffic, use the QPS or bandwidth metrics.
Adjust cache capacity
First, use the following table to identify the chart pattern, and then check the corresponding example. Do not adjust the cache capacity of an accelerator based only on the heatmap. Obtain the cache hit rate from the Hit Rate metric in accelerator monitoring, and obtain the access and space ratios of the eviction preparation zone from the cache heatmap.
After you determine that the cache capacity needs to be adjusted, see Create, modify, and delete an OSS accelerator to modify the cache capacity of the OSS accelerator.
Chart pattern | Cache hit rate | Space ratio in the eviction preparation zone | Access ratio in the eviction preparation zone | Assessment and recommendation |
Access traffic is concentrated in the leading segments, and the eviction preparation zone retains some space | Greater than 95% | Greater than 10% | Less than 5% | The cache capacity may be larger than necessary. After you reserve a safety margin based on space utilization, you can reduce the capacity by a moderate amount. |
Both access traffic and space usage are concentrated in the leading segments | Less than 80% | Close to 0% | Close to 0% | The cache capacity may be insufficient. Increase the capacity in increments. |
The access traffic ratio and space usage ratio are similar in each segment | Any value | Similar to the access traffic distribution | Similar to the space usage distribution | The workload is dominated by random access. Evaluate the cost and benefit of increasing the capacity before you decide whether to adjust the cache capacity. |
If the cache hit rate is between 80% and 95%, do not draw a conclusion based only on the thresholds. Consider your target cache hit rate, the chart pattern, space utilization, and origin bandwidth together.
High cache hit rate: Evaluate a capacity reduction
Characteristics: Access traffic is concentrated in the active zone (seg 0~9) and the warm zone (seg 10~49), and the eviction preparation zone (seg 80~99) occupies some space but receives little access traffic. The cache hit rate is also high. This indicates that the cache has begun to evict colder data and that the cache hit rate is close to the upper limit for the current access pattern.
Example data:
seg                  0~9  10~19  20~29  30~39  40~49  50~59  60~69  70~79  80~89  90~99
Access traffic ratio  62%    18%     8%     5%     3%     2%     1%     1%     0%     0%
Space usage ratio     16%    19%    13%    10%     8%     5%     4%     3%     1%     21%

Banner: Eviction zone access ratio: 0%; space ratio: 22%
Recommendation: You do not need to increase the capacity. To reduce costs, consider reducing the capacity in increments if the cache hit rate is greater than 95%, the space ratio of the eviction preparation zone is greater than 10%, and its access ratio is less than 5%. In this example, the space ratio of the eviction preparation zone is 22% and its access ratio is less than 5%. You can consider reducing the capacity by 5% to 10%. After the reduction, check the cache heatmap and cache hit rate again before you decide whether to further reduce the capacity.
Low cache hit rate: Evaluate a capacity increase
Characteristics: Both the access traffic ratio and the space usage ratio are concentrated in the leading part of the chart (seg 0~19), and the eviction preparation zone (seg 80~99) has space and access ratios close to 0%. The cache hit rate is also low. This indicates that data remains in the cache for only a short time and that hot data may be repeatedly retrieved from the origin and written back to the cache.
Example data:
seg                  0~9  10~19  20~29  30~39  40~49  50~59  60~69  70~79  80~89  90~99
Access traffic ratio  88%    10%     2%     0%     0%     0%     0%     0%     0%     0%
Space usage ratio     58%    34%     8%     0%     0%     0%     0%     0%     0%     0%

Banner: Eviction zone access ratio: 0%; space ratio: 0%
Recommendation: Increase the cache capacity of the accelerator in increments. After each increase, wait at least 1 hour before you observe the data. If the capacity increase is effective, seg 20~49 in the warm zone, which previously contained no data, displays space usage and access traffic, and the cache hit rate increases.
Random access: Evaluate benefits
Characteristics: The access traffic ratio and space usage ratio of each seg segment are nearly equal, and the two data series almost overlap. The cache hit rate changes approximately linearly with the cache capacity. This usually indicates large-scale random reads with no clear distinction between hot and cold cached data.
Example data:
seg                  0~9  10~19  20~29  30~39  40~49  50~59  60~69  70~79  80~89  90~99
Access traffic ratio  30%    20%    14%    11%     8%     6%     5%     3%     2%     1%
Space usage ratio     30%    19%    14%    11%     8%     6%     5%     4%     2%     1%
In a random-read test, the cache hit rate was 49.3% when the cache capacity was 1/2 of the data volume and 19.9% when the cache capacity was 1/5 of the data volume. By comparison, with the same cache capacity of 1/2 of the data volume, the cache hit rate reached 86.9% under the 80/20 access pattern.
The 80/20 access pattern means that 80% of accesses target 20% of the data.
Recommendation: Increasing the capacity can improve the cache hit rate, but the cost and benefit have an approximately linear relationship, with no clear point of diminishing returns.
Recommendations
Select representative time periods. Evaluate cache capacity during busy periods of the day to prevent off-peak data from underestimating capacity requirements. For workloads with clear daily or weekly peaks, such as nightly batch jobs, observe peak and off-peak periods separately.
Observe multiple consecutive cycles. A single sample or short observation period can be affected by transient fluctuations. Observe multiple consecutive business cycles for at least 6 hours, and avoid frequent cache capacity adjustments during the observation period.
Reduce the capacity in increments. Reduce the cache capacity in increments based on the available capacity indicated by space utilization. After each reduction, check the cache heatmap and cache hit rate again. Before you continue, confirm that the active zone (
seg 0~9) is not compressed and that the eviction preparation zone (seg 80~99) is not empty.Calibrate elastic capacity levels separately. For elastic scaling scenarios such as increasing capacity at night and reducing it during the day, use heatmaps from peak and off-peak periods to calibrate the two cache capacity levels separately.
Check monitoring metrics together. Use the cache heatmap to explain changes in the cache hit rate, and use the cache hit rate and origin bandwidth to verify the result of an adjustment. If the metrics lead to inconsistent conclusions, first check whether the workload's access pattern has recently changed.
FAQ
Does 100% OSS accelerator cache space utilization mean that I must increase the cache capacity?
No. An OSS accelerator uses the least recently used (LRU) eviction policy and starts to evict data only after its cache is full. If the total data volume exceeds the cache capacity, space utilization reaches 100%. A low cache hit rate combined with a space ratio close to 0% in the eviction preparation zone indicates insufficient cache capacity.
Is it abnormal if the eviction preparation zone occupies space but receives no access traffic?
No. The eviction preparation zone stores cold data that is about to be replaced by new data. It is normal for this zone to occupy space while receiving almost no access traffic. If the space ratio of this zone is close to 0, data may be evicted before it becomes cold. Use the cache hit rate to determine whether to increase the capacity.
How much does the cache hit rate decrease after I reduce the cache capacity?
First, check the available cache capacity indicated by space utilization, and then refer to the measured relationship between cache capacity and cache hit rate. For a workload with access locality, an 80/20 access pattern test showed that halving the cache capacity reduced the cache hit rate from 98.0% to 86.9%, a decrease of approximately 11 percentage points. For random reads, the cache hit rate changes approximately linearly with the cache capacity ratio. Reducing the capacity causes an approximately proportional decrease in the cache hit rate. Reduce the capacity in increments, and check the cache hit rate and cache heatmap again after each adjustment.
Why is almost all access traffic concentrated in seg 0~9?
Two situations are possible. Use the space distribution to distinguish between them. First, access locality may be strong and the cache may be working properly. In this case, the later segments still have a normal space distribution and the cache hit rate is high. Second, the capacity may be severely insufficient and data may be evicted quickly. In this case, the space ratio of the eviction zone is also close to 0 and the cache hit rate is low. The second situation requires a capacity increase. Compare the High cache hit rate: Evaluate a capacity reduction and Low cache hit rate: Evaluate a capacity increase scenarios.
How often should I check the cache heatmap?
When you evaluate cache capacity, collect samples at minute-level intervals during peak business hours and observe multiple business cycles. For routine checks, inspect the chart daily or weekly for structural changes. A significant change in the chart pattern typically indicates that the workload's access pattern has changed.