The Application Overview page in the Microservices Engine (MSE) console provides a real-time health dashboard for your application. Use it to monitor queries per second (QPS), response time (RT), and CPU utilization, then drill down into specific interfaces to identify bottlenecks and apply governance rules.
QPS and RT on this page reflect ingress traffic only -- requests entering the application through its ingress interface. Internal method calls within the application are not included.
Access the Application overview page
Log on to the MSE console and select a region in the top navigation bar.
In the left-side navigation pane, choose Microservices Governance > Application Governance.
On the Application list page, click the resource card of your application.
In the left-side navigation pane, click Application Overview.
Monitor performance metrics
The dashboard auto-refreshes and displays four metric panels. The QPS Data, RT, and CPU charts each cover the previous 5 minutes.
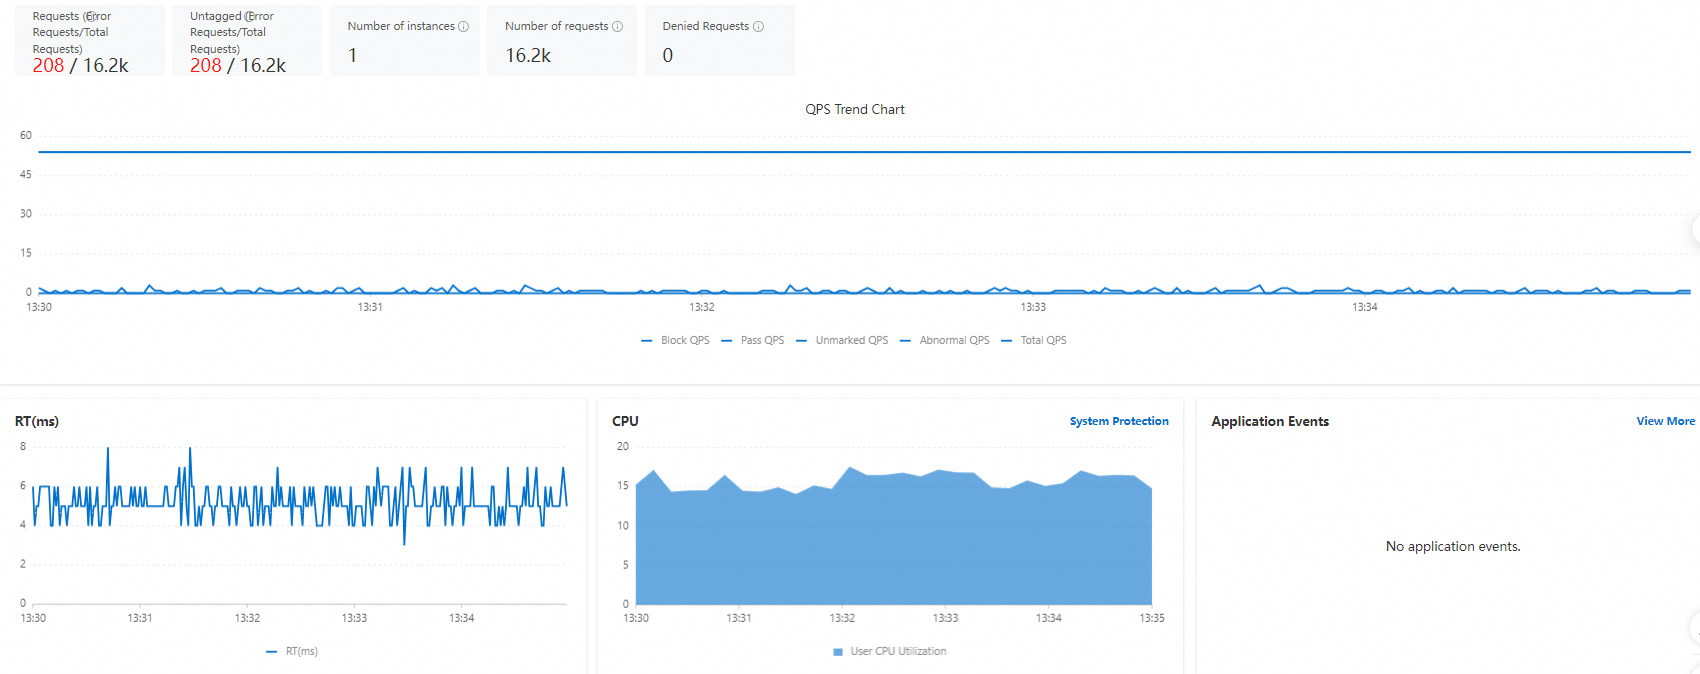
| Panel | Description |
|---|---|
| Request Data | Contains the QPS Data chart, which shows trends for the number of instances with allowed requests, total allowed requests, and denied requests. Click any legend entry to toggle its trend line. |
| RT(ms) | Response time trend in milliseconds. |
| CPU | CPU utilization percentage. |
| Application Events | Recent events generated for the application. |
Identify issues with Top N interface rankings
Below the metric panels, three tabs rank your interfaces by different criteria. These lists also auto-refresh.

| Tab | Ranking criterion |
|---|---|
| Through QPS TOP | Pass QPS |
| Top Block QPS for Protection | Sorted based on specific fields |
| Average RT TOP | Sorted based on specific fields |
Drill down into interface details
To investigate a specific interface, click its name in any Top N tab, or click View All in the upper-right corner of the section. Both paths open the WEB service tab on the API Details page, where you can view:
QPS data (in seconds)
RT data (ms)
Maximum Concurrency (in Seconds)
Events
Apply governance rules
In any Top N list, locate the target interface and click Flow Control or Isolation in the Actions column to configure rules for that interface.
See also
For definitions of the metrics on this page, see the "Metrics of Microservices Governance" section in FAQ overview.