The API Details page displays details of all interfaces of an application, including queries per second (QPS), abnormal requests, response time (RT), and concurrency. You can also configure traffic protection rules -- throttling, circuit breaking, concurrency isolation, and hotspot parameter protection -- directly from this page.
Traffic protection rule management requires Microservices Governance Enterprise Edition.
Navigate to the API details page
Log on to the MSE console and select a region in the top navigation bar.
In the left-side navigation pane, choose Microservices Governance > Application Governance.
On the Application list page, click the resource card of your application.
In the left-side navigation pane, click API Details.
Description
The API Details page displays details of all interfaces of an application, including QPS, RT, and concurrency. Click the WEB service and RPC service tabs to go to the details page of different types of interfaces. The following sections describe the information that you can view on the tabs.
WEB service tab
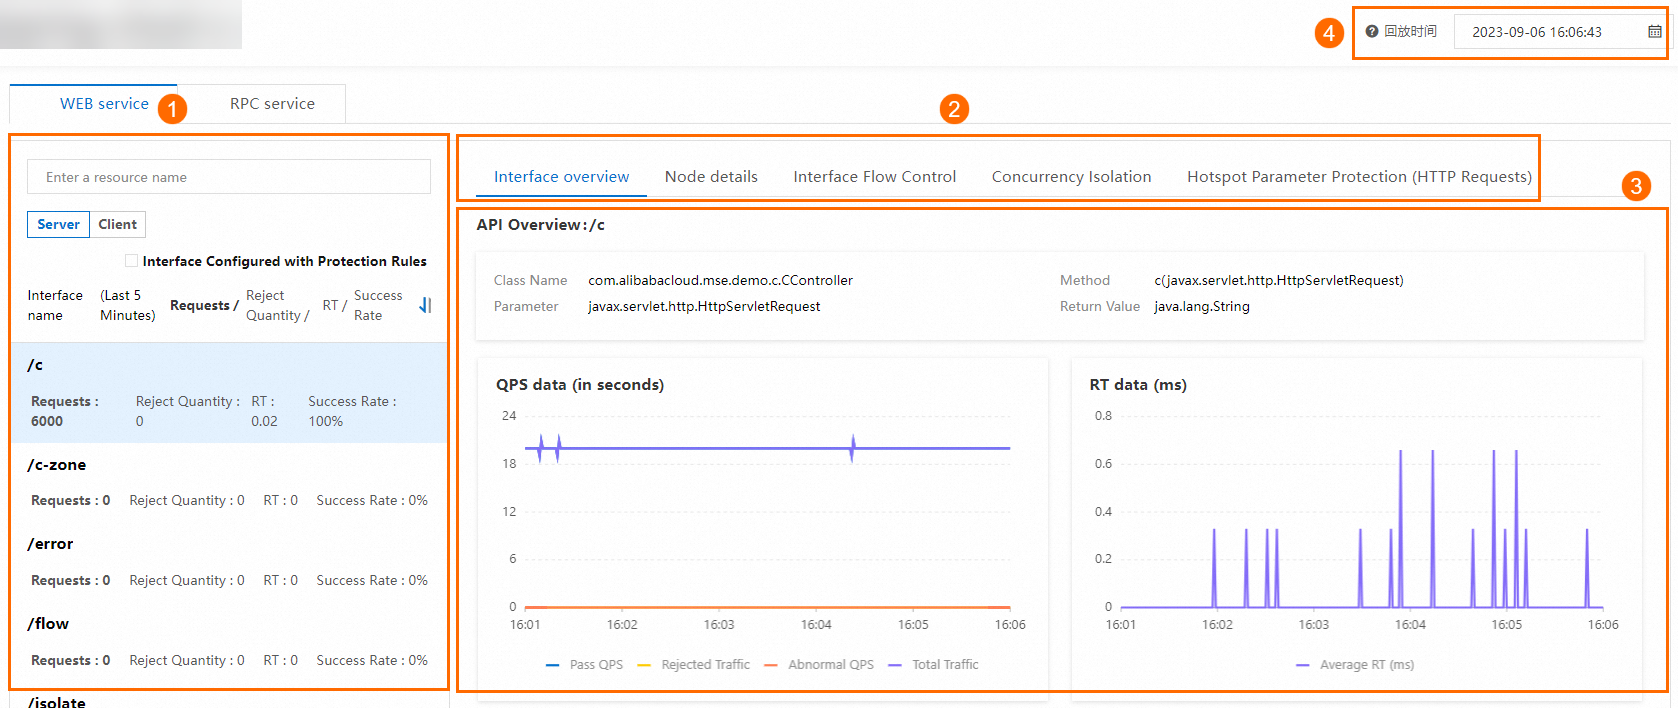
Interface list
The interface list (left panel) displays all web interfaces on two subtabs: Server and Client. Each row shows 5-minute aggregated data for Requests, Reject Quantity, RT, and Success Rate.
To find a specific interface:
Search by resource name using the search bar.
Select Interface Configured with Protection Rules to filter interfaces that have protection rules, regardless of whether those rules are enabled.
Sort by any metric column (Requests, Reject Quantity, RT, or Success Rate).
Interfaces configured with protection rules display a shield icon (![]() ) on the right side of the interface name.
) on the right side of the interface name.
Detail tabs
Select an interface from the list to view its data and configure rules. The following tabs are available:
| Tab | Description | Availability |
|---|---|---|
| Interface overview | QPS, RT, and concurrency charts over time | Server and Client |
| Node details | Per-node breakdown of QPS, RT, and concurrency | Server and Client |
| Interface Flow Control | Configure throttling rules for the current interface | Server and Client |
| Concurrency Isolation | Configure isolation rules for the current interface | Server and Client |
| Hotspot Parameter Protection (HTTP Requests) | Configure hotspot parameter protection rules for the current interface | Server only |
| Circuit Breaking | Configure circuit breaking rules for the current interface | Client only |
Time replay
Use the time selector at the top to replay metric data from any point within the past 24 hours. Replayed data reflects only nodes that are currently online.
RPC service tab

Interface list
The RPC interface list displays all RPC interfaces on the Server and Client subtabs, showing data collected at the current time for Requests, Reject Quantity, RT, and Success Rate. You can search for interfaces by resource name.
RPC interfaces use a two-level hierarchy: the class name at the first level and the method name at the second level.
Detail tabs
| Tab | Description | Availability |
|---|---|---|
| Interface overview | QPS, RT, and concurrency charts over time | Server and Client |
| Node details | Per-node breakdown of QPS, RT, and concurrency | Server and Client |
| Interface Flow Control | Configure throttling rules for the current interface | Server and Client |
| Concurrency Isolation | Configure isolation rules for the current interface | Server and Client |
| Hotspot Parameter Protection (RPC) | Configure hotspot parameter protection rules for the current interface | Client only |
| Circuit Breaking | Configure circuit breaking rules for the current interface | Client only |
Time replay
Use the time selector to replay metric data from the past 24 hours. Only data from currently online nodes is available for replay.
Gateway applications
For Java applications that function as gateways, the API Details page does not distinguish between service types or server/client roles. The layout resembles the Server subtab of the WEB service tab, with route names displayed in the interface list.