The CloudDBA performance trends feature lets you monitor key performance metrics and trends of an ApsaraDB for MongoDB instance over a specified time period. These metrics include CPU utilization, memory usage, total connections, and network traffic.
Prerequisites
The instance must be a standalone instance, a replica set instance, or a sharded cluster instance .
Procedure
Log on to the ApsaraDB for MongoDB console.
In the left-side navigation pane, click Replica Set Instances or Sharded Cluster Instance based on the instance type.
In the upper-left corner of the page, select the resource group and region to which the instance belongs.
On the page that appears, find the instance that you want to manage and click its ID.
- In the left-side navigation pane, choose Performance.
Node list
The Performance Trend page provides a Nodes module. In the Nodes area, you can view the basic information and key metric trends for each node in the current instance.
Performance trends
This module has three modes: Performance Trend, Performance Trend Comparison, and Custom Charts.
- Performance Trend: Displays trend charts for each metric over a specified time period. Each chart represents a single metric.
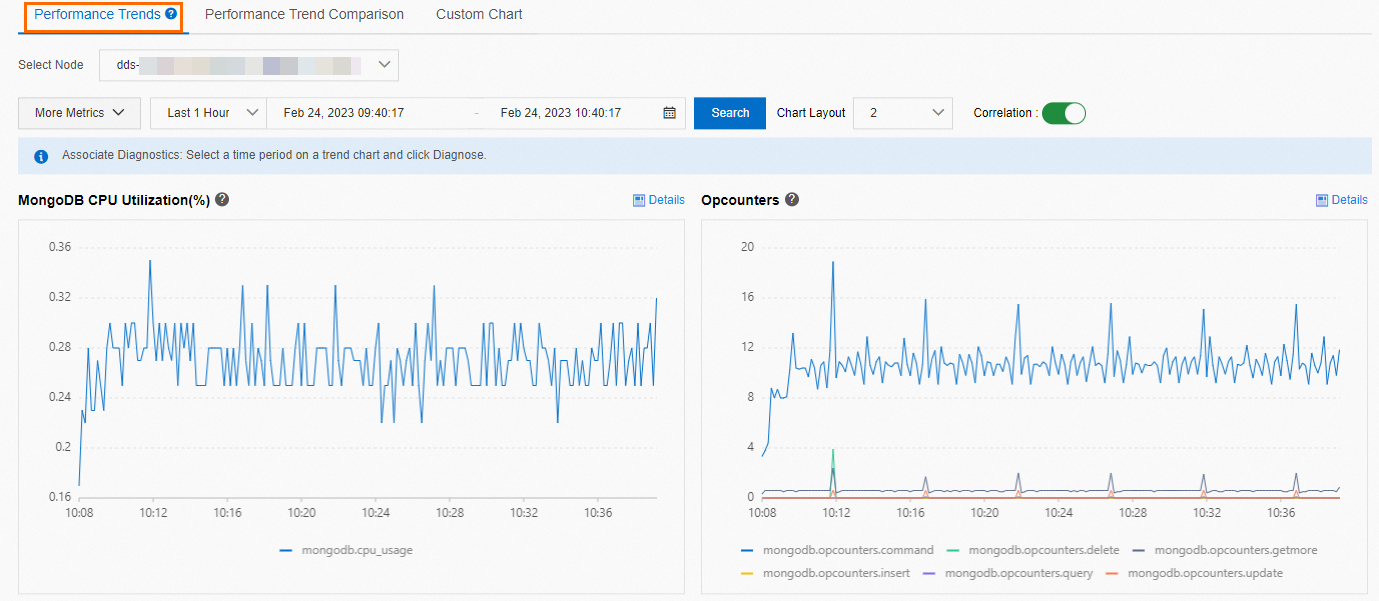
- Performance Trend Comparison: Compares metric trends across two specified time periods. This helps you identify significant differences and quickly locate the cause of performance issues. Each chart represents a single metric. Select a target node, specify two time ranges, and click View. Use the Chart Layout drop-down list to adjust the number of charts displayed per row. Enable the chart linking switch to synchronize the timelines across all charts. The page displays trend comparison line charts for metrics such as MongoDB CPU Utilization (%) and Opcounters.
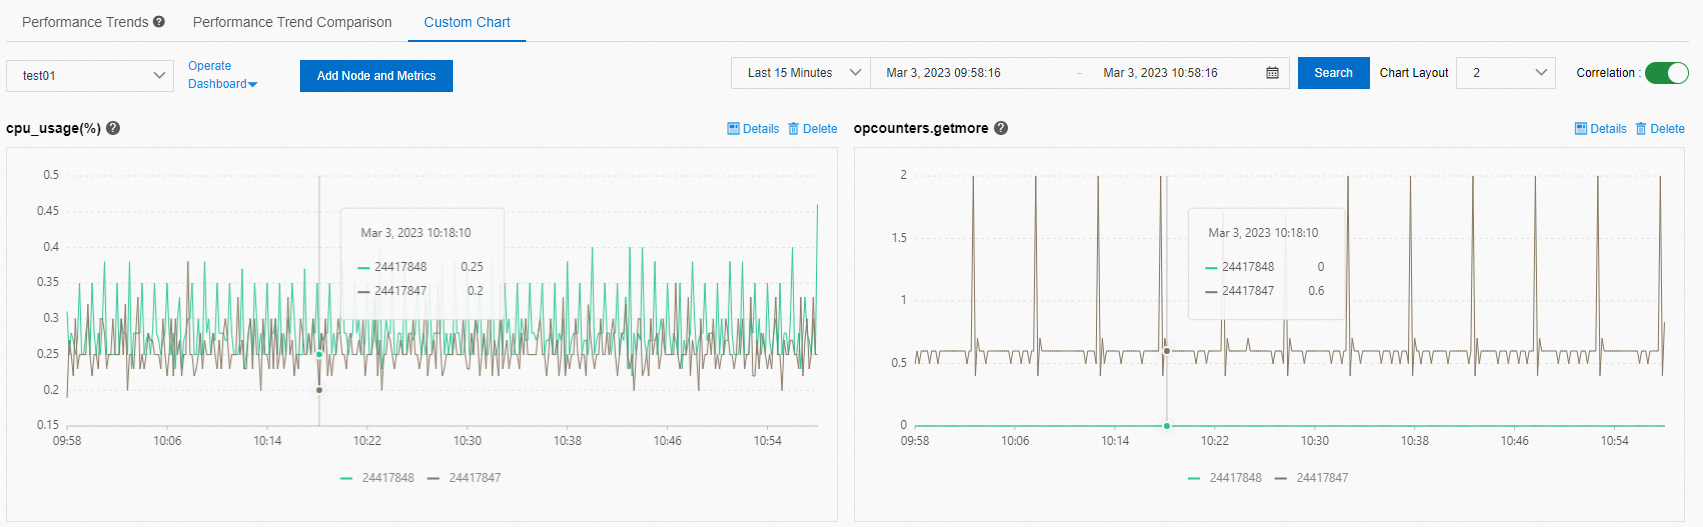
- Custom Charts: Lets you analyze trends for selected metrics. For detailed instructions, see Custom performance trend charts.Note By default, Correlation Chart is enabled. When you hover over a point on one chart, all other charts synchronize to the same point in time.