Use the monitoring feature to:
View call records
Monitor and set alerts for metrics such as time to first token, call duration, requests per minute (RPM), tokens per minute (TPM), and failure rate.
Track token consumption.
Supported models
Basic monitoring: Supports all models in the Model list. Advanced monitoring supports all models in the China (Beijing), Singapore, and US (Virginia) regions.
Alerting feature: Supports all models in the China (Beijing) and Singapore regions.
Logging feature: The following models are currently supported:
Beijing
qwen3-max, qwen3-max-2025-09-23, qwen3-max-2026-01-23, qwen3-max-preview
qwen-max, qwen-max-0919, qwen-max-2025-01-25, qwen-max-latest
qwen-plus, qwen-plus-2025-04-28, qwen-plus-2025-07-14, qwen-plus-2025-07-28, qwen-plus-2025-09-11, qwen-plus-2025-12-01, qwen-plus-latest
qwen-flash, qwen-flash-2025-07-28
qwen-turbo, qwen-turbo-2025-07-15, qwen-turbo-2025-04-28, qwen-turbo-latest
deepseek-v3.1, deepseek-v3.2, deepseek-v3.2-exp
qwen3-235b-a22b, qwen3-235b-a22b-instruct-2507, qwen3-235b-a22b-thinking-2507, qwen3-30b-a3b, qwen3-30b-a3b-instruct-2507, qwen3-30b-a3b-thinking-2507, qwen3-next-80b-a3b-instruct, qwen3-next-80b-a3b-thinking
qwen3-coder-480b-a35b-instruct, qwen3-coder-flash, qwen3-coder-flash-2025-07-28, qwen3-coder-plus, qwen3-coder-plus-2025-07-22, qwen3-coder-plus-2025-09-23
Singapore
qwen3-max, qwen3-max-2025-09-23, qwen3-max-2026-01-23, qwen3-max-preview
qwen-max, qwen-max-2025-01-25, qwen-max-latest
qwen-plus, qwen-plus-2025-04-28, qwen-plus-2025-07-14, qwen-plus-2025-07-28, qwen-plus-2025-09-11, qwen-plus-2025-12-01, qwen-plus-latest
qwen-flash, qwen-flash-2025-07-28
qwen-turbo, qwen-turbo-2025-04-28, qwen-turbo-latest
qwen3-235b-a22b, qwen3-235b-a22b-instruct-2507, qwen3-235b-a22b-thinking-2507, qwen3-30b-a3b, qwen3-30b-a3b-instruct-2507, qwen3-30b-a3b-thinking-2507, qwen3-next-80b-a3b-instruct, qwen3-next-80b-a3b-thinking
qwen3-coder-480b-a35b-instruct, qwen3-coder-flash, qwen3-coder-flash-2025-07-28, qwen3-coder-plus, qwen3-coder-plus-2025-07-22, qwen3-coder-plus-2025-09-23
Monitor model runs
Model call data from all models under your Alibaba Cloud account is automatically collected and synchronized to the Monitoring list in each workspace after a direct or indirect model call.
Records are grouped by model and workspace. A new model appears in the list after its first data synchronization. Basic monitoring has an hourly data latency. For minute-level insights, use advanced monitoring.
Members of the default workspace can view model calls across all workspaces. Members of a sub-workspace can only view data for their current workspace and cannot switch to other workspaces.
Find the target model in the list and click Monitor in the Actions column to view the following metric categories:
Security: Tracks content policy violations, such as
Content Moderation Error Count.Cost: Tracks cost-related metrics such as
Average Usage per Request.Performance: Tracks response speed metrics such as
Call DurationandTime to First Token.Error: Tracks reliability metrics such as
FailuresandFailure Rate.
You can then create alerts based on these metrics to promptly detect and handle anomalies.
Call statistics
This tab displays metrics related to security, cost, and errors, such as call count and failure count. Filter by API key, inference type, and time range.
Rate Limiting Error Count: Call failures caused by a 429 status code.
Content Moderation Error Count: Triggered when input or output contains suspected sensitive or high-risk content (such as pornography, political, or advertisements) and is blocked by the Content Moderation Service.
Performance metrics
This tab displays performance-related metrics such as RPM, TPM, call duration, and time to first token.
View token consumption
Track and manage token consumption costs with the following monitoring features:
Summary: Aggregates historical token consumption by model and workspace. Further filter by time range and API key.
Tracking: Records the token consumption for each model call.
Alerting: Sets consumption thresholds and sends alerts when a model exceeds them.
View historical token consumption
To view token consumption for the last 30 days:
When the model appears in the Monitoring list, click Monitor in the Actions column on its right.
On the Call Statistics tab, view the token consumption data in the Calls section.
To view earlier usage, check the Expenses and Costs page.
View token consumption for a specific call
This feature is currently available only for some models in the China (Beijing)
Log on with your Alibaba Cloud account (or a RAM user with sufficient permissions) and go to the Monitoring (Beijing) page in the target workspace. Click Monitoring Configuration in the upper-right corner and follow the prompts to enable audit logs and inference logs.
After you enable this feature, the system records the input and output of every model call in the workspace. Logs may take up to a few minutes to appear after a call.
Find the target model in the monitoring list, click Logs in the Actions column.
The Logs tab displays the real-time inference call records for the model. The Usage field shows the token consumption for the call.
Create an alert for abnormal consumption
View conversation history (model logs)
This feature is currently limited to some models in the China (Beijing) region.
View full input, output, and timing details for every model call. Useful for troubleshooting and content auditing.
Step 1: Enable logging
Log on with an Alibaba Cloud account (or a RAM user with sufficient permissions). On the Monitoring (Beijing) page of the target workspace, click Monitoring Configuration in the upper-right corner, and follow the instructions to enable audit logs and inference logs.
After you enable this feature, the system records the input and output of every model call in the workspace. Logs may take up to a few minutes to appear after a call.
To stop recording, disable inference logging in the monitoring configuration.
Step 2: View conversation history
Find the target model in the monitoring list, click Logs in the Actions column.
The Logs tab displays the real-time inference call records for the model. The Request and Response fields correspond to the input and output of the call.
Set up proactive alerts
This feature is currently available only in the Singapore and China (Beijing) regions.
Set alerts for metrics like cost, failure rate, and response latency to detect silent failures (timeouts, consumption spikes) that application logs miss. Alerts are sent immediately when metrics become abnormal.
Step 1: Enable advanced monitoring
Log on with your Alibaba Cloud account (or a RAM user with sufficient permissions). Go to the Monitoring (Singapore or Beijing) page in the target workspace. Click Monitoring Configuration in the upper-right corner.
In the Advanced Monitoring section, manually turn on Performance and usage metrics monitoring.
Step 2: Create an alert rule
On the Alerts (Singapore or Beijing) page, click Create Alert Rule in the top-right corner.
In the dialog box, select the model and monitoring template, then click Create. When a specified metric becomes abnormal, the system notifies your team.
Notification method: Supports text message, email, phone, DingTalk group robot, WeCom Robot, and Webhook.
Alert level: Levels include General, Warning, Error, and Urgent. You cannot add or modify these levels. Relationship between levels and notification channels:
Urgent: Phone, text message, email
Error: Text message, email
Warning: Text message, email
General: Email
Connect to Grafana and custom applications
Monitoring data is stored in a private Prometheus instance that supports the standard HTTP API. Connect to Grafana or custom applications for visual analytics.
Step 1: Get the data source HTTP API address
Make sure you have enabled advanced monitoring first.
On the Monitoring (Singapore), Monitoring (Virginia), or Monitoring (Beijing) page, click Monitoring Configuration in the upper-right corner. Click View Details to the right of the CloudMonitor Prometheus instance.
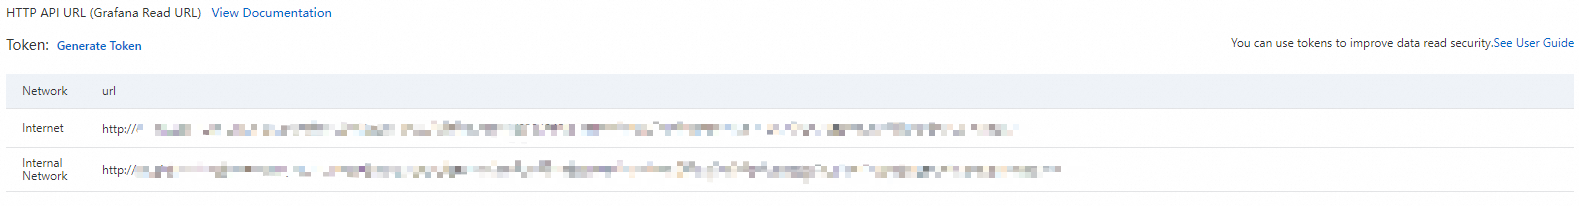
On the Settings page, copy the corresponding HTTP API address based on your client's network environment (public network or VPC access).
Step 2: Connect to Grafana or a custom application
Connect to a custom application
The following example shows how to retrieve monitoring data using the Prometheus HTTP API. For complete API usage, see the Prometheus HTTP API documentation.
Example 1: Query the token consumption for all models across all workspaces in an Alibaba Cloud account on November 20, 2025 (UTC), with the query set to
model_usageand the step size set tostep=60 s.Example
Parameter description
GET {HTTP API}/api/v1/query_range?query=model_usage&start=2025-11-20T00:00:00Z&end=2025-11-20T23:59:59Z&step=60s

Accept: application/json
Content-Type: application/json
Authorization: Basic base64Encode(AccessKey:AccessKeySecret)
query: The value of
querycan be replaced with any metric name from the Monitoring metrics list below.HTTP API: Replace
{HTTP API}with the HTTP API address you got in Step 1.Authorization: Concatenate the AccessKey and AccessKey secret of your Alibaba Cloud account in the format
AccessKey:AccessKeySecret, encode the string in Base64, and provide it in the formatBasic encoded_string.Example value: Basic TFRBSTV3OWlid0U4XXXXU0xb1dZMFVodmRsNw==
Note:AccessKey and AccessKey secret must belong to the same Alibaba Cloud account as the Prometheus instance from Step 1.
Example 2: Building on Example 1, add filters to retrieve token consumption only for a specific model (
qwen-plus) in a specific workspace (llm-nymssti2mzww****).Example
Description
GET {HTTP API}/api/v1/query_range?query=model_usage{workspace_id="llm-nymssti2mzww****",model="qwen-plus"}&start=2025-11-20T00:00:00Z&end=2025-11-20T23:59:59Z&step=60s

Accept: application/json
Content-Type: application/json
Authorization: Basic base64Encode(AccessKey:AccessKeySecret)
query: Enclose multiple filter conditions in
{}and separate them with commas. For example:{workspace_id="value1",model="value2"}. The following is a list of supported filter conditions (LabelKey).LabelKey
Description
user_id
Alibaba Cloud account ID.
For a RAM user, this is the UID. For more information, see the referenced document
apikey_id
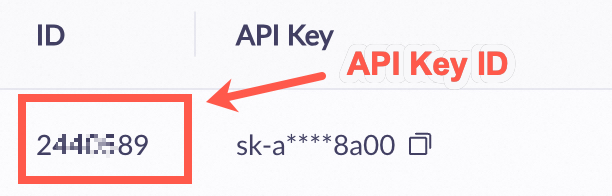
Get the API Key ID (not the API key) on the Key Management (Singapore | US | Beijing) page.
 Note
NoteAn apikey_id value of -1 indicates that the call originated from the Alibaba Cloud Model Studio console, not through an API.
workspace_id
Workspace ID. For more information, see the referenced document.
model
Model.
protocol
Protocol type. Possible values:
HTTP: Non-streaming HTTP
SSE: Streaming HTTP
WS: WebSocket protocol
sub_protocol
Sub-protocol. Possible values:
DEFAULT: Synchronous call
ASYNC: Asynchronous call
Commonly used for image generation models. Text-to-image generation
status_code
HTTP status code.
Only the
model_call_countmetric supports this LabelKey.error_code
Error code.
Only the
model_call_countmetric supports this LabelKey.usage_type
Usage type.
Only the
model_usagemetric supports this LabelKey.Possible values:
total_tokens
input_tokens
output_tokens
cache_tokens
image_tokens
audio_tokens
video_tokens
image_count
audio_count
video_count
duration
characters
audio_tts
times
Connect to Grafana
Add a monitoring data source in Grafana (self-managed or Alibaba Cloud Grafana service). This example uses Grafana 10.x (English version). The procedure for other versions is similar. For more information, see the official Grafana documentation.
Add a data source:
Log on to Grafana with an administrator account. Click the
 icon in the upper-left corner and select . Click + Add new data source and select Prometheus as the data source type.
On the Settings tab, configure the data source information:
Name: Enter a custom name.
Prometheus server URL: Enter the HTTP API address you got in Step 1.
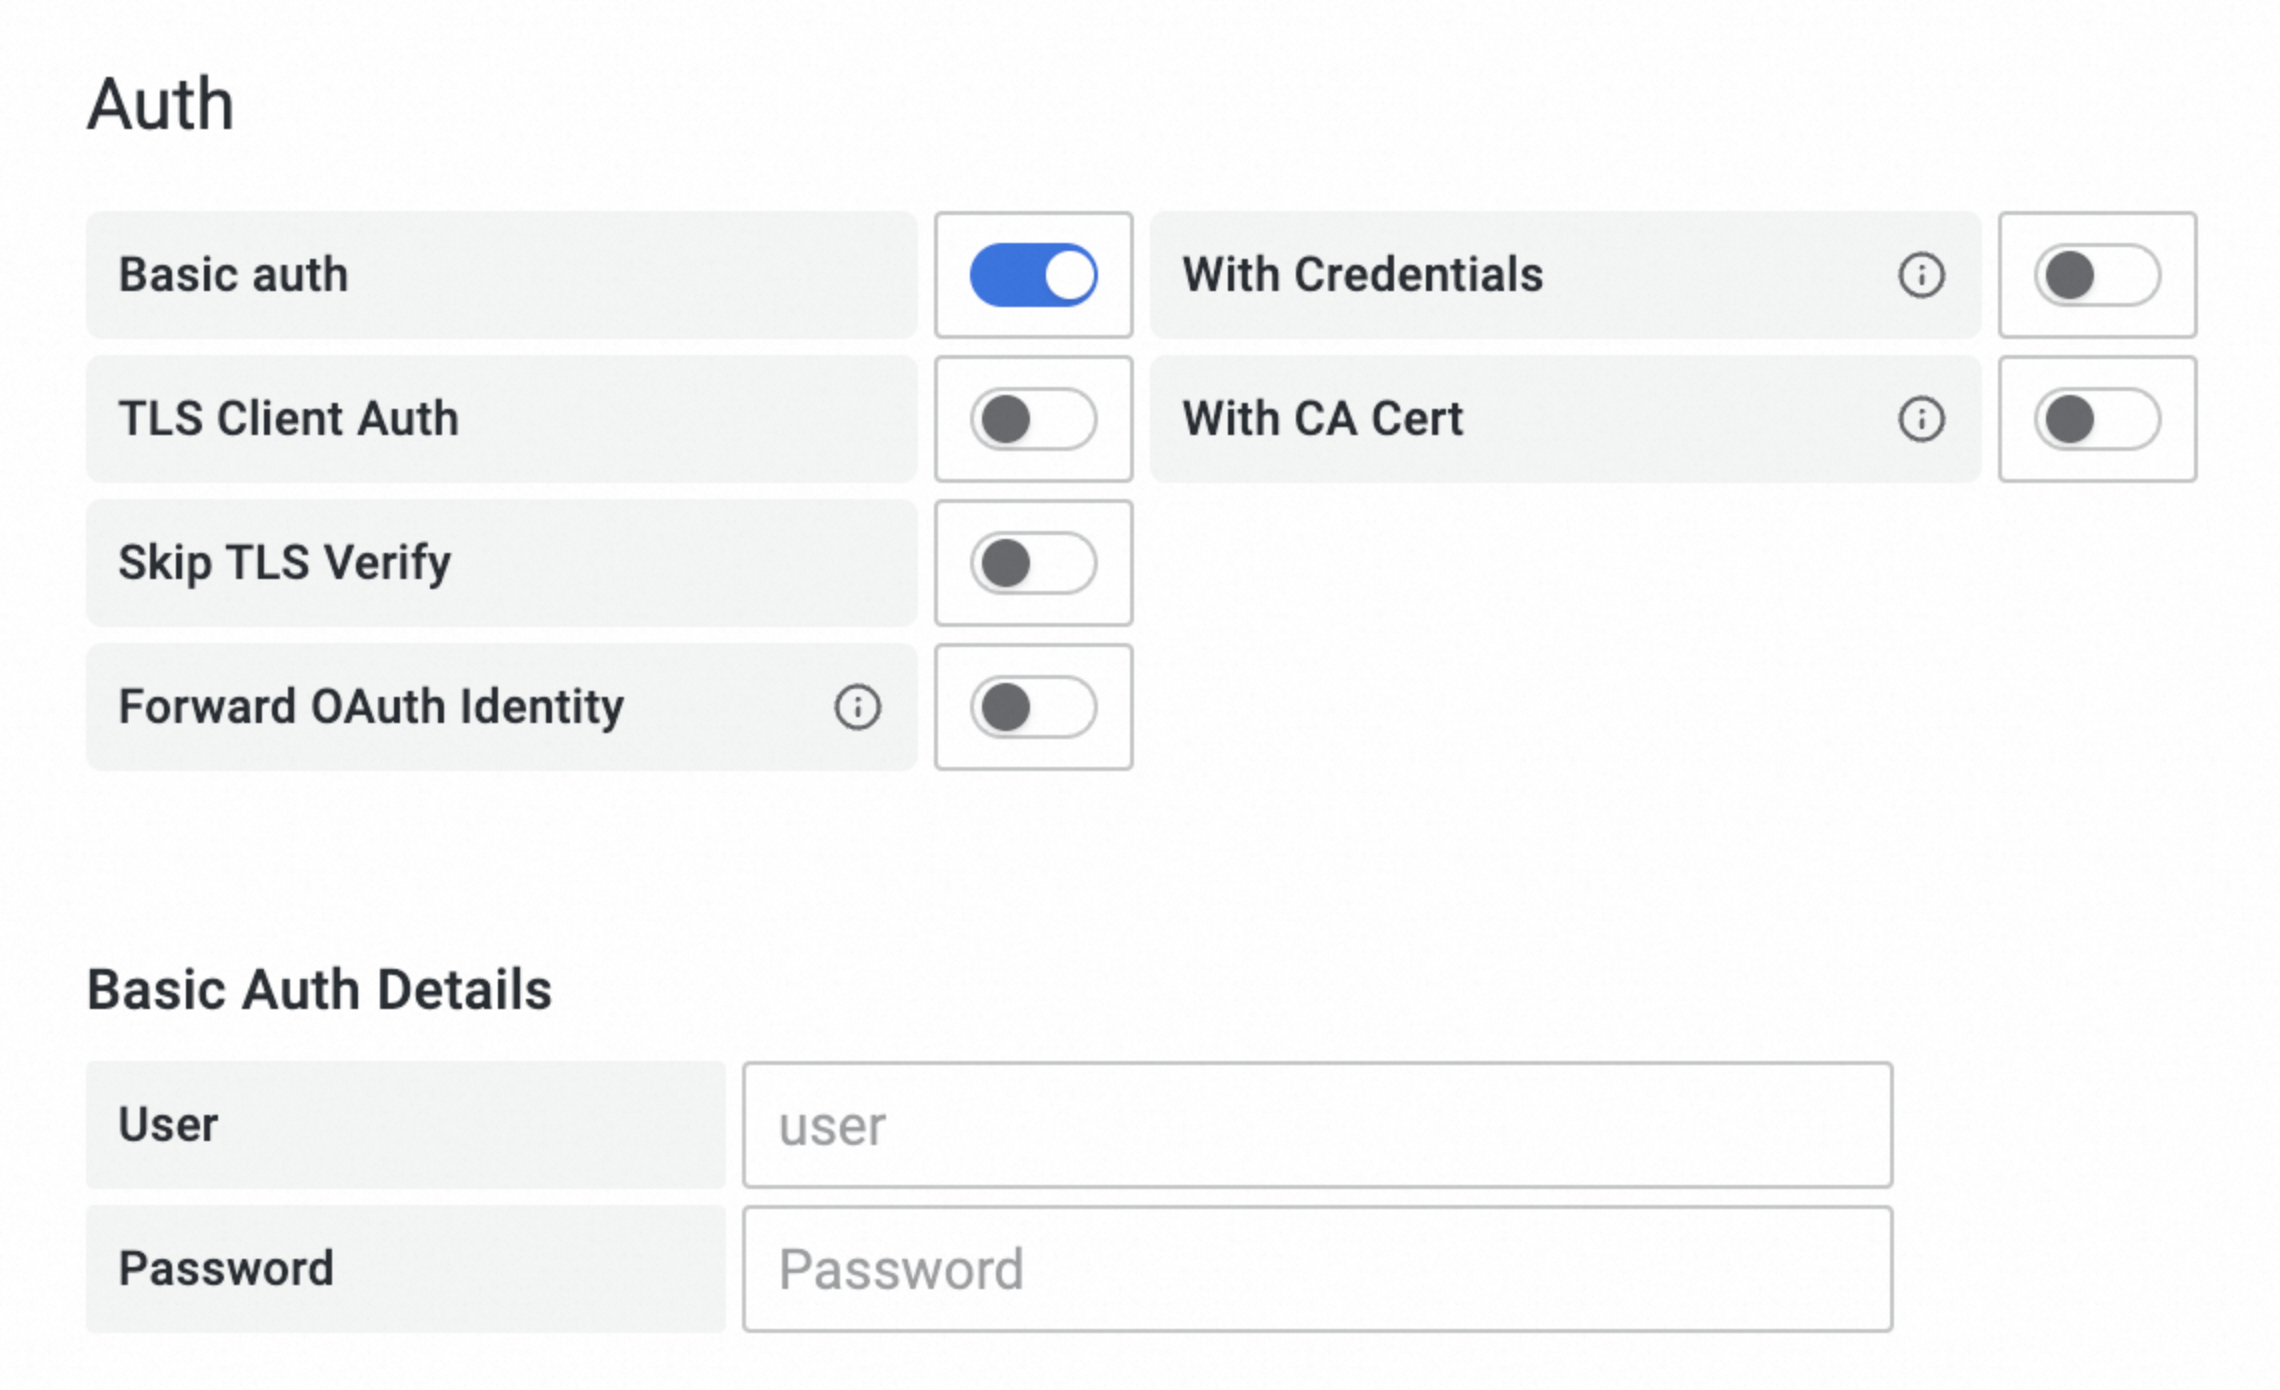
Auth: Enable Basic auth and set User to the AccessKey of your Alibaba Cloud account and Password to the AccessKey secret of your Alibaba Cloud account.
The AccessKey and AccessKey secret must belong to the same Alibaba Cloud account as the Prometheus instance from Step 1.
Click Save & Test at the bottom of the tab.
Query metrics:
Click the
 icon in the upper-left corner of the Grafana page, then click Dashboards in the navigation pane on the left.
On the Dashboards page, click on the right to create a new dashboard.
Click + Add visualization and select the data source that you just created.
On the Edit Panel page, click the Query tab. In the A section, select _name_ and the metric name from the Label filters field. The following example shows how to query model token consumption using the
model_usagemetric:Example
Description
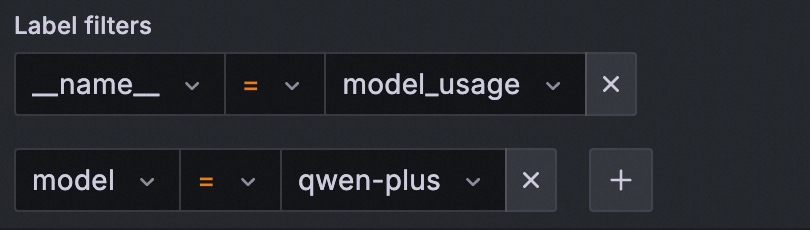
In the figure, replace the value for
_name_(model_usage) with any metric name from the Monitoring metrics list below.Add the following label filters to further refine your query:
LabelKey
Description
user_id
Alibaba Cloud account ID.
For a RAM user, this is the UID. For more information, see the referenced document
apikey_id
Get the API Key ID (not the API key) on the Key Management (Singapore | US | Beijing) page.
NoteAn apikey_id value of -1 indicates that the call originated from the Alibaba Cloud Model Studio console, not through an API.
workspace_id
Workspace ID. For more information, see the referenced document.
model
Model.
protocol
Protocol type. Possible values:
HTTP: Non-streaming HTTP
SSE: Streaming HTTP
WS: WebSocket protocol
sub_protocol
Sub-protocol. Possible values:
DEFAULT: Synchronous call
ASYNC: Asynchronous call
Commonly used for image generation models. Text-to-image generation
status_code
HTTP status code.
Only the
model_call_countmetric supports this LabelKey.error_code
Error code.
Only the
model_call_countmetric supports this LabelKey.usage_type
Usage type.
Only the
model_usagemetric supports this LabelKey.Possible values:
total_tokens
input_tokens
output_tokens
cache_tokens
image_tokens
audio_tokens
video_tokens
image_count
audio_count
video_count
duration
characters
audio_tts
times
Click Run queries to execute the query.
If the chart displays data successfully, the configuration is correct. Otherwise, verify the following: 1. The HTTP API address, AccessKey, and AccessKey secret are correct. 2. Monitoring data exists in the Prometheus instance from Step 1.
Compare monitoring modes
Model monitoring offers two modes: Basic Monitoring and Advanced Monitoring.
Basic Monitoring: It is automatically enabled when you activate Model Studio and cannot be disabled.
Advanced Monitoring: Requires manual activation by Alibaba Cloud account (or a RAM user with sufficient permissions) on the Monitoring (Singapore), Monitoring (Virginia), or Monitoring (Beijing) page. You can disable advanced monitoring at any time. It records data only after you enable it.
Item | Basic Monitoring (Default) | Advanced Monitoring (Manual activation required) | |
Data latency | Hourly | Minute-level | |
Call statistics | Supported | Supported | |
Failed call details | Not supported | Supported | |
Performance metrics | Supported | Supported | |
Applicable scope | All workspaces under the Alibaba Cloud account | Effective only in the workspace where it is enabled | |
Billing | Free | Paid | |
Quotas and limits
Data retention period: Monitoring data is retained for 30 days by default. For earlier periods, use the Expenses and Costs page.
Alert template limit: You can create up to 100 alert templates for each workspace.
API limit: You can query monitoring metrics using the Prometheus HTTP API.
Alternative: To retrieve token consumption for a single call, extract the data from the
usagefield in the response. See the Qwen API reference.{ "prompt_tokens": 3019, "completion_tokens": 104, "total_tokens": 3123, "prompt_tokens_details": { "cached_tokens": 2048 } }
Billing description
Basic monitoring: Free.
Advanced monitoring: When enabled, minute-level monitoring data is written to the Cloud Monitor CMS service and incurs fees. See Cloud Monitor CMS billing.
Inference logs: When enabled, minute-level log data is written to Simple Log Service (SLS). This action incurs fees. For more information, see Simple Log Service billing.
FAQ
Why can't I find the call count and token consumption after calling a model?
Follow these steps to troubleshoot:
Data latency: Basic monitoring has hourly latency. Advanced monitoring has minute-level latency.
Workspace: If you are in a sub-workspace, you can view data for that workspace only. To view all data, switch to the default workspace.
What causes timeouts when calling a model?
Common reasons include the following:
Excessively long output: The model generates too much content, causing the response time to exceed the client timeout. Use streaming output to receive the first token faster.
Network issues: Check that the network connection between the client and Alibaba Cloud is stable.
How do I configure permissions for a RAM user to enable advanced monitoring?
Procedure:
Grant the
AliyunBailianFullAccessglobal management permission to the RAM user.Grant the
ModelMonitoring-FullAccess(orAdministrator) page permission to the RAM user to allow write operations on the monitoring page.Grant the AliyunCloudMonitorFullAccess system policy to the RAM user.
Create and grant a create service-linked role policy to the RAM user.
Log on to the RAM console. In the navigation pane on the left, choose , and then click Create Policy.
Click JSON. Paste the following content into the policy input box, and click OK.
{
    "Version": "1",
    "Statement": [
        {
            "Action": "ram:CreateServiceLinkedRole",
            "Resource": "*",
            "Effect": "Allow"
        }
    ]
}
Enter the policy name
CreateServiceLinkedRoleand click OK.In the left navigation pane, choose . Find the RAM user in the list and click Add Permission in the Actions column.
From the Policies list, select the CreateServiceLinkedRole policy that you created and click Grant permissions.
After you configure all the required permissions, return to the Monitoring (Singapore), Monitoring (Virginia), or Monitoring (Beijing) page and use the RAM user to retry enabling Advanced Monitoring.
How do I configure permissions for a RAM user to enable logging?
Procedure:
Grant the
AliyunBailianFullAccessglobal management permission to the RAM user.You can configure
Model Monitoring – Operations(oradministrator) page permissions for the RAM user to allow them to perform write operations on the Model Monitoring page.Grant the AliyunLogFullAccess system policy to the RAM user.
Create and grant a create service-linked role policy to the RAM user.
Log on to the RAM console. In the navigation pane on the left, choose , and then click Create Policy.
Click JSON. Paste the following content into the policy input box, and click OK.
{
    "Version": "1",
    "Statement": [
        {
            "Action": "ram:CreateServiceLinkedRole",
            "Resource": "*",
            "Effect": "Allow"
        }
    ]
}
Enter
CreateServiceLinkedRoleas the policy name and click OK.In the navigation pane on the left, choose . Find the RAM user in the list, click Add Permission in the Actions column.
From the Policies list, select the CreateServiceLinkedRole policy that you created and click Grant permissions.
After you configure all the required permissions, return to the Monitoring (Beijing) page, and use the RAM user to retry enabling Inference Logs.
Appendix
Glossary
Term | Explanation |
Real-time | All direct and indirect model calls, including:
|
Batches | Large-scale offline data processing (non-real-time scenarios) using the OpenAI compatible Batch (file input) API. |