The log management feature of Simple Message Queue (SMQ) pushes message request logs to Simple Log Service (SLS). You can then use SLS to query and analyze request logs to troubleshoot production issues.
Use cases
Common issues when sending and receiving messages:
-
A message is successfully sent to a queue, but the consumer client does not receive it. Where did the message go?
-
Who consumed a specific message? How many times was it consumed?
-
A consumer client crashes. When can a message that failed consumption be consumed again?
-
A message is published to a topic, but the endpoint hasn't received it after a long time. What is causing the delay?
Log management in SMQ addresses these issues:
-
Push logs to SLS and view the complete message trace in the console.
-
Use the query tool provided on the official website. You can specify parameters to view message processing logs.
Billing
-
SMQ does not charge extra fees for the log management feature.
-
When SMQ pushes logs to SLS, SLS charges you based on storage space, traffic, and request volume. Billing overview.
Queue log format
Queue message operations (send, consume, delete) generate log entries. The included fields vary by operation.
-
Log fields
Queue log entries can include the following fields.
Field
Description
Time
Operation timestamp.
MessageId
Unique message ID.
QueueName
Target queue name.
AccountId
Queue owner account ID.
RemoteAddress
Client IP address.
NextVisibleTime
When the message becomes visible again.
ReceiptHandleInRequest
ReceiptHandleprovided by the client.ReceiptHandleInResponse
ReceiptHandlereturned to the client.ProcessTime
Operation processing time.
RequestId
Request ID.
Action
The action, such as
DeleteMessageorSendMessage. -
Fields by operation
The following table shows which fields each operation includes.
Operation
Time
QueueName
AccountId
MessageId
RemoteAddress
NextVisibleTime
ReceiptHandleInResponse
ReceiptHandleInRequest
SendMessage/BatchSendMessage
Yes
Yes
Yes
Yes
Yes
Yes
No
No
PeekMessage/BatchPeekMessage
Yes
Yes
Yes
Yes
Yes
No
No
No
ReceiveMessage/BatchReceiveMessage
Yes
Yes
Yes
Yes
Yes
Yes
Yes
No
ChangeMessageVisibility
Yes
Yes
Yes
Yes
Yes
Yes
Yes
Yes
DeleteMessage/BatchDeleteMessage
Yes
Yes
Yes
Yes
Yes
Yes
No
Yes
Topic log format
Topic message operations (publish and push) generate log entries. The included fields vary by operation.
-
Log fields
Topic log entries can include the following fields.
Field
Description
Time
Operation timestamp.
MessageId
Unique message ID.
TopicName
Target topic name.
SubscriptionName
Subscription name.
AccountId
Topic owner account ID.
RemoteAddress
Client IP address.
NotifyStatus
Status code or error from the endpoint when SMQ pushes a message.
ProcessTime
Operation processing time.
MessageTag
Message tag.
RequestId
Request ID.
Action
The action, such as
PublishMessageorNotify. -
Fields by operation
The following table shows which fields each operation includes.
Operation
Time
MessageId
TopicName
SubscriptionName
AccountId
RemoteAddress
NotifyStatus
MessageTag
PublishMessage
Yes
Yes
Yes
No
Yes
Yes
No
No
Notify
Yes
Yes
Yes
Yes
Yes
No
Yes
Yes
-
NotifyStatus
The NotifyStatus field in push logs indicates why SMQ failed to deliver a message. Troubleshoot based on the following values.
Error code
Description
Recommended action
2xx
The message was pushed successfully.
None.
Other HTTP status codes
Endpoint returned a non-2xx status code.
Check the processing logic at your endpoint.
InvalidHost
Invalid subscription endpoint.
Verify that the subscription endpoint is valid and accessible with
curlortelnet.ConnectTimeout
Connection to the subscription endpoint timed out.
Verify that the subscription endpoint is accessible with
curlortelnet.ConnectFailure
Connection to the subscription endpoint failed.
Verify that the subscription endpoint is accessible with
curlortelnet.UnknownError
An unknown error occurred.
Contact SMQ technical support.
Log operations
Before you use log management, ensure the following:
-
Create a queue and a topic in SMQ. Manage queues. Manage topics.
-
Create a project and a Logstore in SLS. Manage a Project. Create a Logstore.
Operation logs for your SMQ service can be pushed only to an SLS Project in the same region.
-
Authorize SMQ to export logs with the
AliyunMNSLoggingRoleRAM role.Click Cloud Resource Access Authorization and follow the on-screen instructions to complete the authorization.
WarningDo not revoke the authorization or delete the RAM role. Otherwise, SMQ logs cannot be pushed to SLS.
Enable or disable logging
Enable or disable queue logging
Log on to the SMQ console.
-
In the left-side navigation pane, click Queues.
-
In the top menu bar, select a region.
-
On the Queues page, find the target queue. In the Actions column, choose
 > Edit.
 -
In the Edit Queue Parameters panel, turn the Enable Logging switch on or off.
On the Queues page, the Logging column for the target queue displays Enabled or Disabled.
Enable or disable topic logging
Push logs to SLS
View logs
Log on to the Simple Log Service console.
In the Projects section, click the one you want.

-
On the Log Storage > Logstores tab, click the target Logstore.

-
Enter a query statement and click Last 15 Minutes to set the time range. Quick start for search and analysis.
Log analysis examples
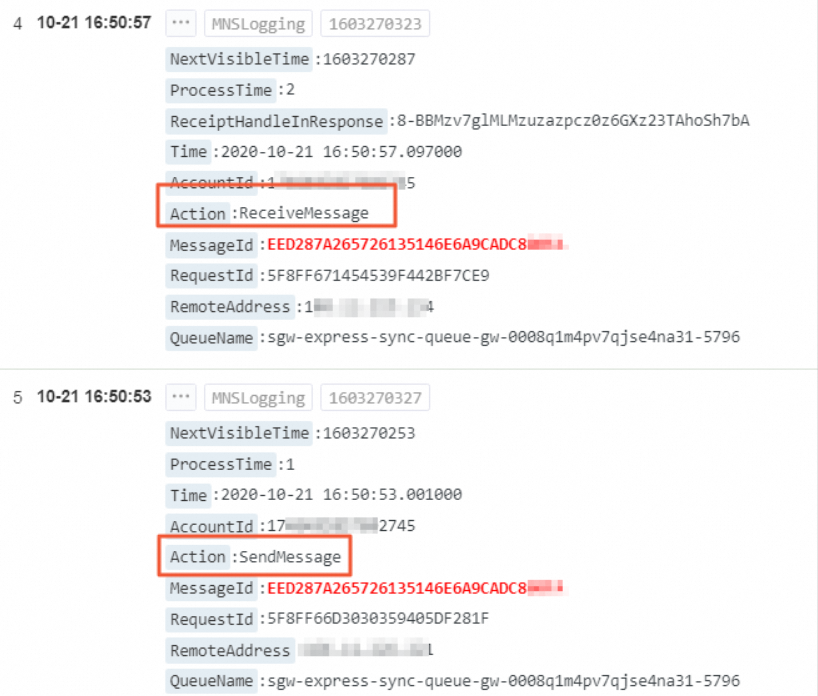
Query queue message trace
To trace a queue message, query by queue name and message ID: $QueueName and $MessageId. For example: log and EED287A265726135146E6A9CADC8XXXX.
The result shows the message lifecycle from send to receive.
Query topic message trace
To trace a topic message, query by topic name and message ID: $TopicName and $MessageId. For example: logtest and 8798453B65727FC6433E6AB4F746XXXX.
The result shows the message lifecycle from publish to notify.
Query sent queue messages
To query messages sent to a queue, use the queue name and send operation: $QueueName and (SendMessage or BatchSendMessage). For example: log and (SendMessage or BatchSendMessage).
The following result shows that a producer sent three messages to the log queue within the specified time range.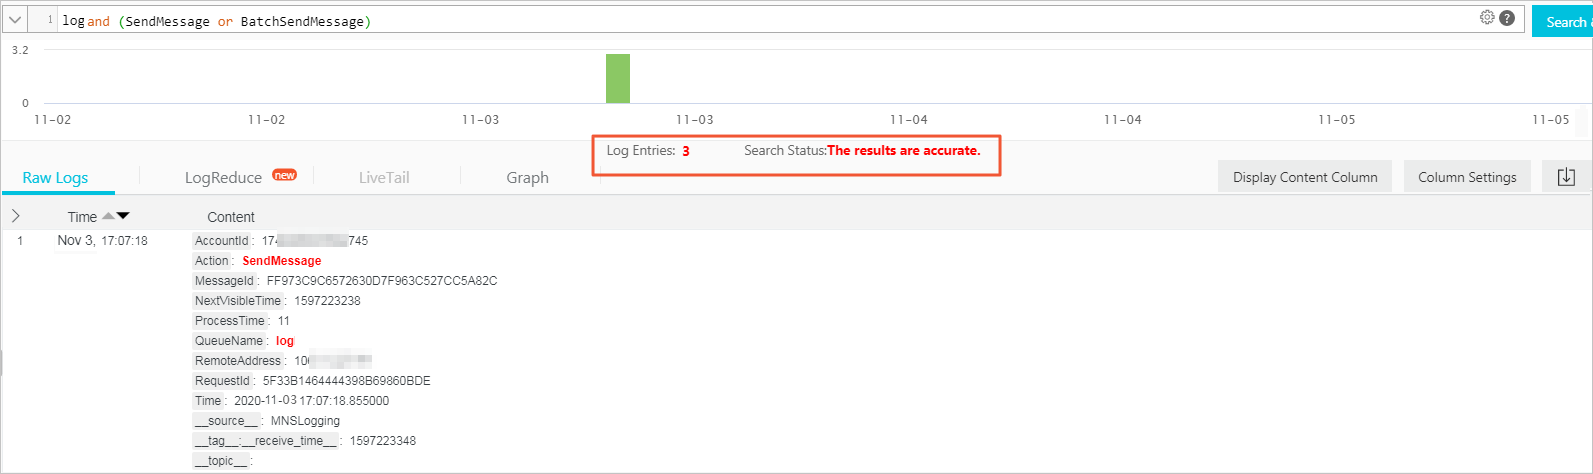
Query published topic messages
To query messages published to a topic, use the topic name and publish operation: $TopicName and PublishMessage. For example: logtest and PublishMessage.
The following query result shows that three messages were published from a producer to the logtest topic within the specified time range.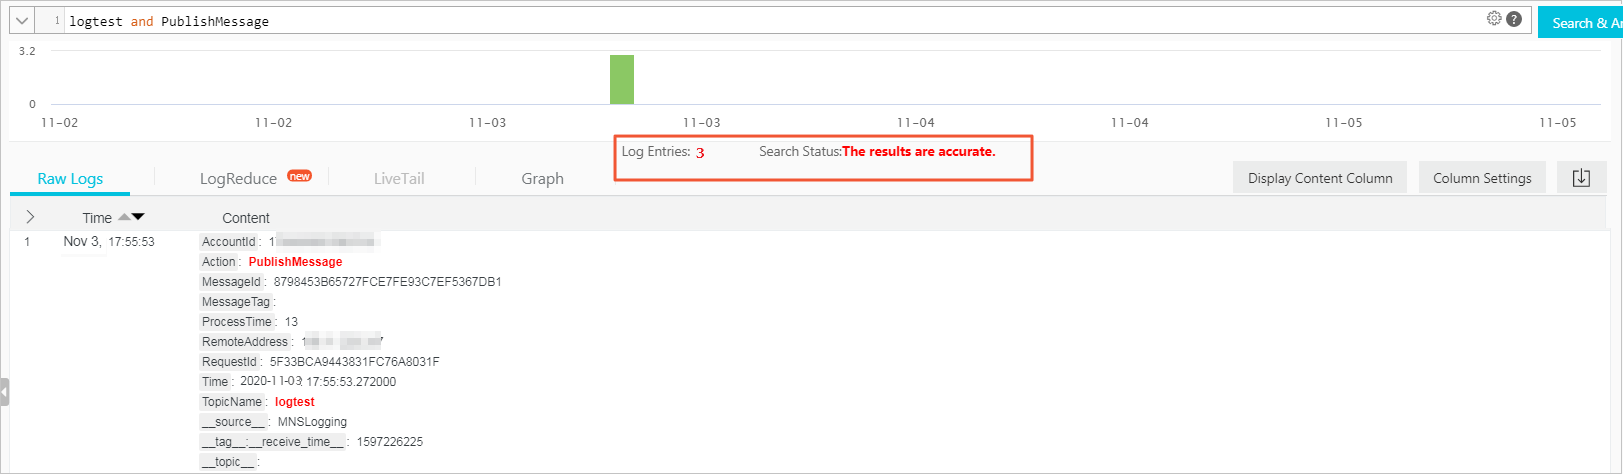
Query consumed queue messages
To query messages consumed from a queue, use the queue name and consume operation: $QueueName and (ReceiveMessage or BatchReceiveMessage). For example: log and (ReceiveMessage or BatchReceiveMessage).
The following query result shows that 12 messages were consumed from the log queue within the specified time range.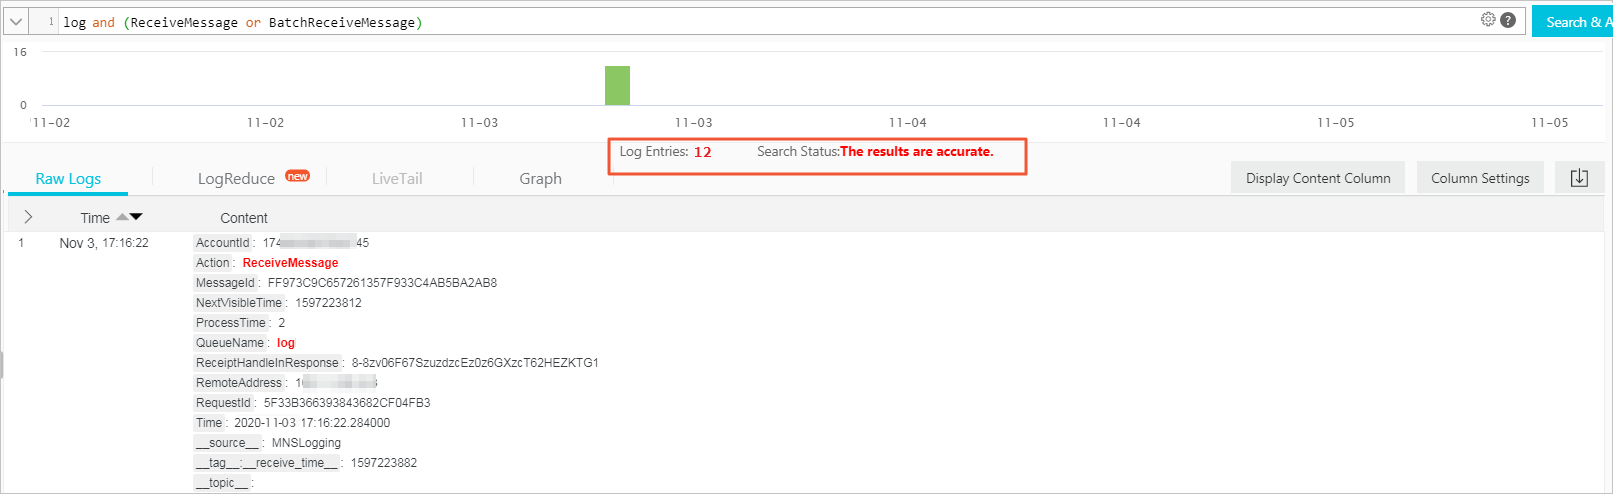
Query deleted queue messages
To query messages deleted from a queue, use the queue name and delete operation: $QueueName and (DeleteMessage or BatchDeleteMessage). For example: log and (DeleteMessage or BatchDeleteMessage).
The following query result shows that 61 messages were deleted from the log queue within the specified time range.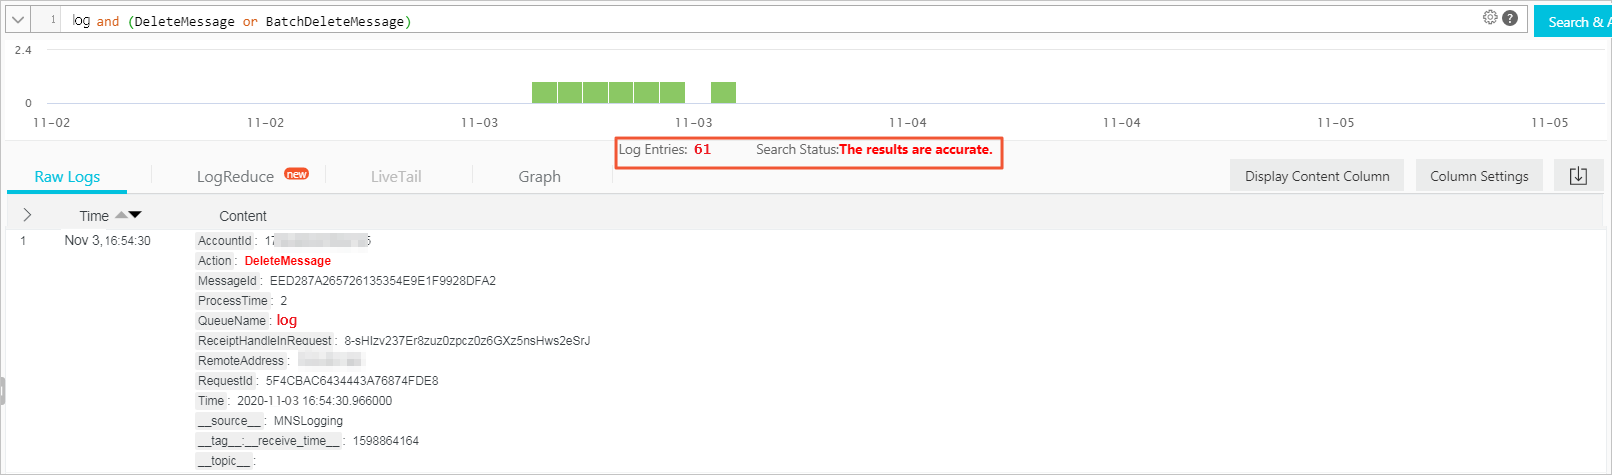
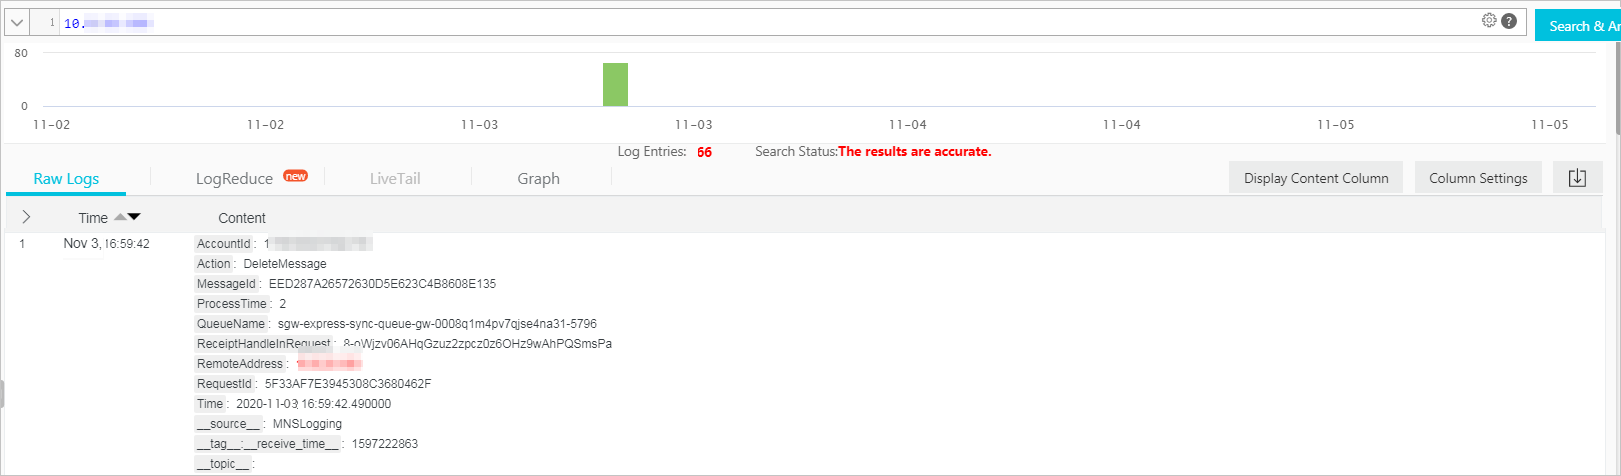
Query messages by client
To query messages processed by a specific client, use the client IP address: $ClientIP. For example: 10.10.10.0.
To filter by operation type, combine keywords. For example: $ClientIP and (SendMessage or BatchSendMessage).
The following query result shows that the client processed 66 messages within the specified time range.