Simple Log Service provides dashboards as a visualization tool to display query and analysis results in charts, such as column charts, line charts, and pie charts. You can use dashboards to monitor the status of systems, applications, and services. This topic describes how to create a dashboard.
Procedure
This section describes how to create a dashboard based on a Classic Load Balancer (CLB) access log to monitor page view (PV) trends by request method. You can add a request method filter to view the PV trends for each request method. For more information, see Access logs. Sample log:
{
    "body_bytes_sent": "1346",
    "client_ip": "118.*.*.125",
    "host": "www.*.*.com",
    "http_host": "www.*.*.com",
    "request_length": "15**",
    "request_method": "PUT",
    "request_time": "26",
    "scheme": "https",
    "slbid": "slb-02",
    "status": "200",
    "upstream_addr": "133.*.*.113",
    "upstream_response_time": "18",
    "upstream_status": "200",
    "vip_addr": "39.*.*.121",
    "__pack_meta__": "1|MTcyNDE*==|120|119",
    "__topic__": "slb_layer7",
    "__source__": "127.0.0.1",
    "__tag__:__receive_time__": "1725349464",
    "__tag__:__receive_time___0": "1725349464",
    "__time__": "1725349464"
}
To create a dashboard in Simple Log Service, you need to only perform the following steps:
Add a dashboard: Add a dashboard in the Simple Log Service console. You can add multiple charts to the dashboard.
Add a chart: Add a chart to the dashboard to display the results of your query statement.
Add a filter: Add a filter and specify filter conditions. You can filter data based on the field that you specify in your query statement.
1. Add a dashboard
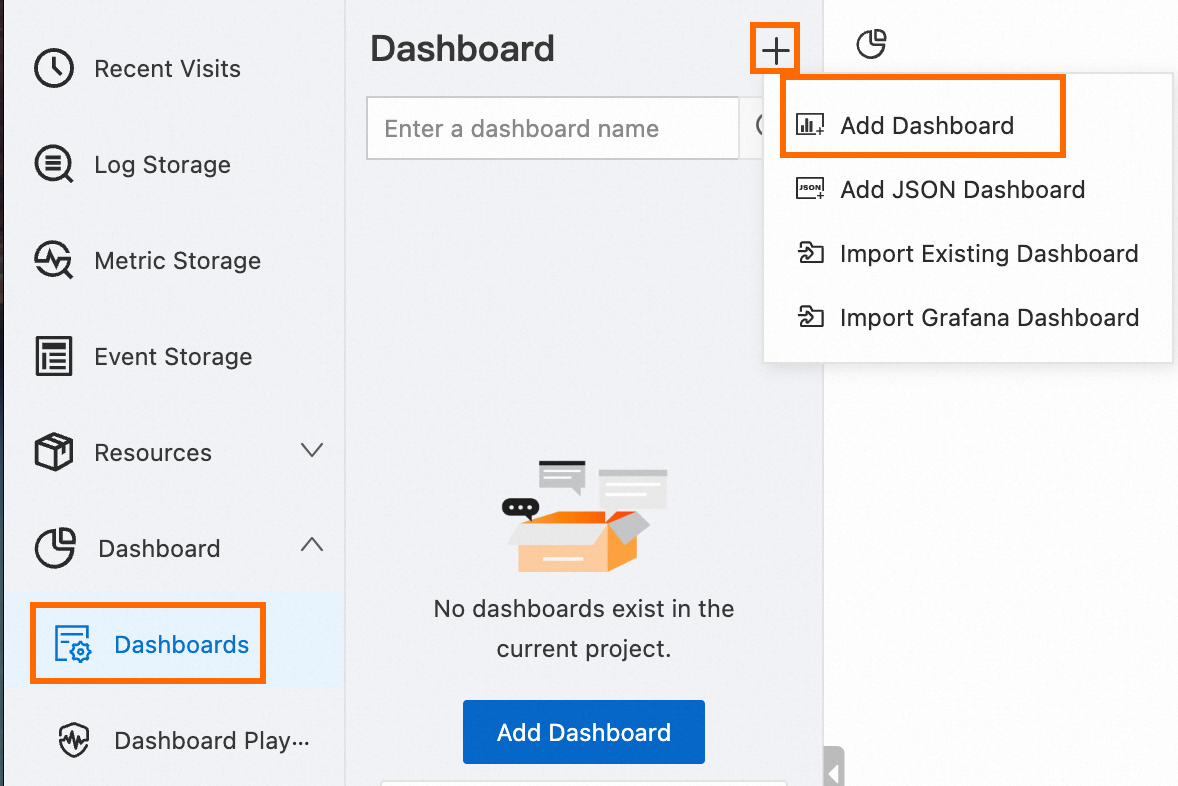
Log on to the Simple Log Service console. Click the project that you want to manage. In the left-side navigation pane of the page that appears, choose Dashboard > Dashboards. Then, add a dashboard.
2. Add a chart
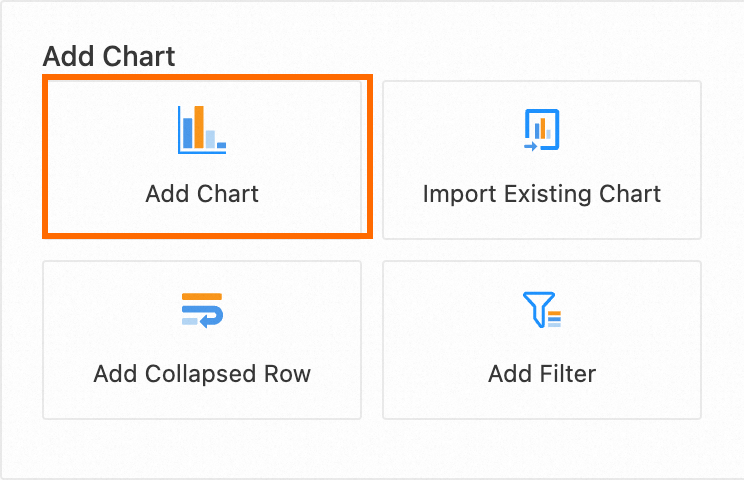
Click Add Chart.
Configure and save a chart.
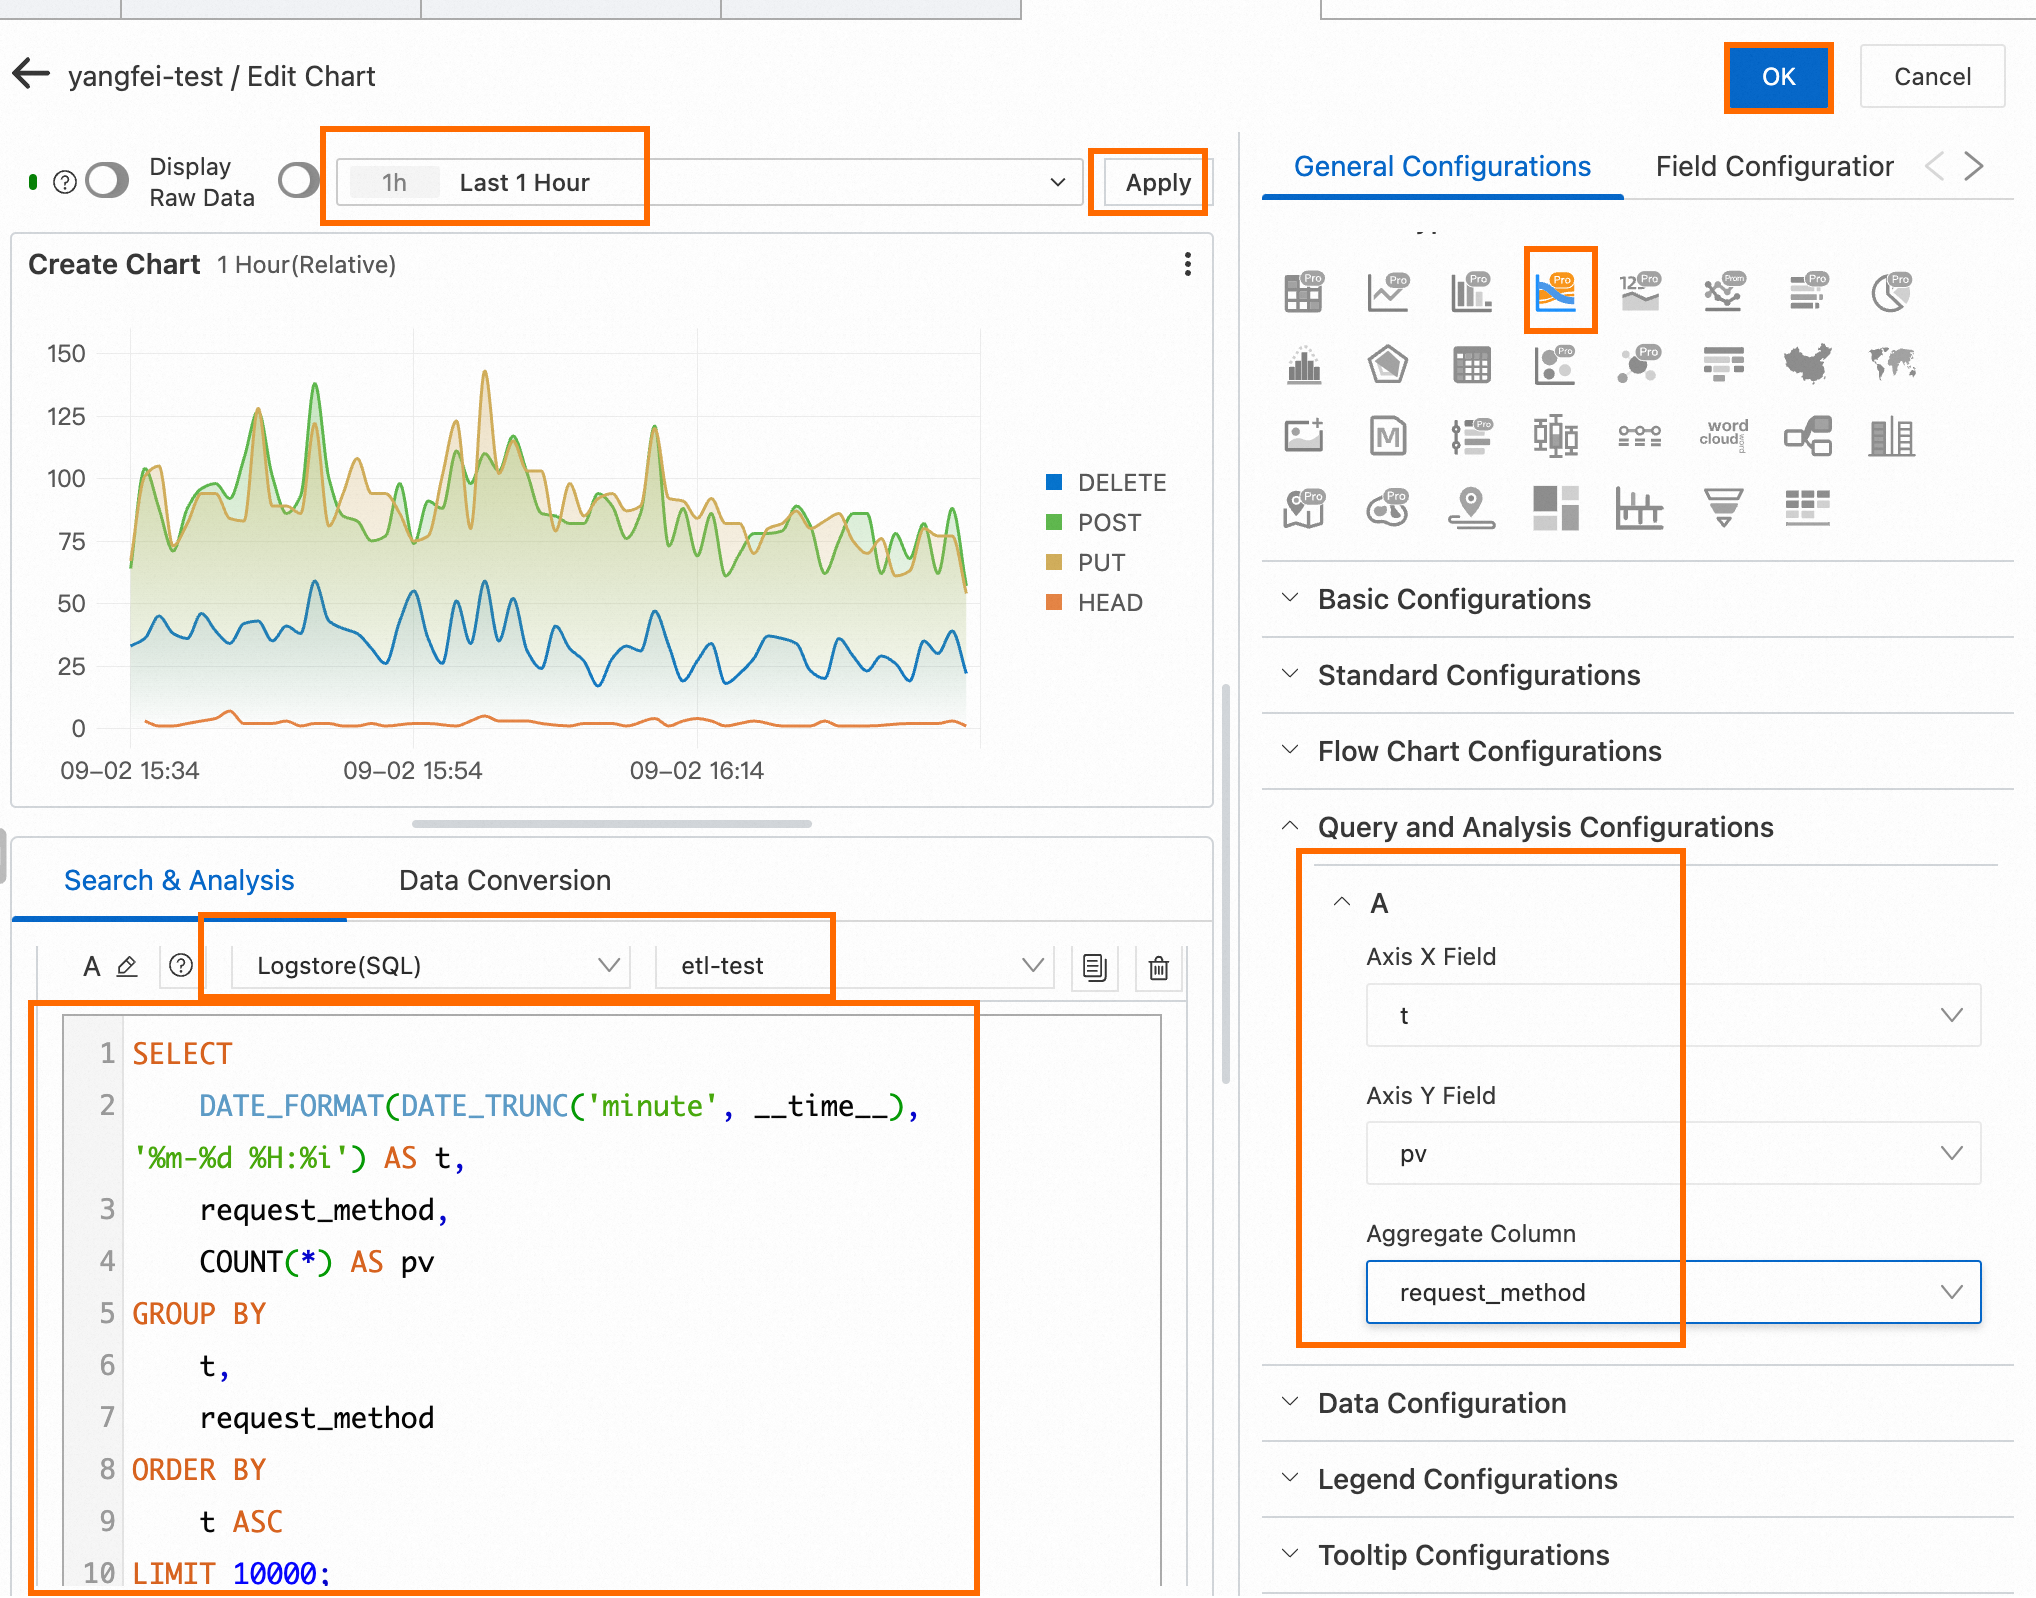
On the left side of the page that appears, configure the query time range, Logstore, and query statement for the chart.
On the right side of the page that appears, select a chart type in the Chart Types section and configure the Axis X Field, Axis Y Field, and Aggregate Column parameters in the Query and Analysis Configurations section. After you complete the configuration, click Apply in the upper part of the page to view the configuration effects of the chart. Then, click OK in the upper-right corner of the page to save the chart.
Query statement:
SELECT
    DATE_FORMAT(DATE_TRUNC('minute', __time__), '%m-%d %H:%i') AS t,
    request_method,
    COUNT(*) AS pv
GROUP BY
    t,
    request_method
ORDER BY
    t ASC
LIMIT 10000;
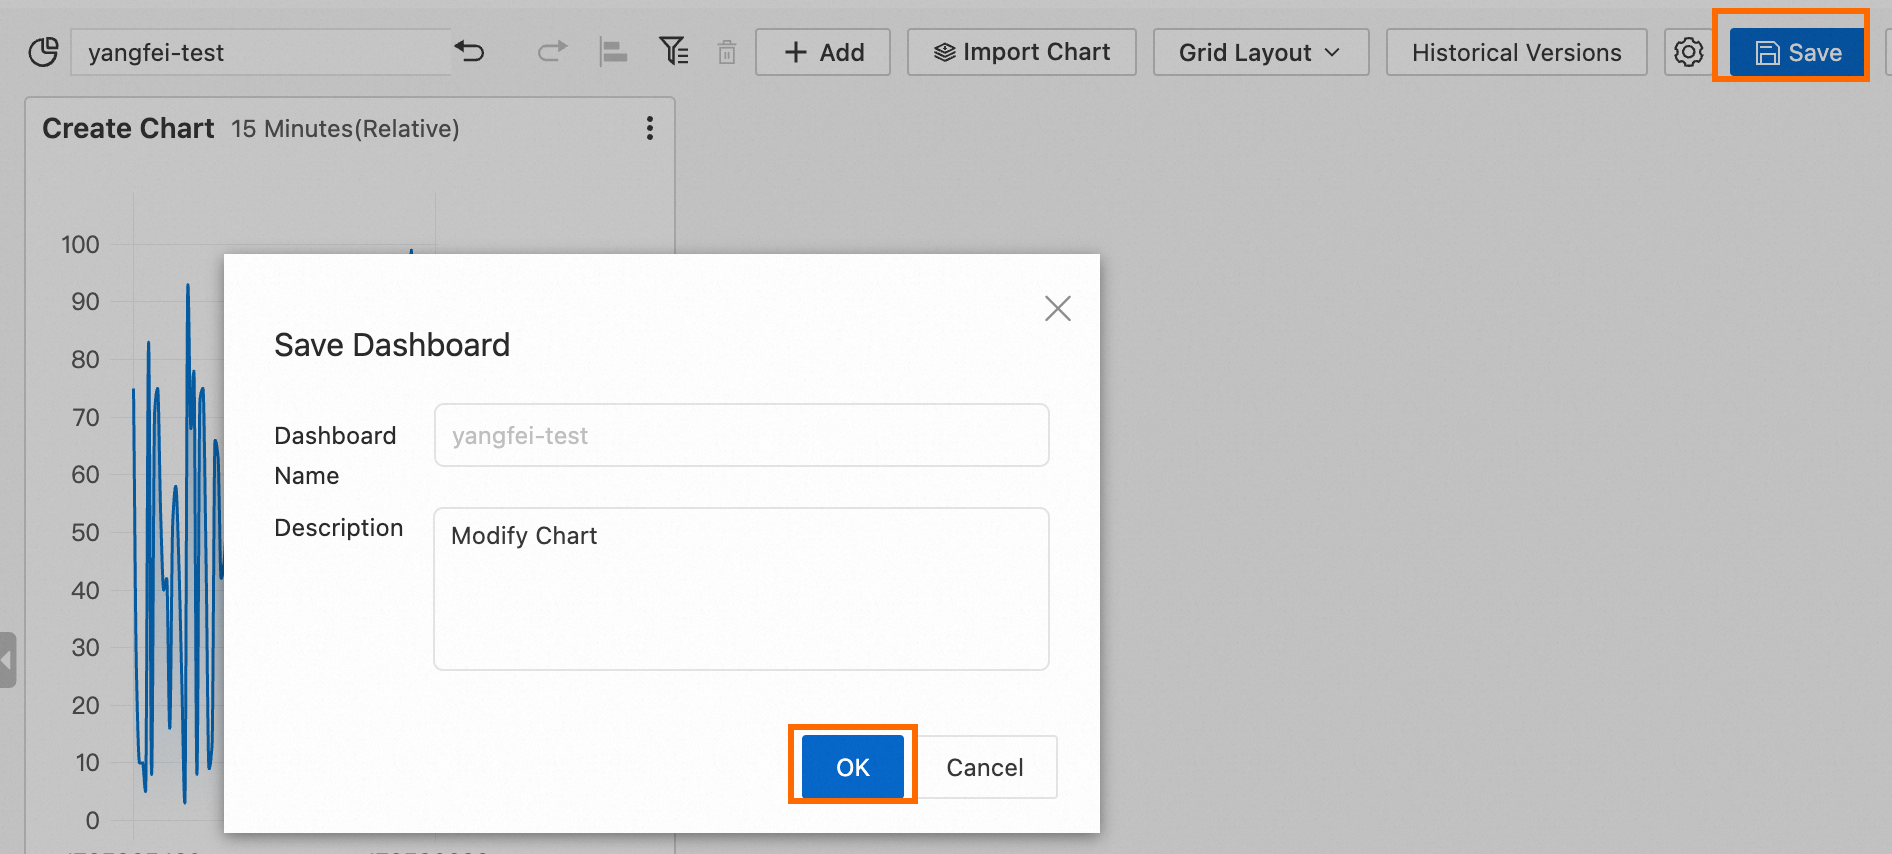
Click the chart and drag the lower-right corner of the chart to adjust the size of the chart. Then, click Save in the upper-right corner of the page to save the chart.
3. Add a filter
The chart displays PV trends for all request methods. If you want to view the PV trends for a specific request method, you can add a filter and select the required field from the filter drop-down list. You do not need to modify the specified query statement.
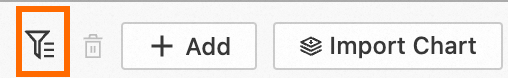
In the upper-right corner of the dashboard page, click Edit to enter the edit mode. Click the filter icon in the top navigation bar.
Configure a filter.
A filter searches for logs that contain the specified
key-valuepair in the results of the specified query statement. To view the PV trends for thePOSTrequest method, you can configure a filter to search for logs that containrequest_method:POSTin the results of the specified query statement.In the Filter panel, specify
request_methodfor the Key Value parameter as the filter condition. Then, turn on Add Dynamic List Item and specify the*|select distinct request_methodquery statement in the Search & Analysis field to query the values of therequest_methodfield. You can select the values from the filter drop-down list.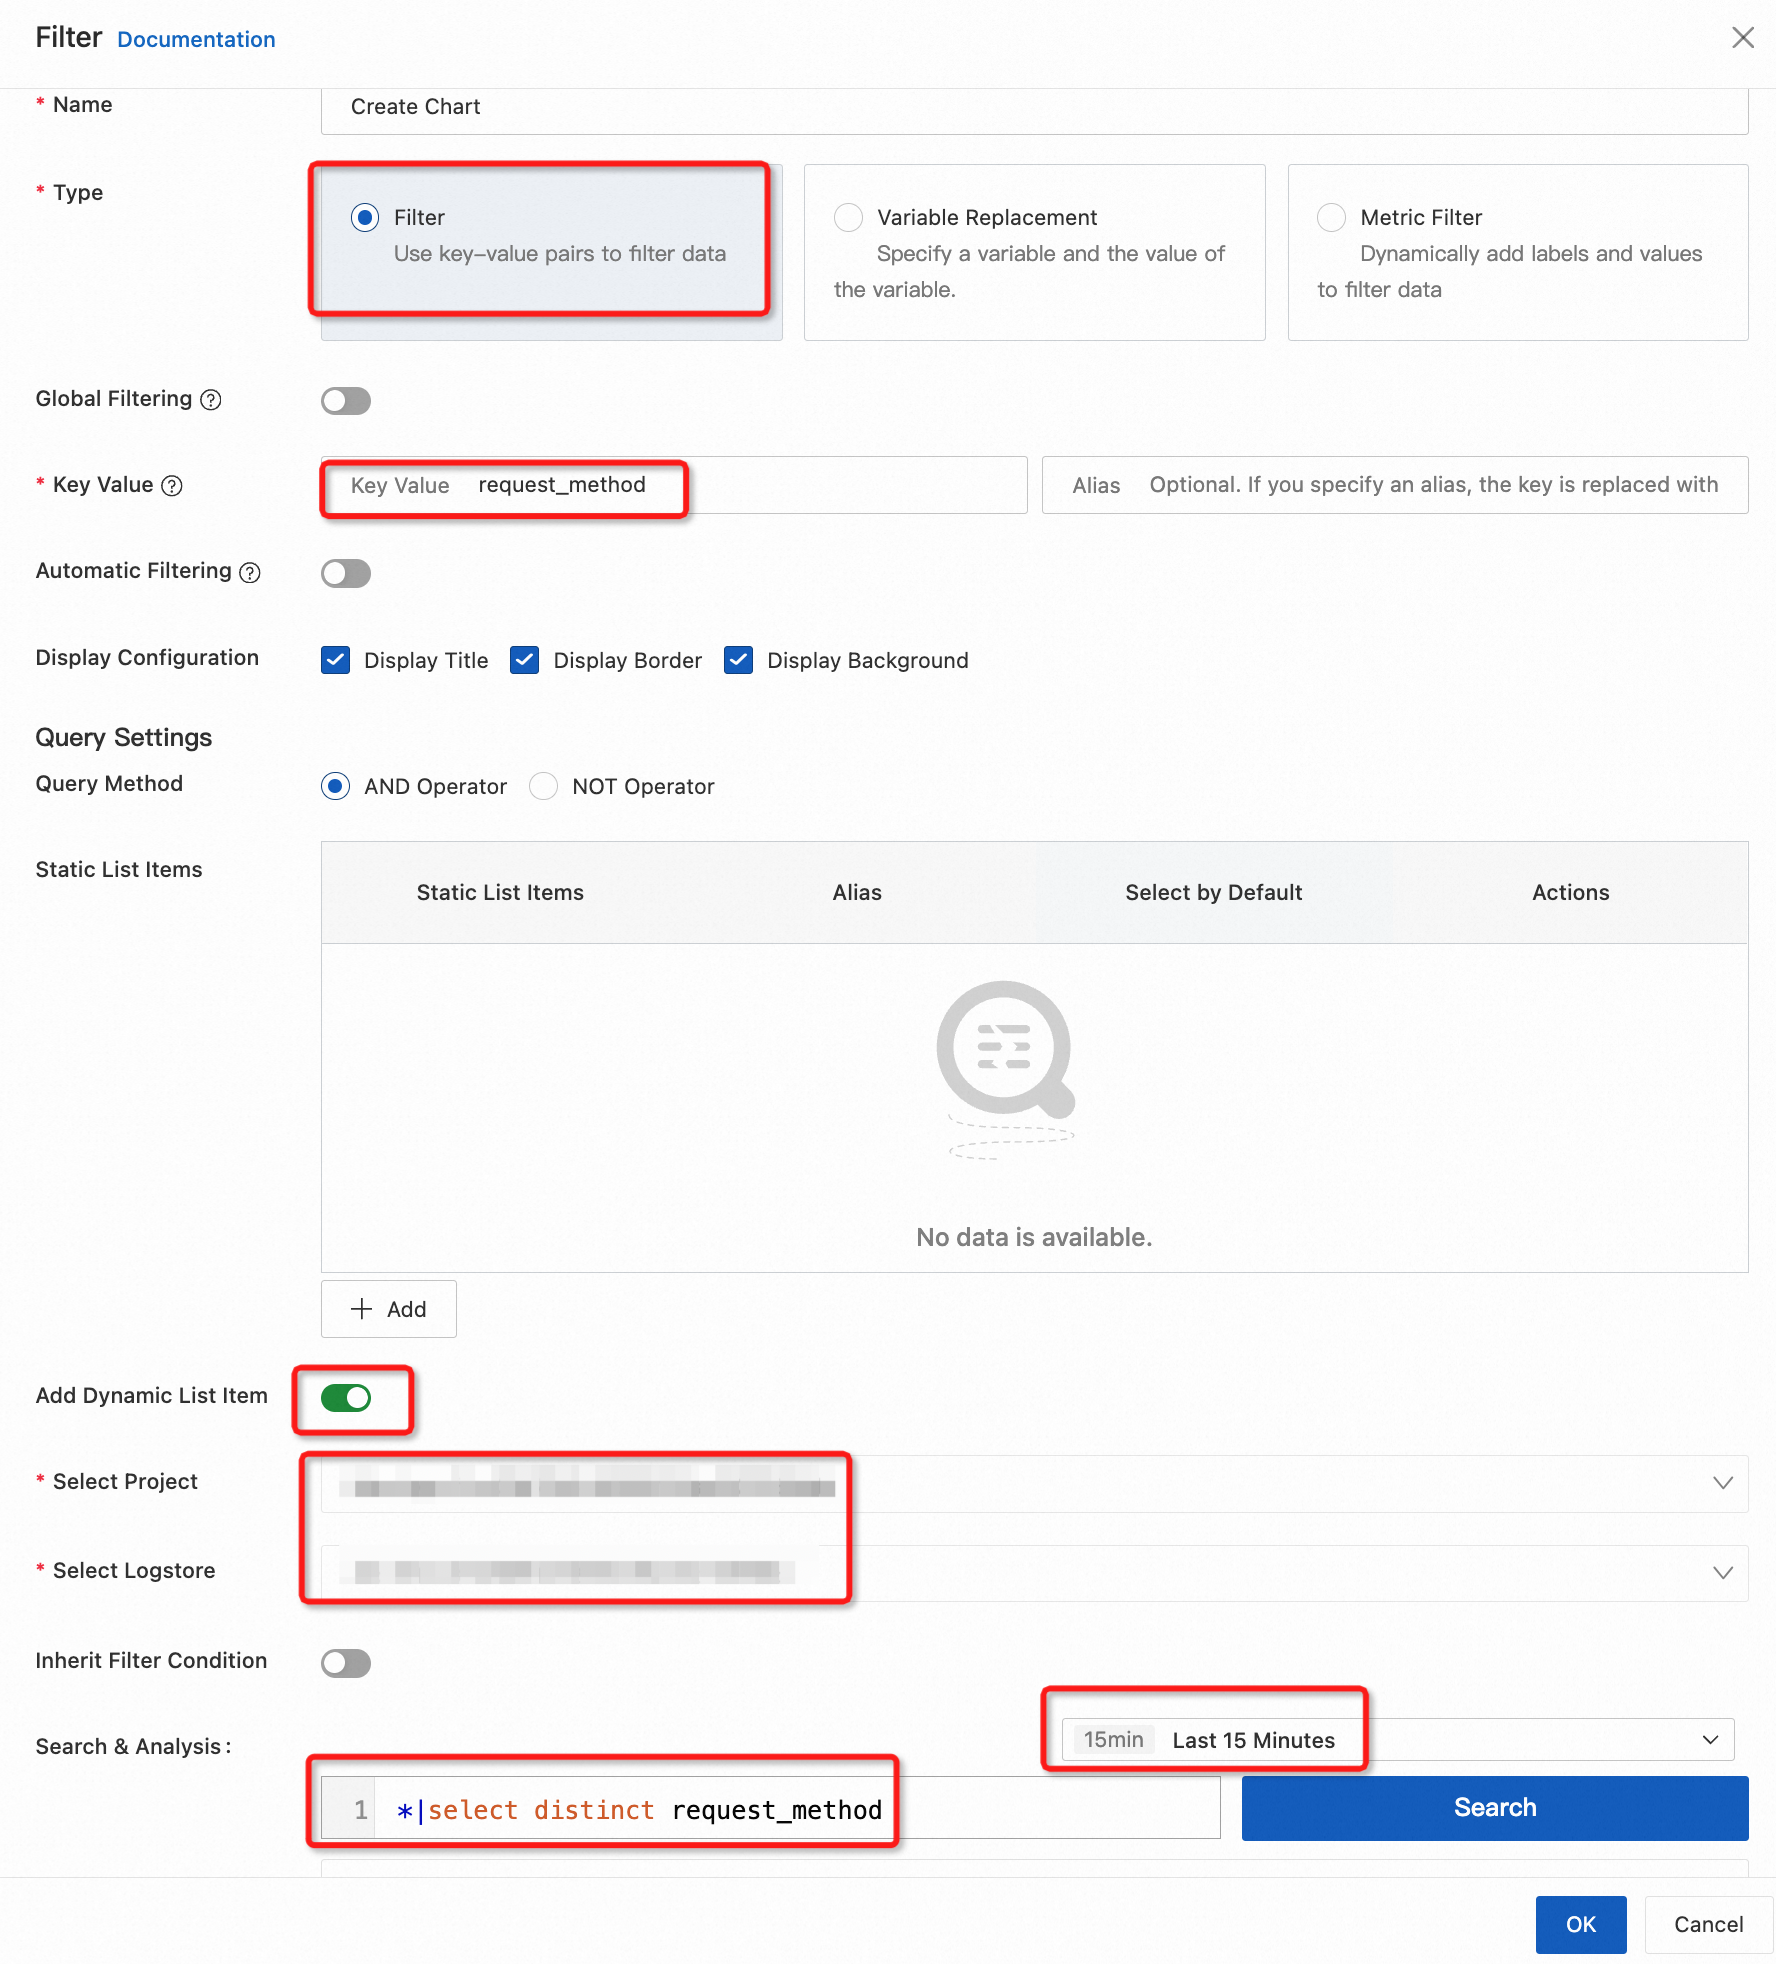
Click Save in the upper-right corner of the dashboard page.
Select the
POSTrequest method from the filter drop-down list. Then, the chart displays the PV trends for the POST request method.
References
This topic describes how to add a single chart to a dashboard. You can also add multiple charts to a dashboard. This way, you can view the charts in a centralized manner. For more information about how to configure a dashboard and different types of charts, see Monitor and visualize data.
After you create a dashboard, you can share the dashboard page with a DingTalk account, a WeCom account, or an Alibaba Cloud account. You can also provide a shared URL of the page to allow password-free access to the page in a browser. For more information, see Share and integrate dashboard pages in password-free mode.
When an anomaly is detected on a dashboard, you can configure an interaction occurrence to perform drill-down analysis in an efficient manner. For example, you can select Open Logstore, Open Trace Analysis, or Open Dashboard from the Add Event drop-down list to configure an interaction occurrence and identify the root cause of the anomaly. For more information, see Perform drill-down analysis on dashboards to troubleshoot errors.
Dashboards are expected to help users identify abnormal metrics in charts at the earliest opportunity. You can specify thresholds and background colors for charts on a dashboard. You can also configure alert rules for charts. For more information, see Use dashboards to identify abnormal metrics