To identify the root cause of an exception on a dashboard, use an interaction occurrence to perform a quick drill-down analysis, such as querying a Logstore, performing Trace Analysis, or opening another dashboard. This topic describes the supported types of interaction occurrences and how to configure them for a dashboard.
How it works
To investigate an issue on a dashboard, use interaction occurrences for quick drill-down analysis. For example, you can Open Logstore, Open Dashboard, Open Saved Search, Create Custom HTTP URL, Open Trace Details, or Open Full-stack Observability Trace Details.
This example uses Nginx access logs. When you click the section of the pie chart that represents a status of 200, you are directed to the corresponding Logstore to query logs with that status. The query uses the same time range as the dashboard.
-
Add a request status pie chart: Configure the query time range, Logstore, and query statement.
-
Add an interaction occurrence to the request status pie chart: Set the interaction occurrence for the PV field on the dashboard to Open Logstore. Then, add the Use variables to dynamically modify the parameters of a query statement
${{status}}variable to query logs in the Logstore based on the status selected from the dashboard.
Simple Log Service supports the following interaction occurrences. For configuration instructions, see the end of this topic.
Open LogStore
Open dashboard
Custom HTTP URL
Saved search
Trace analysis
Trace details
Full-stack observability trace analysis
Full-stack Observability trace
Procedure
Example 1: Open Logstore event
1. Add a request status distribution chart
1.1 Add a dashboard
-
Log on to the Simple Log Service console, select the target project, and on the Dashboard > Dashboards page, create a dashboard named Request Status Distribution Chart.
Click the + icon in the upper-right corner and select Add Dashboard from the dropdown menu.
1.2 Add a chart
-
To add a chart, click Add Chart.
-
Configure and save the chart:
-
In the left pane, configure the query time range, Logstore, and query statement.
-
In the right pane, configure the chart type, category, and value column. Click Apply at the top of the page to preview the chart, and then click OK to save it.
* |
select
  count(1) as pv ,status
group by
  status
-
2. Add an interaction event
After configuration, clicking a status code such as 200 on the dashboard redirects you to the Logstore to query logs where the status is 200. The query time range in the Logstore matches the dashboard's time range.
2.1 Add an interaction event to a field
-
In the right pane, on the Interaction Occurrences tab, click Add Field and select a field from the dropdown list.
For example, select A > pv.
-
Click Add Event, select Open Logstore from the dropdown list, and configure the Logstore and dynamic variables in the dialog box.
The Logstore serves as the query destination. The time range defines the query period, and the filter statement is the query to be executed.
In the dialog box, you must also specify a Custom Name, select a project such as
nginx-dashboard, and optionally toggle the Open in New Window switch.
2.2 Save the chart and dashboard
-
In the upper-right corner of the Edit Chart page, click OK.
-
In the upper-right corner of the dashboard edit page, click Save.
2.3 Verify the interaction event
On the chart, click the data point for the 200 status, and then click Open Logstore. You are redirected to the Logstore where the query statement is status: 200 and the query time is Two Days Before, matching the time range selected in the dashboard.
Example 2: Open Dashboard event
This example uses NGINX access logs collected in a Logstore named website_log. You will create two dashboards, RequestMethod and destination_drilldown, and set up an interaction between them.
-
On the RequestMethod dashboard, add a table that categorizes request methods and configure an interaction occurrence to open the destination_drilldown dashboard.
-
On the destination_drilldown dashboard, add a line chart that shows the PV trend over time.
After you complete the configuration, you can click a request method on the RequestMethod dashboard to navigate to the destination_drilldown dashboard and view the corresponding PV trend.
-
On the destination_drilldown dashboard, add a line chart to show the PV trend over time.
The query statement is as follows, where
${{method|PUT}}is a variable. For more information, see Add a chart to a dashboard.request_method: ${{method|PUT}} | SELECT __time__ - __time__ %60 AS time, COUNT(1) AS PV GROUP BY time ORDER BY time -
On the RequestMethod dashboard, add a table that categorizes request methods and configure an interaction occurrence.
The query statement is as follows. For more information, see Add a chart to a dashboard.
Select website_log as the data source, enter the query statement
*|SELECT request_method, COUNT(1) AS count GROUP BY request_method ORDER BY count DESC LIMIT 10, and then on the Interaction Occurrences tab, add the Open Dashboard action for the request_method field.Example configuration:
-
Set Select Dashboard to destination_drilldown.
-
Set Dynamic Variable Name to method and select the request_method column.
Select Open Dashboard as the interaction occurrence type and enable the Inherit Variable switch.
-
-
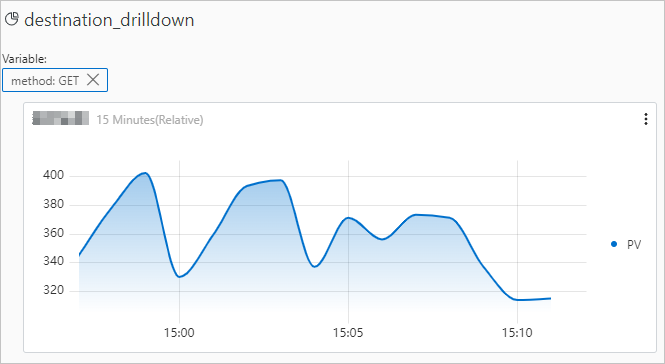
Verify the result.
In the table on the RequestMethod dashboard, click GET and then click Open Dashboard. This action redirects you to the destination_drilldown dashboard.
The destination_drilldown dashboard displays the PV trend over time for GET requests.