This topic describes the features and use cases of the live monitoring system and how to manage monitoring sessions in the ApsaraVideo Live console.
Overview
You can use the live monitoring feature of ApsaraVideo Live to monitor the quality of live events in real time. The system automatically triggers alerts for issues such as fluctuations in frame rate and bitrate, asynchronous audio and video, high latency, and playback stuttering.
Key features
The live monitoring system allows you to monitor 4, 8, or 12 live streams in split screens at the same time.
The information about a live stream such as the frame rate and bitrate is displayed in real time.
Real-time alerts are triggered when exceptions occur, such as frame rate exceptions, bitrate exceptions, audio and video synchronization issues, stuttering, and high latency.
Use cases
Video platforms: The live monitoring system provides monitoring for different types of live events, especially major live events and sessions.
Enterprise services: You can monitor multiple live sessions at the same time to ensure the continuity of live events for enterprise customers.
Organization services: You can monitor multiple live sessions at the same time to ensure the continuity of daily live events for streamers.
Usage notes
Live monitoring is a paid feature. For billing details, see Billing of live monitoring.
Live monitoring is available only in specific regions. For more information, see Supported regions. By default, you can create up to 20 monitoring sessions in a region.
Prerequisites
Make sure that you configure cross-origin resource sharing (CORS) and an HTTPS certificate for the streaming domain of the monitored streams.
Configure CORS: Add the Access-Control-Allow-Origin header and set the Header value to
https://live.console.alibabacloud.com. For more information, see Configure HTTP Headers.Configure an HTTPS certificate: For more information, see Configure HTTPS secure acceleration.
Console procedure
Log on to the ApsaraVideo Live console.
In the left-side navigation pane, choose Live Monitoring.
On the Live Monitoring page, select a region and click Add Session.
Parameter
Description
Output Configurations
Session Name
Enter a session name.
Output Resolution
Select an output resolution from the drop-down list. Multiple resolutions for landscape and portrait orientations are supported.
Live Center
Select the live center in the region that you selected.
Source Domain Name
Select a domain name from the drop-down list. The domain name is used to play the monitored streams. If no domain names are available, click Add below the drop-down list to add a domain name. For more information, see Add an accelerated domain name.
Stream Configurations
Stream for Monitoring
You can add streams manually, select streams under a domain, or batch upload streams. You can add up to 12 streams.
Click Add Manually. Enter a stream name in the Stream Name field and a URL in the Stream URL field. You can sort and delete the streams that you add.
Click Select from ApsaraVideo Live Console. Select a domain name from the Domain Name drop-down list and then select the live streams that you want to monitor.
Click Batch Upload to upload multiple streams at the same time.
Notification Configurations
Notification Method
Monitoring Callbacks: Enter a callback URL in the HTTP or HTTPS format.
DingTalk Alerts: Enter the URL of a DingTalk chatbot in the HTTP or HTTPS format. You must specify a DingTalk chatbot that you configured to send you live monitoring alerts. For more information, see Configure a custom chatbot.
ImportantSpecify "Alert" as the custom keyword of the DingTalk chatbot. Otherwise, you cannot receive messages from the chatbot.
Advanced Settings
Video Frame Rate Alert Threshold: An alert is triggered when the video frame rate of the monitored stream falls below the product of the threshold and the original frame rate. This parameter is a scale factor. Valid values: (0.0,1.0].
Audio/Video Bitrate Alert Threshold: An alert is triggered when the audio/video bitrate of the monitored stream is greater than the product of the threshold and the original bitrate. This parameter is a scale factor. Valid values: (0.0,100].
Interruption Duration Alert Threshold: An alert is triggered when the monitored stream is interrupted for a period of time that is longer than the threshold. Valid values: integers within the range of (0,65535].
Click OK. The Monitoring Session page appears.
Start monitoring.
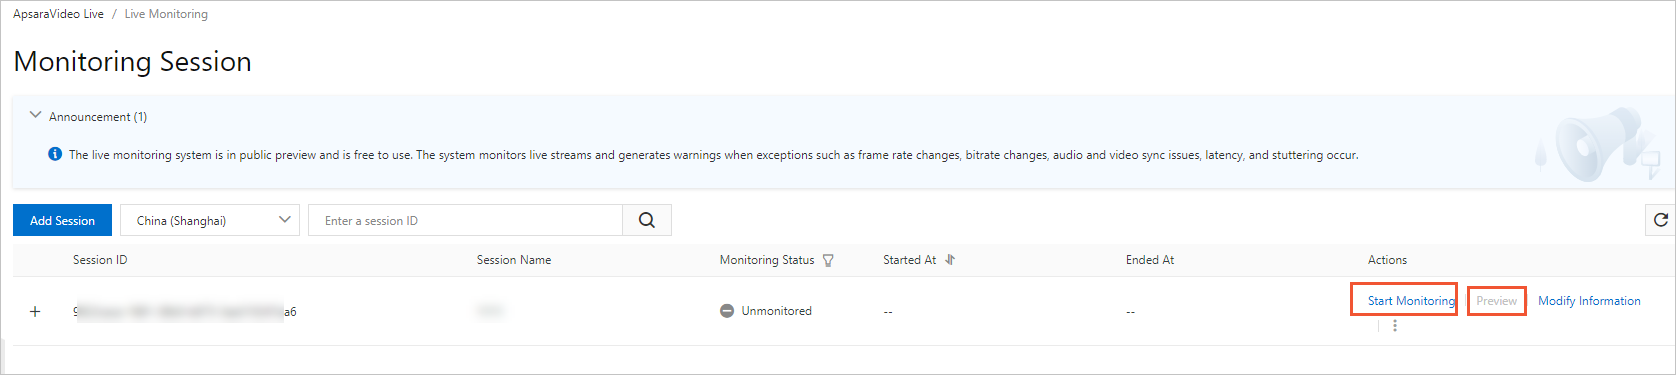
On the Monitoring Session page, find the session that you added and click Start Monitoring in the Actions column. After monitoring starts, you can click Preview to go to the monitoring page.
ImportantAfter you close the monitoring page, the Monitoring Status column still displays Monitoring and billing continues. To stop monitoring and avoid unnecessary fees, click Stop Monitoring in the Actions column.
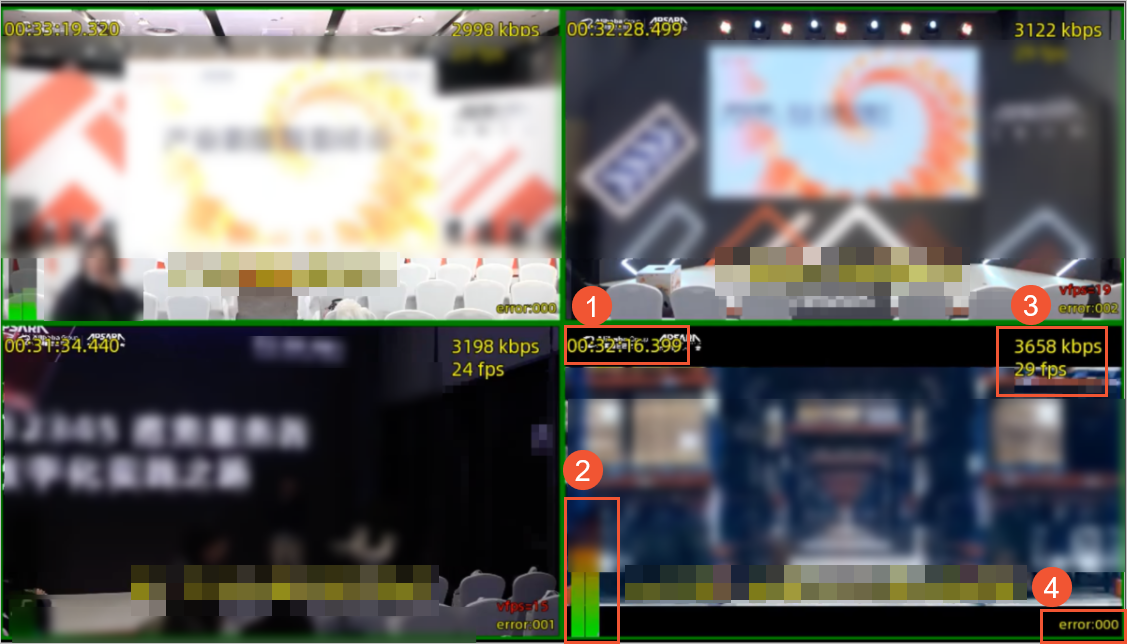
Explore the monitoring preview area.
No.
Description
①
The timestamp of the live stream. The timestamp is displayed in the upper-left corner of each split screen.
②
The audio volumes, including the volume for the left sound channel and the volume for the right sound channel. The volumes are adjusted by using peak normalization. The volumes are displayed in the lower-left corner of each split screen.
③
The real-time frame rate and bitrate that are displayed in the upper-right corner of each split screen.
④
The alert information that is displayed in the lower-right corner of each split screen.
Supported alert types:
vfps: an alert that indicates video frame rate exception.
afps: an alert that indicates audio frame rate exception.
br: an alert that indicates bitrate exception.
eof: an alert that indicates traffic interruption.
a-v: an alert that indicates audio and video out of sync.
wc: the total number of alerts.
⑤
The audio quality that is displayed in the lower-left corner of each split screen.
Supported values for audio quality:
poor: poor audio quality.
normal: normal audio quality.
good: good audio quality.
API references
You can call the following API operations to access and use live monitoring:
Call CreateLiveStreamMonitor to create a monitoring session.
Call StartLiveStreamMonitor to start live monitoring.
Call StopLiveStreamMonitor to stop live monitoring.
Call DeleteLiveStreamMonitor to delete a monitoring session.
Consultation
If you encounter any problems or have any suggestions when using live monitoring, join the DingTalk group 35080444 and feel free to contact us in the group.