This topic describes the core features and use cases of live monitoring and explains how to add and manage monitoring sessions in the ApsaraVideo Live console.
Overview
The live monitoring feature of ApsaraVideo Live ensures stable and high-quality streaming for professional live events. It monitors your live streams in real time and uses visual dashboards and proactive alerts to help you quickly detect and resolve issues during a broadcast.
Core features
-
Multi-stream viewing: Monitor up to 12 live streams simultaneously on a single screen. Choose from 4-pane, 8-pane, or 12-pane layouts for centralized management.
-
Real-time data overlay: View key performance indicators (KPIs) such as frame rate, bitrate, and audio levels, overlaid in real time on each video for detailed, data-driven monitoring.
-
Intelligent anomaly alerts: Receive immediate alerts when the system detects issues, such as fluctuations in frame rate or bitrate, audio-video desynchronization, stuttering, high latency, or stream interruptions.
Use cases
-
Video platforms: Provide professional monitoring for major events and tournaments to ensure broadcast quality.
-
Enterprise services: Support concurrent monitoring for multiple sessions to ensure stability for corporate events like online product launches and webinars.
-
Agency services: Enable multi-channel network (MCN) agencies and live streaming platforms to monitor multiple streamers concurrently, ensuring the stability of daily broadcasts.
Notes
-
Live monitoring is a paid feature. For billing details, see Guangmu Monitoring fees.
-
Live monitoring is available only in specific regions. For more information, see Supported regions. By default, you can create up to 20 concurrent monitoring sessions in each region.
Prerequisites
To play monitored streams in the live monitoring console, you must configure an HTTPS certificate and cross-origin resource sharing (CORS) for the output streaming domain.
-
CORS configuration: Configure the Access-Control-Allow-Origin HTTP header and set its value to
https://live.console.alibabacloud.com. For instructions, see Configure HTTP headers. -
HTTPS configuration: Configure a valid HTTPS certificate. For instructions, see Configure HTTPS secure acceleration.
Console procedure
-
Log in to the ApsaraVideo Live console.
-
In the left-side navigation pane, choose Live + > Live Monitoring.
-
On the Live Monitoring page, select a Live Center and click Add Session.
Parameter
Description
Output configurations
Session name
Enter a name for the session.
Output resolution
Select an output resolution from the drop-down list. Multiple resolutions for landscape and portrait orientations are supported.
Live Center
The selected Live Center.
Source Domain Name
Select a domain name for the combined output stream. If no suitable domain name is available, click Add. For instructions, see Add an accelerated domain name.
Stream configurations
Stream for monitoring
You can add up to 12 streams by adding them manually or selecting them from the ApsaraVideo Live console.
-
Add Manually: Click Add Manually, enter the stream name and URL. You can also sort and delete streams.
-
Select from ApsaraVideo Live Console: Click Select from ApsaraVideo Live Console, select a domain name from the drop-down list, and select the online streams that you want to monitor.
-
Batch Upload: Upload multiple streams at once.
Notification configurations
Notification method
-
Monitoring Callbacks: Enter a callback URL in HTTP or HTTPS format. For details about the callback payload, see Callback parameters.
-
DingTalk Alerts: Receive alert notifications through a DingTalk chatbot. You must first set up a DingTalk chatbot and enter its HTTPS URL here. For more information, see Configure a custom chatbot.
ImportantSet the custom keyword of the DingTalk chatbot to "alert", otherwise you cannot receive messages.
Advanced settings
-
Video Frame Rate Alert Threshold: An alert is triggered when the video frame rate of a monitored stream falls below
Threshold × Original frame rate. Valid values: (0.0, 1.0]. -
Audio/Video Bitrate Alert Threshold: An alert is triggered when the audio/video bitrate of a monitored stream exceeds
Threshold × Original bitrate. Valid values: (0.0, 100]. -
Interruption Duration Alert Threshold: An alert is triggered if a stream interruption exceeds this duration in seconds. Valid values: (0, 65535].
-
-
Click OK to complete the session configuration.
-
Start monitoring.
After configuring the session, find it in the list and click Start Monitoring in the Actions column. Then, click Preview to open the monitoring page.
ImportantBilling continues as long as the session status is Monitoring. Closing the preview page does not stop billing. To stop the session and avoid further charges, you must click Stop Monitoring in the Actions column.
-
Explore the monitoring preview area.
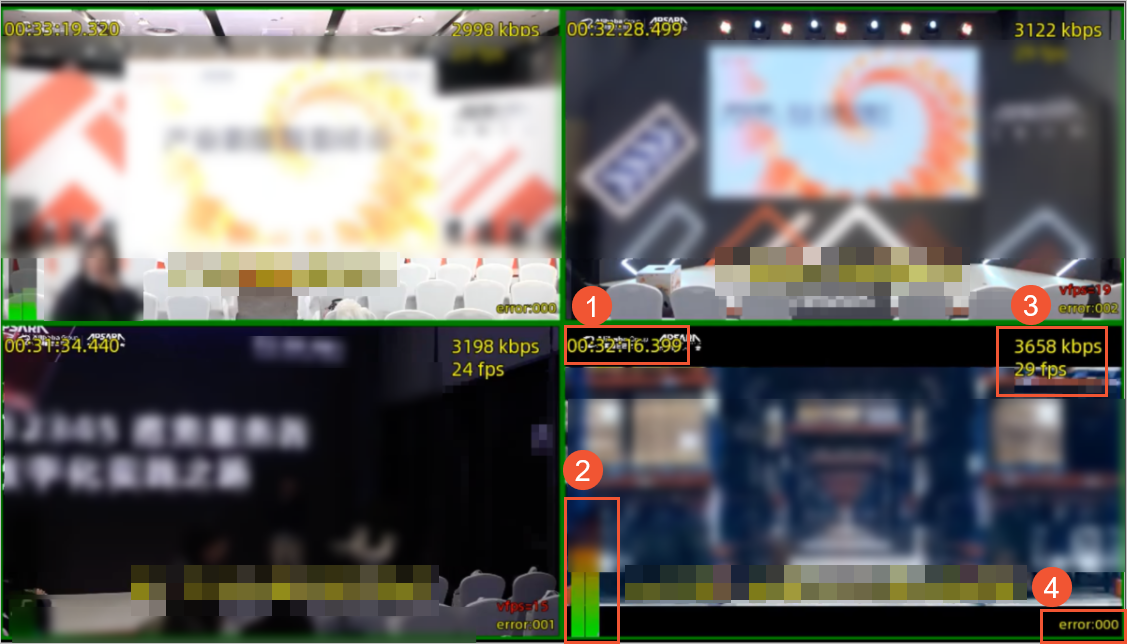
No.
Description
①
Stream timestamp. Displayed in the upper-left corner.
②
Audio volume for left and right channels, calculated using the Peak standard. Displayed in the lower-left corner.
③
Real-time frame rate and bitrate. Displayed in the upper-right corner.
④
Alert details. Displayed in the lower-right corner.
Supported alert types:
-
vfps: Video frame rate alert.
-
afps: Audio frame rate alert.
-
br: Bitrate anomaly alert.
-
eof: Traffic interruption alert.
-
a-v: Audio-video out-of-sync alert.
-
wc (warning count): Total number of alerts.
⑤
Audio quality detection. Displayed in the lower-left corner.
Supported audio quality types:
-
poor: Poor audio quality.
-
normal: Normal audio quality.
-
good: Good audio quality.
-
API reference
You can also use the following API operations to manage the live monitoring service:
-
To create a monitoring session, see CreateLiveStreamMonitor.
-
To start a monitoring session, see StartLiveStreamMonitor.
-
To stop a monitoring session, see StopLiveStreamMonitor.
-
To delete a monitoring session, see DeleteLiveStreamMonitor.
Alert notifications
If you have configured monitoring callbacks, the system sends alert events to your specified URL as an HTTP POST request with the Content-Type header set to application/json.
Callback parameters
|
Parameter |
Type |
Description |
|
monitorId |
String |
The unique ID of the monitoring session. |
|
monitorName |
String |
The name of the monitoring session. |
|
streamName |
String |
The name of the stream that triggered the alert. |
|
streamUrl |
String |
The URL of the stream that triggered the alert. |
|
event |
String |
The alert type:
|
|
time |
Long |
The timestamp when the alert occurred. |
|
detail |
String |
Detailed information about the alert. |
Callback example
{
    "monitorId": "3da2464f-2dea********-8b9d34b43430",
    "monitorName": "AI",
    "streamName": "cn",
    "streamUrl": "https://web******pull.aliyun.com/webinar/202****HU57.m3u8",
    "event": "a-v",
    "time": 1764147542481071,
    "detail": "a-v=0287"
}
Contact us
If you have any questions or suggestions about live monitoring, join the DingTalk group (ID: 35080444) for support.