This page summarizes the throughput, response latency, and compression ratio benchmark results for Lindorm compared to open source HBase.
Prerequisites
The results below are based on a specific test environment, benchmark toolkit, and test methods. Review these before drawing conclusions:
-
Test environment — hardware specifications and cluster configuration used in testing
-
Benchmark toolkit — benchmark software and how to run it
-
Test methods — workloads, data distribution, and test procedures
Throughput benchmark results
The following figure shows throughput for Lindorm and open source HBase under the same specifications, tested on a dataset of two billion rows.
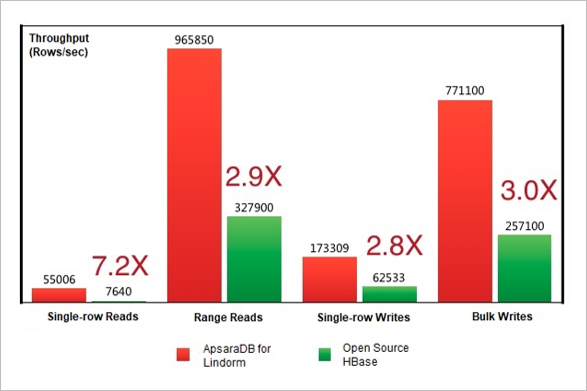
The values shown are for reference only. The actual benchmark results shall prevail.
Response latency benchmark results
The following figure shows response latency for Lindorm and open source HBase under the same specifications, tested on a dataset of two billion rows.
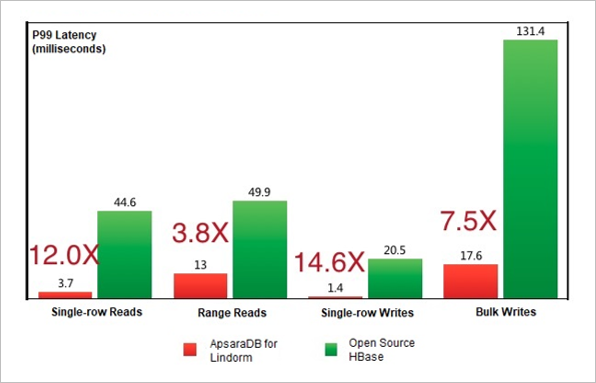
P99 (99th percentile) latency means 99% of requests completed within the displayed value. The values shown are for reference only. The actual benchmark results shall prevail.
Compression rate benchmark results
For a detailed comparison of compression ratios across Lindorm, open source HBase, open source MySQL, and open source MongoDB in different scenarios, see Compression testing.