This topic describes the results of the throughput, response latency, compression rate benchmark tests that are performed between Lindorm and open source HBase.
Prerequisites
The benchmark results are analyzed based on the following environment configuration, benchmark software, and test methods.
For more information about the environment configuration, see Test environment.
For more information about how to use the benchmark software, see Benchmark toolkit.
For information about the test methods, see Test methods.
Throughput benchmark results
The following figure shows the throughput values that are returned based on the same specifications when two billion rows are used for testing. 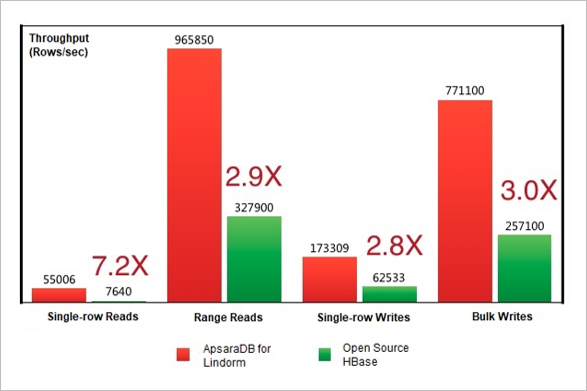
The values in the figure are provided only for reference. The actual benchmark results shall prevail.
Response latency benchmark results
The following figure shows the response latency values that are returned based on the same specifications when two billion rows are used for testing. 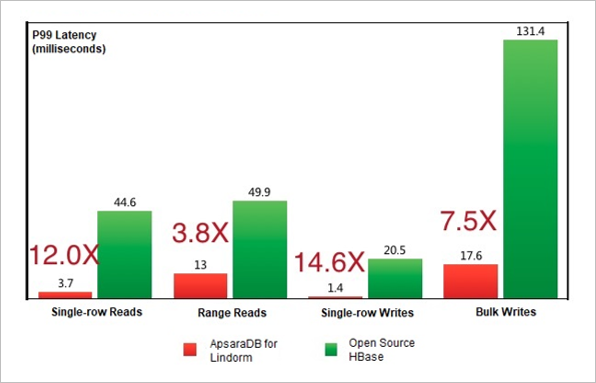
P99 indicates that 99% of the requests are answered with a latency lower than the displayed values.
The values in the figure are provided only for reference. The actual benchmark results shall prevail.
Compression rate benchmark results
For more information about the comparison results of the compression ratios between Lindorm, open source HBase databases, open source MySQL databases, and open source MongoDB databases in different scenarios, see Compression testing.