The intelligent deployment diagnostics feature provided by Flink Advisor is used to monitor the health status of a deployment, analyze and diagnose exception logs, exceptions, and risks of a deployment, and provide optimization suggestions based on the diagnostic results. This feature ensures the stability and reliability of your business. This topic describes how to use the intelligent deployment diagnostics feature.
Background information
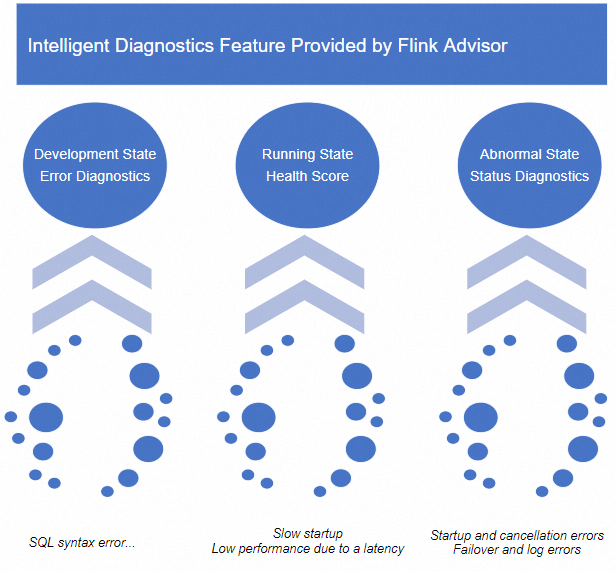
The intelligent deployment diagnostics feature provided by Flink Advisor is used to monitor the health status of a deployment and check the health score of a running deployment in real time. The full health score is 100. This feature analyzes the deployment status in the last half hour and deducts the health score of a deployment based on the number of checked risks and the risk levels. This feature helps you manage and diagnose deployments from draft development to deployment O&M of Realtime Compute for Apache Flink. The intelligent deployment diagnostics feature allows the system to analyze all logs, events, metrics, and configurations of a Realtime Compute for Apache Flink deployment during the lifecycle of the deployment in real time. You can use this feature to diagnose exception logs of a draft, check the health score of a running deployment, and detect the root cause of an abnormal deployment based on the O&M experience of Alibaba Cloud technical experts on issues that frequently occur in the Realtime Compute for Apache Flink deployments. After the diagnostics is complete, Realtime Compute for Apache Flink provides optimization suggestions based on the diagnostic results. This reduces the time that is required for data analysis and mean time to repair (MTTR) and ensures the stability and health status of your deployments. The following figure shows the capabilities of the intelligent deployment diagnostics feature.
Limits
Only streaming deployments support the intelligent deployment diagnostics feature. Batch deployments do not support this feature.
Diagnose exception logs
Diagnose exception logs of a draft
Log on to the management console of Realtime Compute for Apache Flink. Find the workspace that you want to manage and click Console in the Actions column.
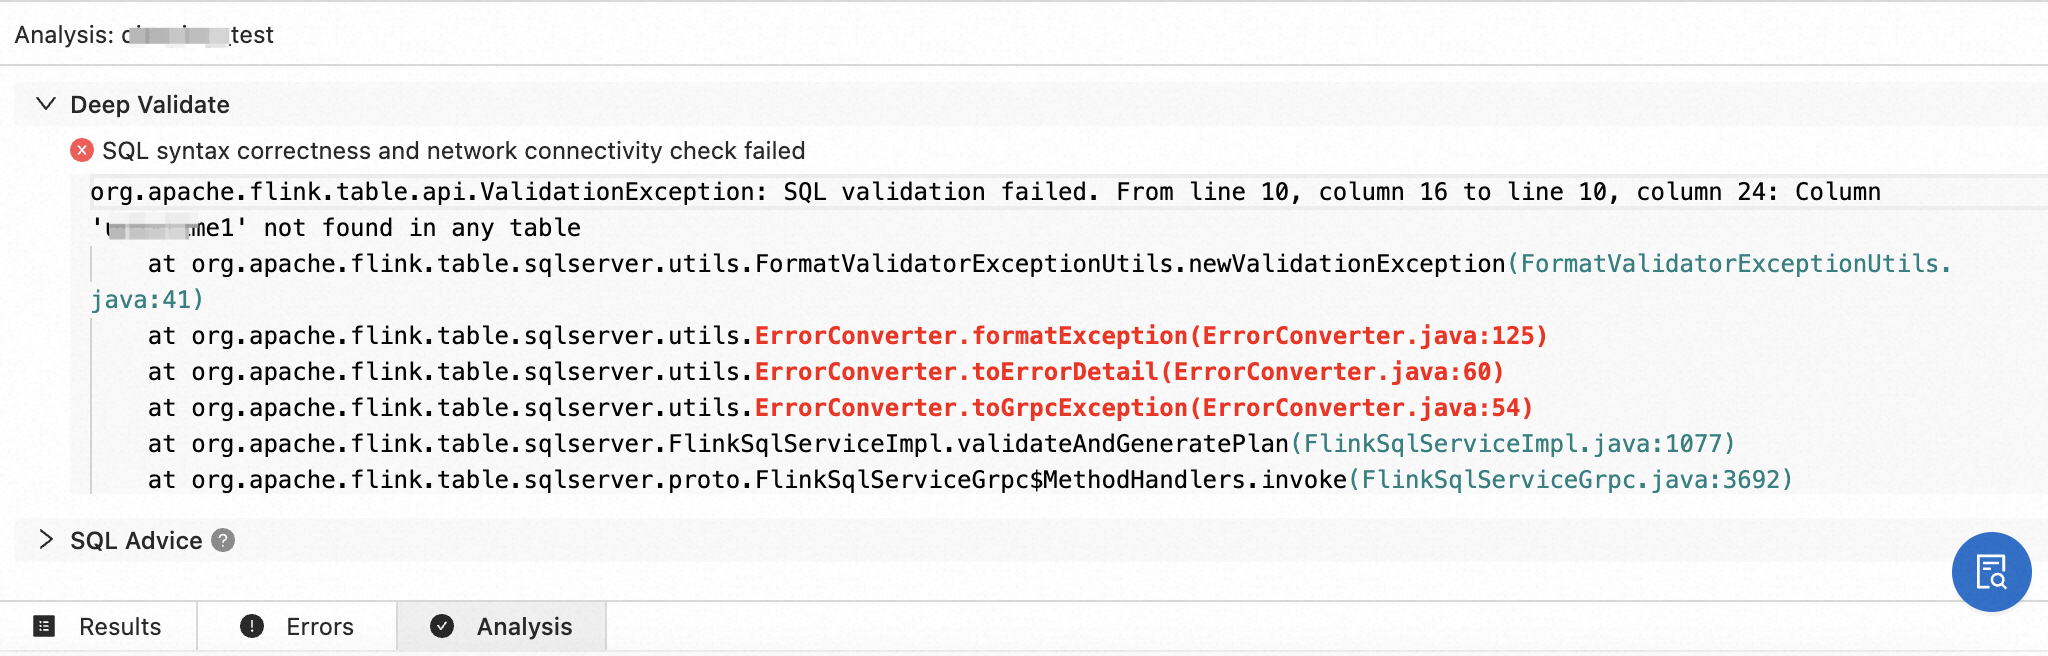
In the left-side navigation pane, choose . On the page that appears, create a draft, write SQL statements, and then click Validate.
Check the SQL semantics of the draft, network connectivity, and the metadata information of the tables that are used by the draft. You can also click SQL Advice in the calculated results to view information about SQL risks and related optimization suggestions.
In the lower part of the SQL Editor page, view the error details, possible causes, and optimization suggestions.
 Note
NoteIf you cannot identify the cause of the error and obtain optimization suggestions based on the result of the syntax check, you can select the related logs and click Search in Documentation to find relevant information in documentation.
Diagnose exception logs of a deployment
Log on to the management console of Realtime Compute for Apache Flink. Find the workspace that you want to manage and click Console in the Actions column.
In the left-side navigation pane, choose . On the Deployments page, click the name of the deployment that you want to manage.
Click the Logs tab. In the left-side pane of the Logs tab, click Logs, Startup Logs, and JM Exceptions to view the logs of the deployment.
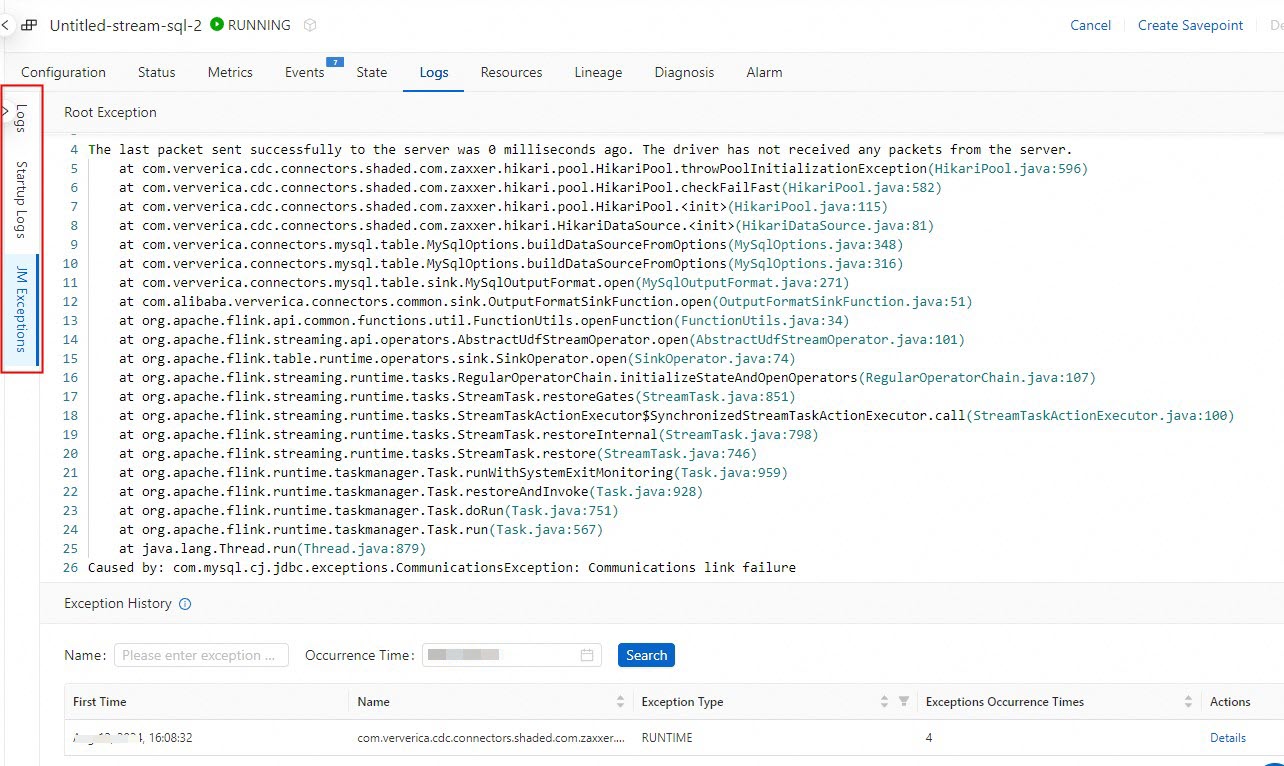
For more information, see View the boot logs and operational logs of a deployment, View the exception logs of a deployment, and View the logs of a historical deployment.
Perform intelligent deployment diagnostics on abnormal deployments
Go to the Diagnosis tab.
Log on to the management console of Realtime Compute for Apache Flink. Find the workspace that you want to manage and click Console in the Actions column.
In the left-side navigation pane, choose . On the Deployments page, click the name of the deployment that you want to manage.
Go to the Diagnosis tab.
You can go to the Diagnosis tab by using one of the following methods:
In the deployment list, find the deployment that you want to manage and click the score of the deployment in the Health column.
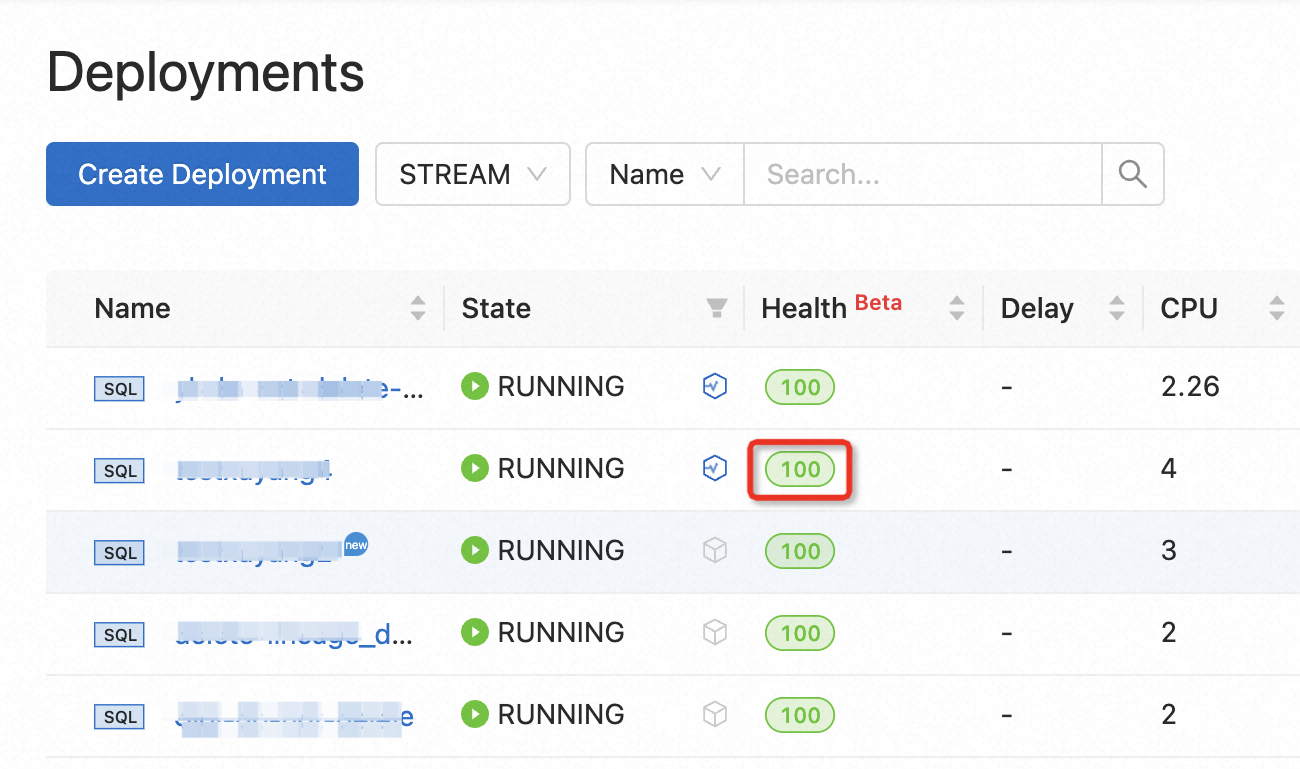
The following table describes the colors and meanings of the health score of the deployment.
Color
Description
Score range
Green
The health status of the deployment is good. No potential risks exist in the deployment. Specific configuration suggestions may be provided.
Above 80
Yellow
Specific issues or potential risks exist in the deployment. You need to check the deployment.
60 to 80
Red
Serious issues are detected in the deployment and need to be handled. If you do not handle the issues at the earliest opportunity, the deployment may be canceled. This affects your business continuity.
Below 60
On the Deployments page, find the deployment that you want to manage and click its name. On the page that appears, click the Diagnosis tab.
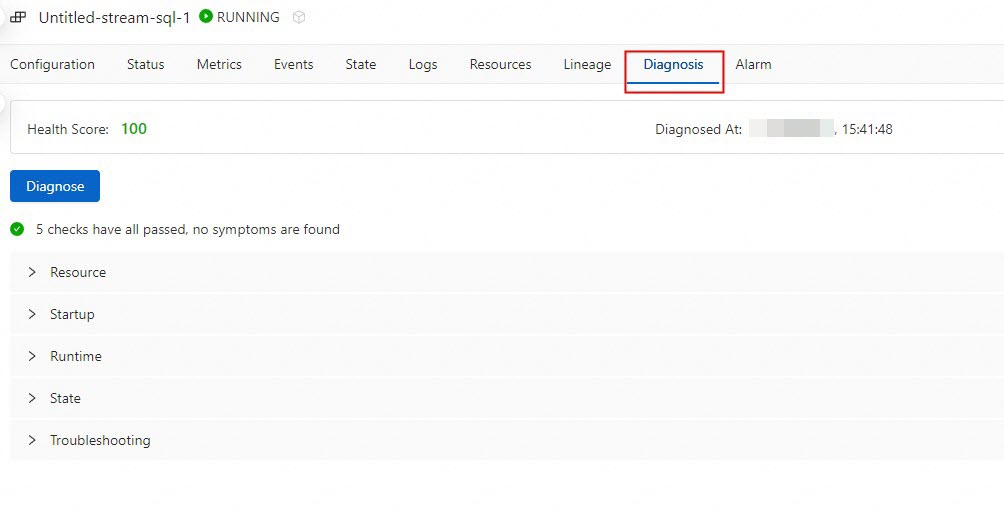
Click Diagnose.
Flink Advisor provides a variety of log repositories for Flink exception logs. For more information about the diagnostic types, diagnostic phases, diagnostic items, and handling methods, see the Flink Advisor diagnostic items section of this topic.
View the diagnostic result and optimization suggestions.
If you want to apply an optimization suggestion, you can click Apply on the right side of the optimization suggestion.
Flink Advisor diagnostic items
Type | Phase | Diagnostic item | Description |
Exception (The execution of the deployment is affected.) | Startup | Startup file analysis | If the required JAR package does not exist in the Object Storage Service (OSS) directory, the deployment cannot be started. To resolve this issue, upload the JAR package again before you start the deployment. |
Resource analysis | If the remaining available resources are insufficient, the deployment cannot be started. To resolve this issue, reduce the values of the resource configurations of the deployment or scale out the cluster to which the deployment belongs. | ||
If the Container Network Interface (CNI) fails to be bound to the deployment, the deployment cannot be started. To resolve this issue, check whether the number of IP addresses of the related vSwitch reaches the upper limit. | |||
If the number of IP addresses of Elastic network interfaces (ENIs) exceeds the upper limit, the deployment cannot be started. We recommend that you increase the number of ENIs and try again. | |||
Topology network analysis | If no network connection is established between the TaskManager and JobManager, the deployment is abnormal. | ||
If the operation of binding ENIs to Elastic Compute Service (ECS) instances times out within the previous 10 minutes, the deployment starts at a low speed. We recommend that you wait for a period of time. | |||
Network analysis of upstream and downstream services | If the Transmission Control Protocol (TCP) port detection is normal but the upstream or downstream connector is not connected, the deployment cannot be started. We recommend that you check the network configurations of the upstream and downstream services. | ||
Permission detection of upstream and downstream services | If the upstream data source is not connected, the deployment cannot be started. We recommend that you check the permission configuration of the upstream service. | ||
If the downstream data source is not connected, the deployment cannot be started. We recommend that you check the permission configuration of the downstream service. | |||
Startup speed analysis | If the JAR package of the deployment is excessively large, the deployment starts at a low speed. We recommend that you compress the JAR package and upload the package again or wait patiently. | ||
JobGraph check | The configuration file of Realtime Compute for Apache Flink of an earlier version may be missing. If this issue occurs, the deployment may not recover after the deployment performs a failover. To resolve this issue, manually cancel and then start the deployment. | ||
Session cluster check | A session cluster of Realtime Compute for Apache Flink of an earlier version may be abnormal. If this issue occurs, the deployment is abnormal. | ||
Run icon | High availability (HA) status check | If HA is not enabled for the deployment, the deployment cannot recover after the deployment failures. To resolve this issue, publish the draft for the deployment again and manually cancel and then start the deployment. | |
Checkpoint check | The checkpoint feature of Realtime Compute for Apache Flink of an earlier version may be abnormal. If this issue occurs, checkpointing may fail. | ||
Permission detection of upstream and downstream services | If the TCP port detection is normal but the upstream or downstream connector is not connected, the deployment cannot be started. We recommend that you check the permission configurations of the upstream and downstream services. | ||
Running status check | If an out-of-memory (OOM) error occurs in a TaskManager of a deployment, the deployment performs a failover. We recommend that you check the deployment configuration and increase the memory of the TaskManager. | ||
Cancellation | Cancellation speed analysis | In Realtime Compute for Apache Flink of an earlier version, the process of canceling a deployment is slow. If the deployment is canceled at a low speed, manually cancel and then start the deployment. | |
Risk (The execution of the deployment is not affected.) | Configurations | JobGraph check | The current status of the deployment is normal. However, the system detects that the configuration file of Realtime Compute for Apache Flink of an earlier version may be missing. As a result, the deployment cannot recover after the deployment fails. To resolve this issue, manually cancel and then start the deployment. |
HA status check | The current status of the deployment is normal. However, the system detects that HA is not enabled for the deployment. As a result, the deployment cannot recover after the deployment fails. To resolve this issue, publish the draft for the deployment again and manually cancel and then start the deployment. | ||
Version check | The current status of the deployment is normal. However, the system detects a major defect in Realtime Compute for Apache Flink of the current version. | ||
Run icon | Checkpoint check | The current status of the deployment is normal. However, the system detects a potential stability issue that is caused by a checkpoint exception in Realtime Compute for Apache Flink of an earlier version. | |
The current status of the deployment is normal. However, the system detects that no checkpoint is created for a long period of time. | |||
Cancellation speed analysis | The current status of the deployment is normal. However, the system detects a risk that may cause the deployment to be canceled at a low speed in Realtime Compute for Apache Flink of an earlier version. To resolve this issue, manually cancel and then start the deployment. | ||
Runtime environment analysis |
| ||
Version check | The version is in End of Service (EOS). Stability issues may occur or no effective product support is provided. For more information, see Console operations. |
References
You can view the performance of the JobManager and TaskManagers that are running. For more information, see Monitor deployment performance.
If you want the system to automatically or periodically reconfigure resources, you can configure automatic tuning. For more information, see Configure automatic tuning.
You can improve the performance of a Realtime Compute for Apache Flink SQL deployment by optimizing deployment configurations and the Flink SQL logic. For more information, see Optimize Flink SQL.