When a job is in the running state, you can view its startup and operational logs. This topic describes how to view these logs.
Background information
Type | Details |
Startup logs | Logs generated after a Flink job starts. These logs cover the period from the initialization of the Flink environment to the startup of the Job Manager. For more information about how to view startup logs, see View startup logs. Note Startup logs do not include scheduling logs. View the corresponding log information in management events. For example, issues such as insufficient resources or insufficient IP addresses for a vSwitch are related to scheduling. |
Operational logs | Logs for the Flink Job Manager and Task Managers are available on the job logs page and the Flink UI. For more information about how to view operational logs, see View operational logs. |
Prerequisites
The job instance is in the running state.
Usage notes
Logs are paginated to help you troubleshoot faults. Each page displays 1 MB of logs, which is approximately 8,000 to 9,000 lines. If you cannot find the issue on the current page, you can switch to the next page.
View startup logs
Log on to the Real-time Compute console.
In the Actions column of the target workspace, click Console.
In the navigation pane on the left, choose .
Click the name of the target job.
Click Job Logs.
On the Startup Logs tab on the left, you can view the startup logs.

View operational logs
View operational logs on the job logs page
Log on to the Real-time Compute console.
In the Actions column of the target workspace, click Console.
In the navigation pane on the left, choose .
Click the name of the target job.
Click Job Logs.
On the Operational Logs tab on the left, click the drop-down list next to Job and select the running job.
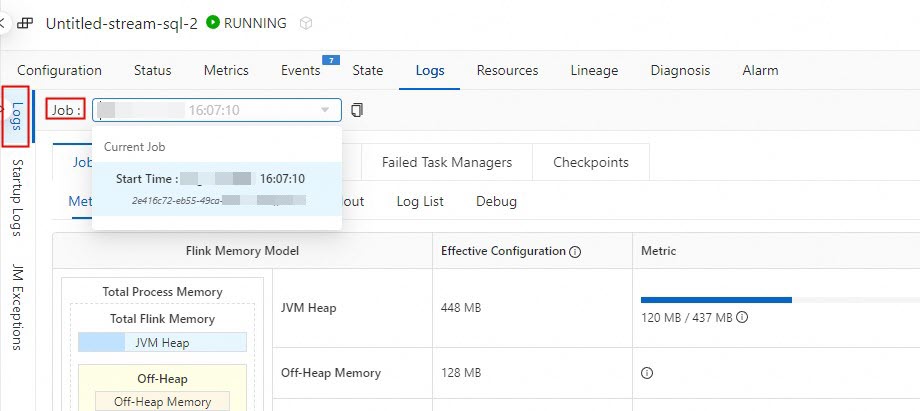
You can view the logs of the Job Manager and Task Managers.
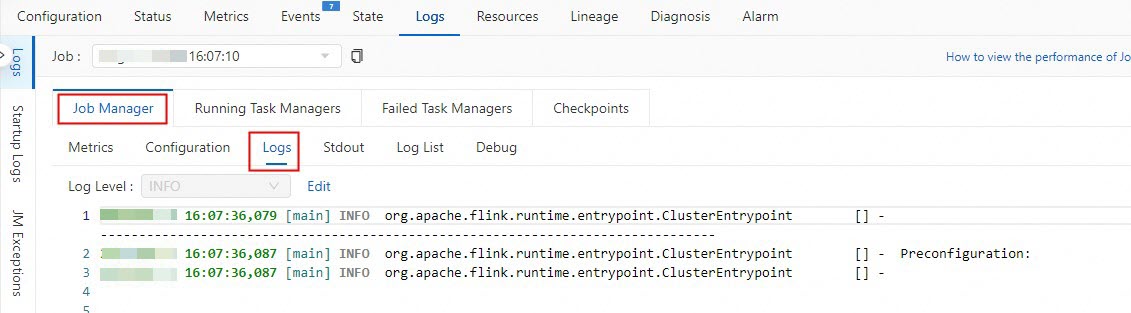
View Job Manager logs
On the Job Manager tab, click Logs.
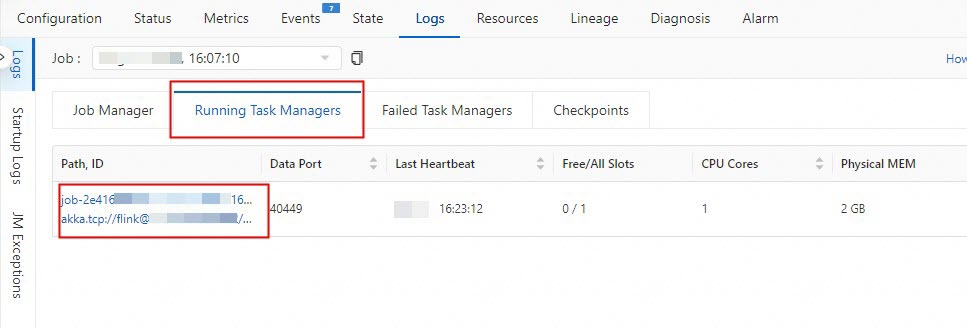
View Task Managers logs
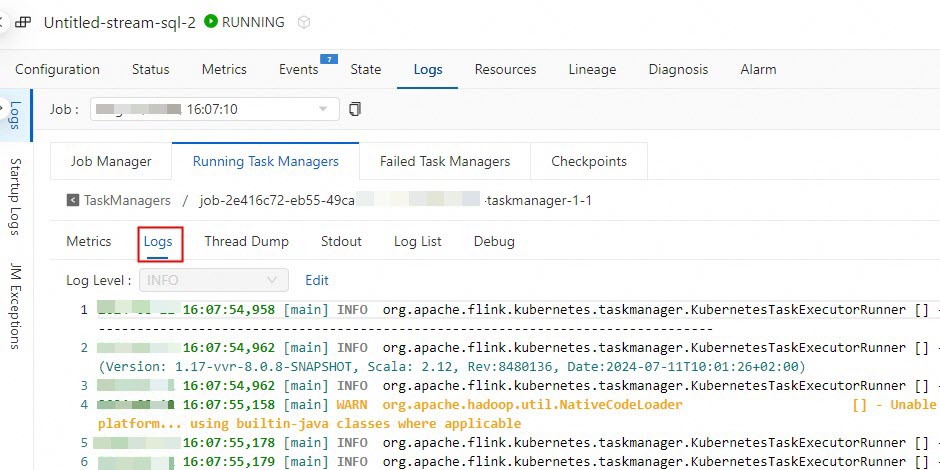
On the Running Task Managers tab, click Path, ID.
Click Logs.
View operational logs on the Flink UI
Log on to the Real-time Compute console.
In the Actions column of the target workspace, click Console.
In the navigation pane on the left, choose .
Click the name of the target job.
On the Overview page, click Flink UI.
In the navigation pane on the left, click Task Managers or Job Manager.
After you click Task Managers, click the target Path, ID to view the Task Manager logs for the job.
After you click Job Manager, on the Logs tab, you can view the Job Manager logs for the job.