The message delivery feature streams startup logs, resource usage data, running events, and job status change messages from Flink jobs in a target namespace to a specified external message queue or storage system in real time. This capability supports data persistence, historical record keeping, flexible integration, and real-time analysis. It also helps you query historical data for troubleshooting, performance optimization, and auditing. This topic describes how to configure message delivery and view the delivered messages.
Background
You can deliver messages across regions. The following table describes the message types and their delivery conditions.
Message type | Delivery details | Delivery condition |
Job startup logs | Contains logs from the entire startup process, from the initialization of the Flink environment to the startup of the JobManager and the generation of the Flink execution graph. | Delivered once the job starts successfully or reaches a final state such as failed or finished. |
Resource details |
Important This information is for resource capacity tracking and does not support alerting. | Delivered every 30 seconds while the namespace is running. |
Running events | Contains the startup status at various points during job startup. | Delivered when a job running event occurs. |
Job resource consumption | Resource usage of running streaming jobs. This does not include batch jobs or jobs on a session cluster. | Delivered every 10 minutes while a job is running. |
Job status changes | Job status change events, including the status before and after the change. | Delivered when the job status changes. |
Usage notes
Messages can only be delivered to Simple Log Service (SLS). Before you begin, you must create an SLS project and a Logstore. For instructions, see Use LoongCollector to collect and analyze text logs on ECS instances.
The message delivery feature is free of charge. However, using SLS features such as Logstore indexing incurs charges. For more information, see Billing overview.
To query and analyze logs in SLS, you must enable indexing. This action generates index traffic and uses index storage space. For more information about the fees, see Billing overview. Creating an index is optional.
You can configure server-side encryption for the Logstore. Delivered messages inherit this encryption setting. To learn how, see Data encryption.
The message delivery feature currently delivers only job startup logs to SLS. To output job runtime logs to OSS, SLS, or Kafka, you must configure them separately. For more information, see Configure job log output.
Changes to the message delivery configuration may take up to 30 seconds to take effect.
Procedure
Step 1: Configure the message delivery channel
Go to the message delivery configuration page
Log on to the Realtime Compute for Apache Flink console.
In the Actions column of the target workspace, click Console.
In the left-side navigation pane, click .
Configure SLS delivery parameters
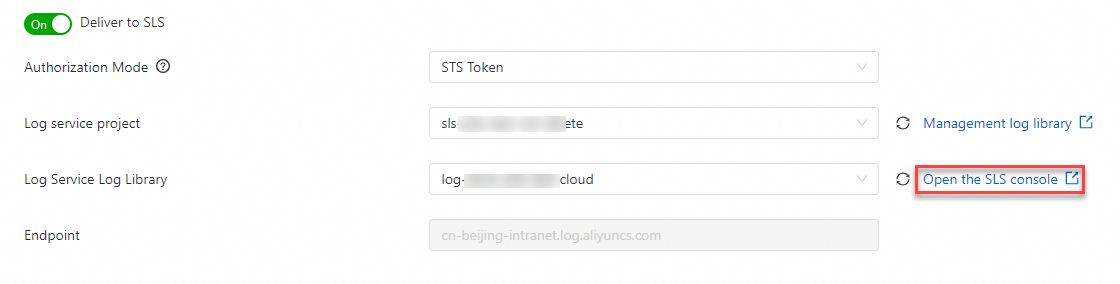
On the Message Delivery Configuration tab, turn on the Deliver to Log Service SLS switch.
Configure the SLS settings.
Parameter
Description
Authorization mode
STS Token: Select this mode to deliver messages only to an SLS project in the same region as your Flink workspace. You only need to configure the SLS project and Logstore.
AccessKey: Select this mode to deliver messages to an SLS project in a different region. You must configure the endpoint, AccessKey ID, and AccessKey secret.
Log Service Project
The name of the SLS project.
Log Service Logstore
The name of the SLS Logstore.
Endpoint
The endpoint of the SLS service.
If Authorization mode is set to STS Token, the system automatically sets this to the endpoint of the region where your workspace is located. If you select AccessKey, you must configure this parameter manually.
Delivery scope
The types of messages to deliver. For more information, see Field reference in this topic.
AccessKey ID
The AccessKey ID and AccessKey secret of your Alibaba Cloud account.
ImportantTo prevent credential leaks, manage your AccessKey credentials by using variables. Click the drop-down arrow to select an existing variable name, or click the
 icon next to the parameter to create a new variable.
For more information about variable management and how to view your AccessKey ID and AccessKey secret, see Variable management and View AccessKey information.
AccessKey secret
Click Save.
Step 2: View delivered messages
Procedure
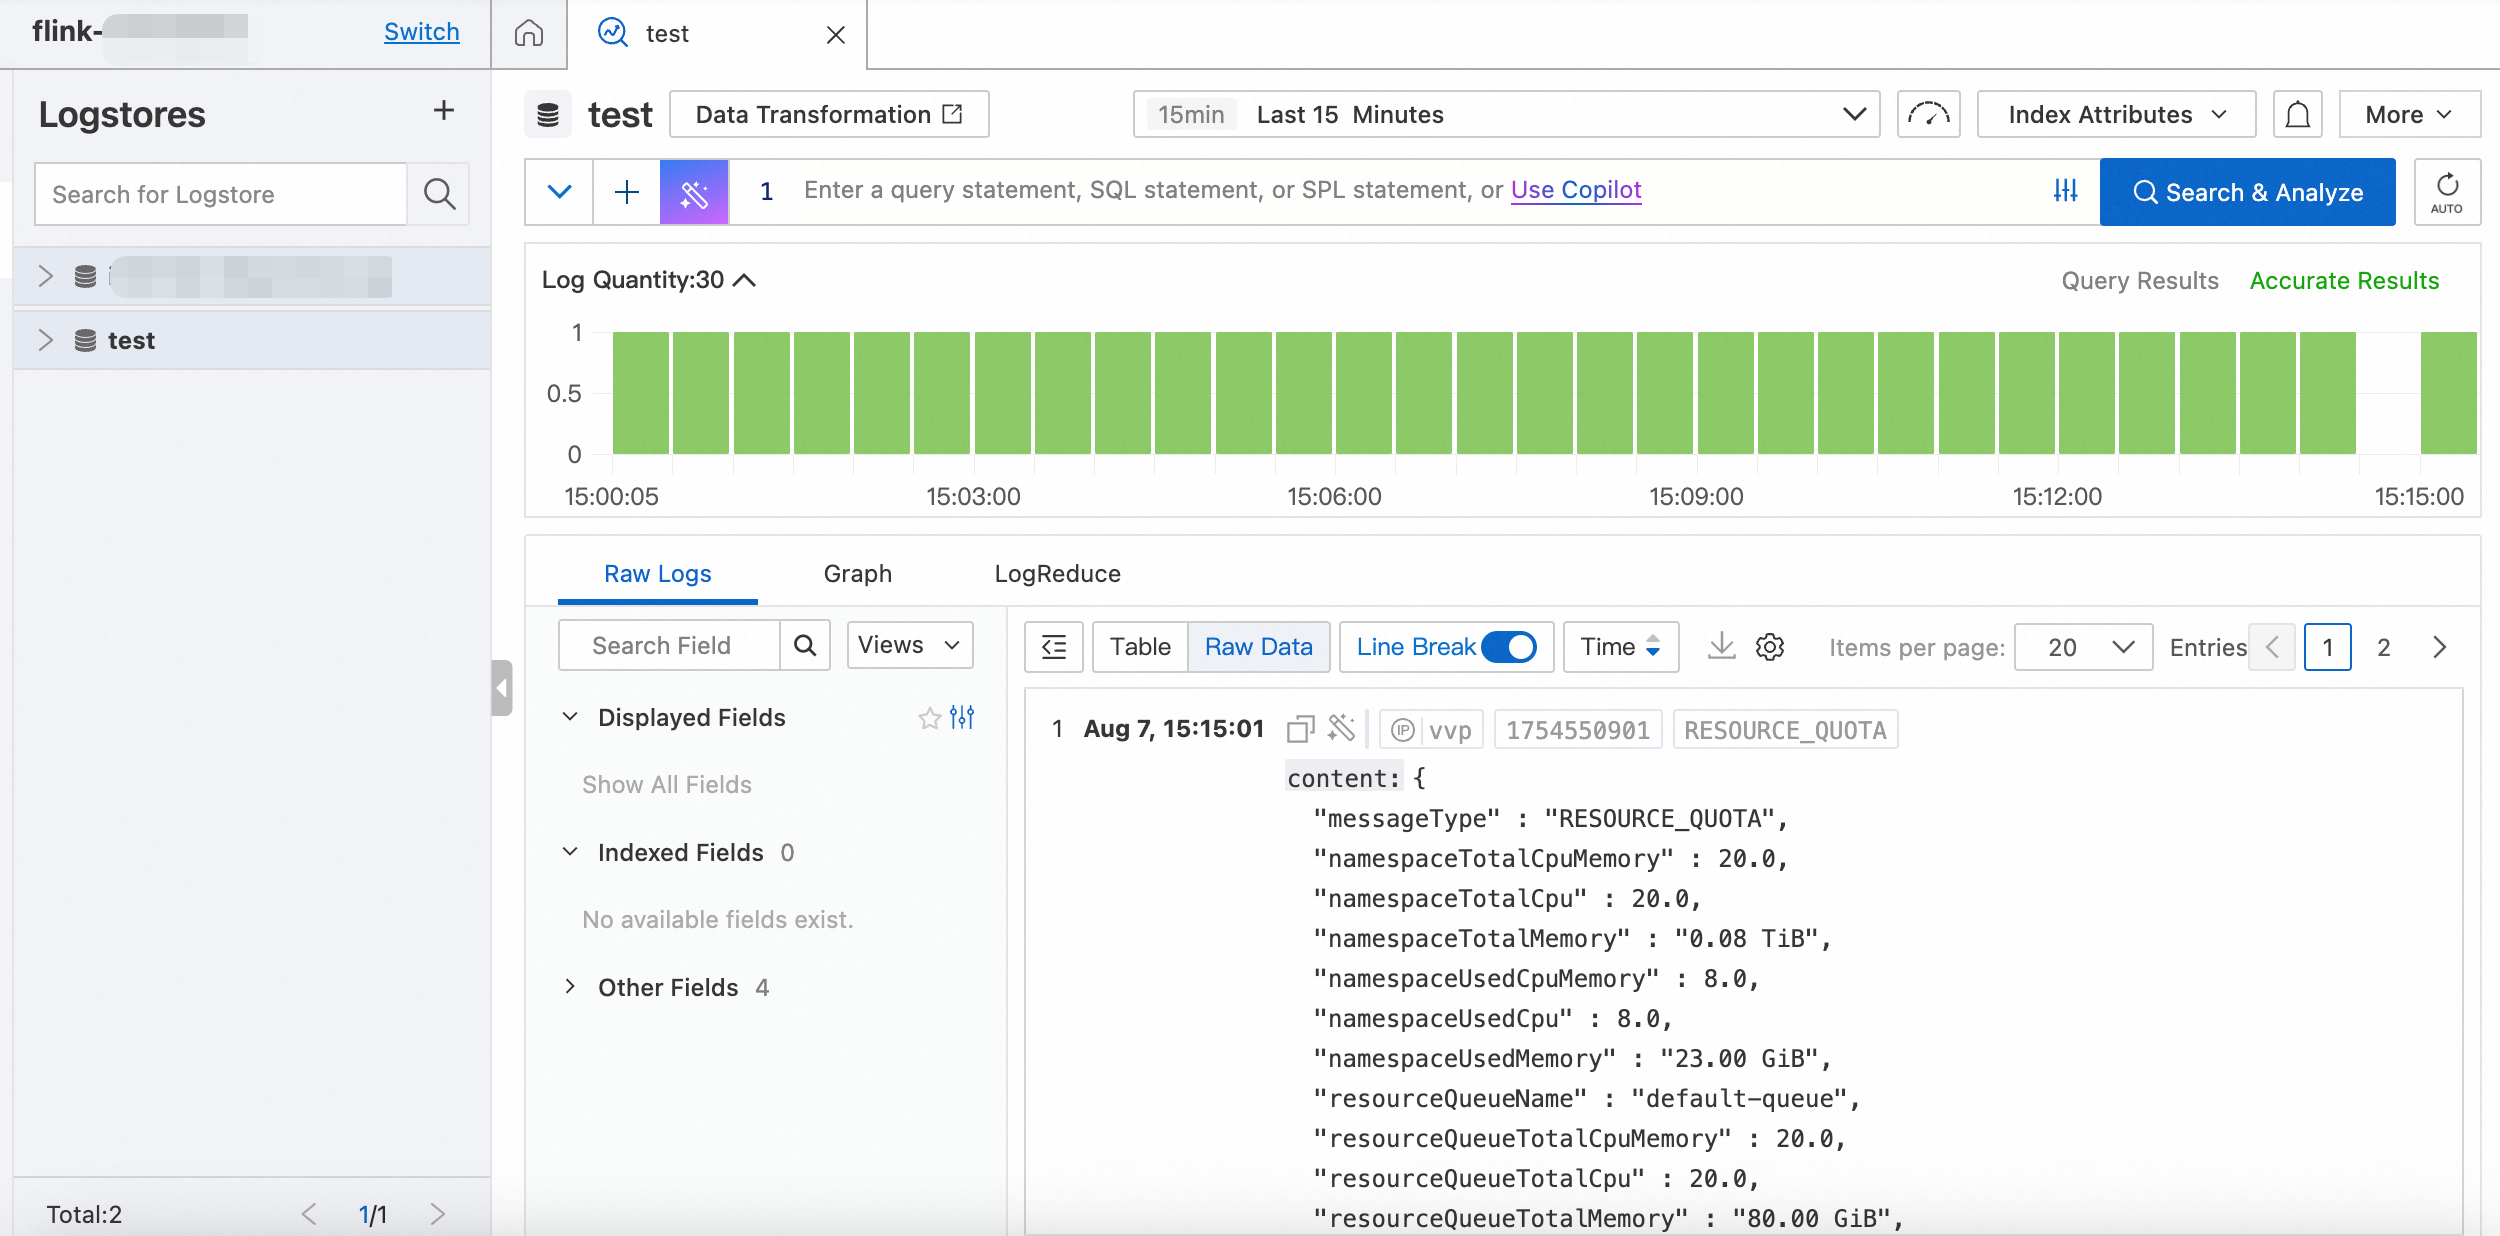
Click Open SLS console to the right of Log Service Project.
View the information in the raw logs.
Field reference
The following tables describe the fields for the five types of messages.
Startup logs (JOB_START_LOG)
Field | Description |
messageType | The message type. The value is always |
deploymentId | The ID of the job deployment. |
deploymentName | The name of the job deployment. |
jobId | The ID of the job instance. |
tag | The job tag. This field is empty if no tag is configured. |
length | The total length of the log. |
offset | The starting position of this log entry if the log is sharded. |
content | The content of the job startup log. |
workspace | The ID of the workspace. |
namespace | The name of the namespace. |
messageId | The ID of the message. |
timestamp | The timestamp. |
Resource details (RESOURCE_QUOTA)
Field | Description |
messageType | The message type. The value is always |
namespaceTotalCpuMemory | The total number of CUs in the namespace. |
namespaceTotalCpu | The total CPU resources in the namespace, measured in CUs. |
namespaceTotalMemory | The total amount of memory resources in the namespace. |
namespaceUsedCpuMemory | The number of CUs used in the namespace. |
namespaceUsedCpu | The CPU resources used in the namespace, measured in CUs. |
namespaceUsedMemory | The amount of memory resources used in the namespace. |
resourceQueueName | The name of the queue. |
resourceQueueTotalCpuMemory | The total number of CUs in the queue. |
resourceQueueTotalCpu | The total CPU resources in the queue, measured in CUs. |
resourceQueueTotalMemory | The total amount of memory resources in the queue. |
resourceQueueUsedCpuMemory | The number of CUs used in the queue. |
resourceQueueUsedCpu | The CPU resources used in the queue, measured in CUs. |
resourceQueueUsedMemory | The amount of memory resources used in the queue. |
workspace | The ID of the workspace. |
namespace | The name of the namespace. |
messageId | The ID of the message. |
timestamp | The timestamp. |
Running events (JOB_EVENT)
Field | Description |
messageType | The message type. The value is always |
deploymentId | The ID of the job deployment. |
deploymentName | The name of the job deployment. |
jobId | The ID of the job instance. |
tag | The job tag. This field is empty if no tag is configured. |
eventId | The ID of the event. |
eventName | The name of the event. |
content | The content of the event. |
workspace | The ID of the workspace. |
namespace | The name of the namespace. |
messageId | The ID of the message. |
timestamp | The timestamp. |
Job resource usage (JOB_RESOURCE_USAGE)
Field | Description |
messageType | The message type. The value is always |
deploymentId | The ID of the job deployment. |
deploymentName | The name of the job deployment. |
jobId | The ID of the job instance. |
tag | The job tag. This field is empty if no tag is configured. |
jobUsedCpu | The number of CUs used by the job. |
jobUsedMemory | The amount of memory used by the job. |
workspace | The ID of the workspace. |
namespace | The name of the namespace. |
messageId | The ID of the message. |
timestamp | The timestamp. |
Job status changes (JOB_STATUS_CHANGED)
Field | Description |
messageType | The message type. The value is always |
messageId | The unique ID of the message. |
timestamp | The timestamp when the message was generated, in milliseconds. |
workspace | The ID of the workspace. |
namespace | The name of the namespace. |
deploymentId | The ID of the job deployment. |
deploymentName | The name of the job deployment. |
jobId | The ID of the job instance. |
previousStatus | The job status before the change. |
currentStatus | The job status after the change. |
tag | The job tag. This field is empty if no tag is configured. |
additionalInfo | Additional information. |
Related documents
To learn how to configure logging for a single job, see Configure job log output.
For more information about how to view logs in the development console, see View startup and running logs, View running events, View exception logs, and View historical job instance logs.