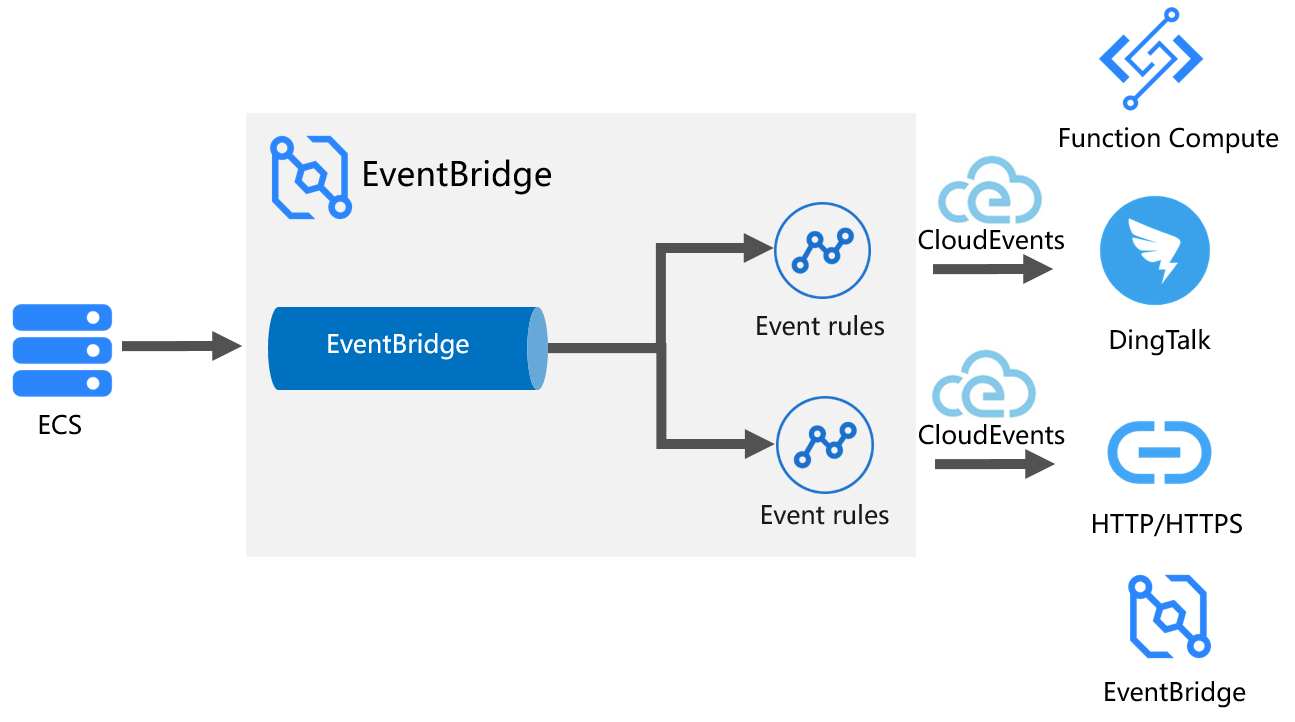
EventBridge enables real-time subscription to Elastic Compute Service (ECS) events and routes them to downstream services such as messaging queues, webhooks, serverless functions, and notification channels. Built on the CloudEvents 1.0 specification, EventBridge delivers 99.99999999% data reliability and 99.95% service availability.
Compared with polling the ECS DescribeInstanceHistoryEvents API, EventBridge offers:
Millisecond-level responsiveness -- triggers a target action as soon as an event occurs, with no polling delay.
Lower cost -- no periodic API calls needed, which prevents unnecessary costs.
Use cases
Route ECS events of a specific type to DingTalk, Short Message Service, or Alibaba Mail for instant notifications.
Push events to an HTTP or HTTPS endpoint on the internet or in a Virtual Private Cloud (VPC).
Aggregate ECS events across multiple Alibaba Cloud accounts into a single event bus.
Invoke a Function Compute function to run automated remediation or logging when a specific event occurs.
Buffer high-volume or high-latency events in a Simple Message Queue (formerly MNS) (SMQ) queue before consuming them.
Prerequisites
Before you begin, make sure that you have:
An activated EventBridge service with the required Resource Access Management (RAM) permissions granted. See Activate EventBridge and grant permissions to a RAM user
Depending on the target service, also prepare the following:
| Target | What to prepare |
|---|---|
| DingTalk | A DingTalk chatbot with its webhook URL and secret token |
| Function Compute | A service and a function in Function Compute. See Manage services and Manage functions |
| SMQ | An activated SMQ service with at least one queue. See Activate SMQ and authorize RAM users to access SMQ and Get started with queue-based messaging |
Step 1: Select the system event bus
EventBridge automatically creates a system event bus named default. All events from Alibaba Cloud services are delivered to this bus in real time.
Log on to the EventBridge console.
In the left-side navigation pane, click Event Buses.
In the top navigation bar, select a region.
On the Event Buses page, click the default bus name.
Step 2: Create an event rule for ECS events
In the left-side navigation pane, click Event Rules, then click Create Rule.
Complete the Configure Basic Info step: enter a rule name in the Name field and an optional description in the Description field. Click Next Step.
Complete the Configure Event Pattern step: The Event Pattern Debugging code editor displays a sample event for the selected type. For example, selecting ecs:Instance:StateChange Instance Status Changes Within Lifecycle shows: The following table describes the event fields. Click Next Step.
For Event Source Type, select Alibaba Cloud Service Event Sources.
From the Event Source drop-down list, select acs.ecs Elastic Compute Service (ECS).
From the Event Type drop-down list, select one or more event types to subscribe to.
CloudEvents 1.0 standard fields
Field Type Description idString Unique event identifier sourceString Event source in the format acs.<service>specversionString CloudEvents specification version ( 1.0)subjectString Resource path: acs.ecs:<region>:<account-id>:<resource-id>timeString Timestamp when the event occurred (ISO 8601) typeString Event type, such as ecs:Instance:StateChangedataObject Event payload containing resource-specific details Alibaba Cloud extension fields
Field Type Description aliyunaccountidString Alibaba Cloud account ID that owns the resource aliyunpublishtimeString Timestamp when EventBridge published the event aliyuneventbusnameString Name of the event bus ( defaultfor system events)aliyunregionidString Region where the event originated aliyunpublishaddrString IP address of the publishing node { "id": "45ef4dewdwe1-7c35-447a-bd93-fab****", "source": "acs.ecs", "specversion": "1.0", "subject": "acs.ecs:cn-hangzhou:123456789098****:215672", "time": "2020-11-19T21:04:41Z", "type": "ecs:Instance:StateChange", "aliyunaccountid": "123456789098****", "aliyunpublishtime": "2020-11-19T21:04:42Z", "aliyuneventbusname": "default", "aliyunregionid": "cn-hangzhou", "aliyunpublishaddr": "172.25.XX.XX", "data": { "instanceName": "iZ0jl0kyquo46h****", "instanceType": "ecs.c6.large", "privateIpAddress": "172.21.XX.XX", "publicIpAddress": "8.37.XX.XX", "resourceId": "i-0jl0kyquo46****", "resourceType": "ALIYUN::ECS::Instance", "spotStrategy": "SpotWithPriceLimit", "state": "Running" } }Complete the Configure Targets step. Select a target service based on your use case. See the scenarios below.
Scenario 1: Push events to SMQ
Use SMQ to buffer events when the latency of events is high or the number of events is large. For SMQ pricing, see Billing.
| Parameter | Value |
|---|---|
| Service Type | SMQ |
| Queue | Select the queue you created |
| Message Body | Complete Event |
| Enable Base64 Decoding | Yes -- encodes event data in Base64 before delivery |
To consume events from the queue, download the NetworkInterfaceDemo.zip sample listener.
Scenario 2: Push events to DingTalk
| Parameter | Value |
|---|---|
| Service Type | DingTalk |
| Address | Webhook URL of the DingTalk chatbot |
| Secret Key | Secret token of the chatbot |
To customize the notification content, configure the Pushed Content section:
Variables -- use JSONPath to extract fields from the event payload:
{
  "instanceName": "$.data.instanceName",
  "state": "$.data.state"
}
Template -- define the DingTalk message format using the variables above:
{
  "msgtype": "text",
  "text": {
    "content": "${instanceName} state is ${state}"
  }
}
Scenario 3: Push events to an HTTP or HTTPS endpoint
| Parameter | Value |
|---|---|
| Service Type | HTTP or HTTPS |
| URL | Endpoint URL that receives events |
| Body | Event format: Complete Event, Partial Event, Fixed Value, or Template. See Event transformation |
| Network Type | Internet for public endpoints, or VPC for endpoints without internet access (requires VPC, vSwitch, and Security Group configuration) |
Scenario 4: Invoke a Function Compute function
Trigger automated actions -- such as logging, alerting, or remediation -- when a specific ECS event occurs.
| Parameter | Value |
|---|---|
| Service Type | Function Compute |
| Service | Name of your Function Compute service |
| Function | Name of the function to invoke |
| Event | Event format: Complete Event, Partial Event, Fixed Value, or Template. See Event transformation |
| Invocation Mode | Synchronous -- request succeeds only after the function finishes processing. Asynchronous -- request succeeds once Function Compute receives the event |
For more information, see Route events to Function Compute.
Scenario 5: Aggregate events across accounts
Route ECS events from multiple Alibaba Cloud accounts or regions into a single event bus.
| Parameter | Value |
|---|---|
| Service Type | EventBridge |
| Destination Type | Same-account Event Bus or Cross-account Event Bus (cross-account requires additional RAM permissions; see Route events to EventBridge) |
| Region | Target region. Events in the Chinese mainland can only route to another Chinese mainland region; events outside the Chinese mainland can only route to another region outside the Chinese mainland |
| Event Bus | Target event bus name |
| Event | Complete Event (fixed, cannot be changed) |
Configure retry policies and dead-letter queues
In the Retry Policy and Dead-letter Queue section of the Configure Targets step, configure failure handling based on your requirements.
Retry policies
| Policy | Max retries | Interval | Total duration |
|---|---|---|---|
| Backoff Retry | 3 | Random, 10--20 seconds between retries | Up to ~1 minute |
| Exponential Decay Retry | 176 | Incremental: 1s, 2s, 4s, 8s, 16s, 32s, 64s, 128s, 256s, 512s (512s repeats for 167 retries) | Up to 1 day |
Fault tolerance
| Option | Behavior |
|---|---|
| Fault Tolerance Allowed | Failed events do not block subsequent events. After the retry limit, the event goes to the dead-letter queue or is discarded |
| Fault Tolerance Prohibited | Processing pauses until the failed event is delivered. Use this when event ordering matters |
Dead-letter queues
After all retries are exhausted, events are discarded by default. To preserve failed events, configure a dead-letter queue. Supported dead-letter queue types: ApsaraMQ for RocketMQ, SMQ, ApsaraMQ for Kafka, or an EventBridge event bus.
For other target service types, see Target service types.
Step 3: Trigger a test event
Verify the setup by triggering an ECS event. This example uses the ecs:Instance:StateChange event type.
Log on to the ECS console.
In the left-side navigation pane, choose Instances & Images > Instances.
In the top navigation bar, select the region of the target instance.
Find the instance and choose
 > Instance Status in the Actions column to change the instance state (for example, stop or restart it).
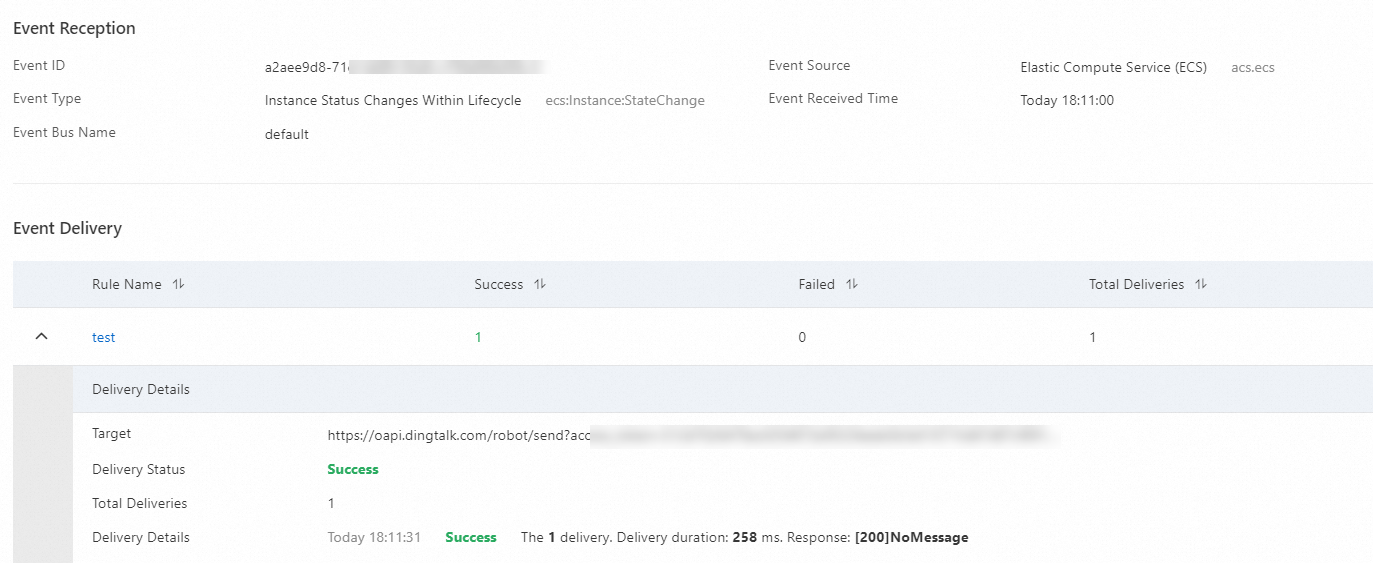
Step 4: Verify event delivery
Check event generation: In the EventBridge console, query events by time range, event type, rule name, or event ID. See Query events by event ID.
Check delivery status: Click Event Trace in the Actions column for the event to view the delivery trace, which shows the target, delivery status, attempt count, and timestamp.
Verify the downstream target: Confirm that the event reached its destination:
SMQ: Check the queue for new messages.
DingTalk: Look for the notification in the chat group.
HTTP/HTTPS: Check the endpoint's access logs.
Function Compute: Review the function execution logs.
EventBridge: Query the target event bus for the forwarded event.
Monitor events and configure alerts
Track delivery metrics and set up alerts in CloudMonitor.
Log on to the CloudMonitor console.
In the left-side navigation pane, choose Cloud Service Monitoring > Cloud Service Monitoring.
In the left-side navigation tree, click Middleware. In the Middleware section, hover over EventBridge and click EventBus.

Select the region, then click Monitoring Charts in the Actions column of the default event bus.
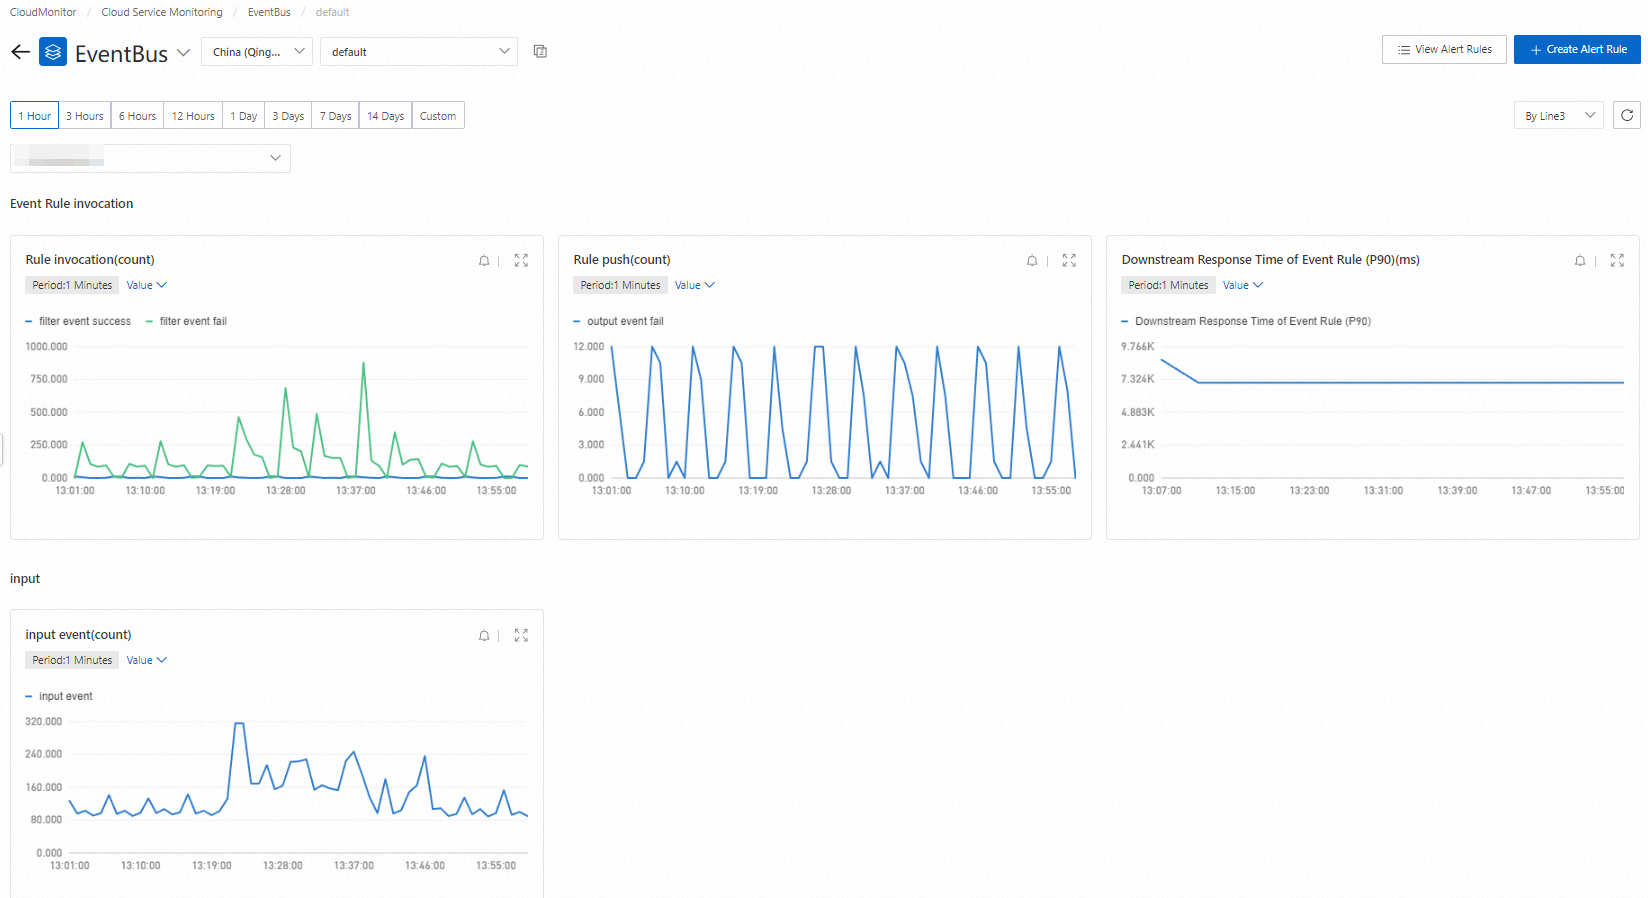
From the monitoring page, configure alert rules for metrics such as API call count, delivery success rate, and delivery latency. See Configure an alert rule.
Clean up resources
To avoid unnecessary charges, delete resources created during this tutorial when they are no longer needed:
Event rule: In the EventBridge console, go to Event Rules under the default bus and delete the rule.
Function Compute: Delete the function and service if they were created solely for this tutorial.
SMQ queue: Delete the queue if it is no longer in use.