The cluster details page displays network endpoints, port numbers, version, type, running status, node distribution, and cluster health of an Alibaba Cloud Elasticsearch (ES) cluster. The node visualization feature provides node health monitoring, configuration details, and supports Indexing Service and OpenStore storage tracking for eligible instances. You can also view the progress and history of cluster changes.
Go to the cluster details page
-
Log on to the Alibaba Cloud Elasticsearch console.
-
In the left-side navigation pane, click Elasticsearch Clusters.
-
In the top navigation bar, select a resource group and a region.
-
In the Elasticsearch cluster list, click the ID of the target cluster. The cluster details page opens.
This page shows the cluster's basic information, running status, and zone and node distribution.
Basic cluster information
In the Basic Information section, you can view information such as the cluster ID, cluster type, version, and network endpoints. Click Update and Upgrade on the right to upgrade the cluster version and update the kernel.
|
Parameter |
Description |
|
Instance ID |
The unique identifier of the cluster. |
|
Name |
By default, the cluster name is the same as the cluster ID. You can customize the name during creation or change it later. The name can be used to search for the cluster. |
|
Version |
Supported versions include |
|
Cluster Type |
Valid values: Vector Enhanced Edition, Kernel-enhanced Edition, and Standard Edition. Different cluster types provide different features. |
|
Control Architecture Type |
The network architecture of the ES cluster:
|
|
Region |
The region where the cluster is deployed. |
|
Zone |
The zone where the cluster is deployed. |
|
VPC |
The VPC to which the cluster belongs. |
|
vSwitch ID |
The vSwitch to which the cluster belongs. |
|
Internal Endpoint |
The endpoint for accessing the ES cluster from an ECS instance within the same VPC. |
|
Internal Port |
The console displays port 9200. This port uses the HTTP or HTTPS protocol for communication between clients (such as browsers, applications, and Kibana) and the Elasticsearch cluster. Additionally, Alibaba Cloud Elasticsearch 5.x clusters also support the TCP-based port 9300 for internode communication. Alibaba Cloud Elasticsearch 6.0 and later do not support port 9300 access with a Transport Client. You must use a |
|
Public Endpoint |
The endpoint used to access the ES cluster over the internet. |
|
Public Port |
This parameter is displayed only after you enable the Public Endpoint. The supported port numbers are the same as those for the internal port. |
|
Protocol |
HTTP is used by default. You can switch to HTTPS. |
|
Resource Group Name |
The name of the resource group to which the cluster belongs. Resource groups allow you to organize and manage resources under an Alibaba Cloud account. You can use them to centrally manage cloud resources from multiple regions. |
|
Resource Group ID |
The ID of the resource group to which the cluster belongs. |
|
Tag |
The tags attached to the cluster. You can use tags to classify and manage clusters. |
Cluster running status
In the Cluster Statistics section, you can view the cluster's current status and billing method.
|
Parameter |
Description |
|
Status |
The status of the cluster. Valid values:
|
|
Billing Method |
The billing method of the cluster. Valid values: Subscription (prepaid) and Pay-as-you-go.
|
|
Created At |
The time when the cluster was created. |
|
Maintenance Window |
The time window during which Alibaba Cloud performs maintenance. The default window is 02:00–06:00. You can set a custom maintenance window. |
Cluster health status
View cluster health in two ways:
-
Use the console
In the Node Visualization area on the Basic Information page, hover over the Cluster icon to view the cluster Status.

For a cluster health report, click Intelligent O&M.
NoteCluster and node status may not reflect real-time state during configuration changes. Check health status only after the cluster stabilizes.
-
Use an API
Use the Health API to check cluster health.
GET /_cluster/health
Node information
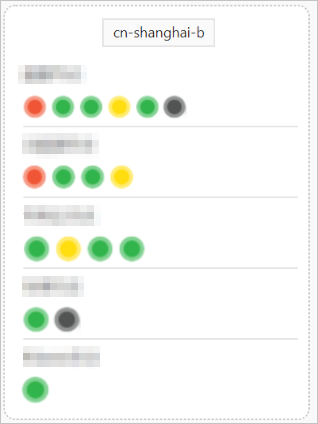
The Node Visualization area displays zone distribution and individual node details.
-
Hover over a zone to view its status.
-
Node colors indicate health status based on CloudMonitor utilization thresholds. For details, see Metric description and suggestions for handling exceptions.
-
Red: Alert.
-
Yellow: Warning.
-
Green: Normal.
-
Gray: Unknown (no recent data).
-
-
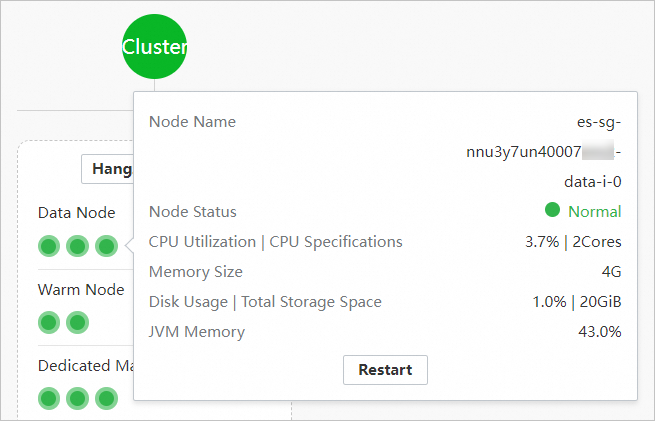
Hover over a node to view its details.
 Note
Note-
When the Node Status is red, yellow, or gray, a diagnostic prompt appears. Click Intelligent O&M Diagnosis to go to the page to diagnose the cluster.
-
Click Restart to restart the cluster or a node.
-
-
Click the
 icon to switch the view and display node specifications, node count, and storage capacity by node type.
 -
Click Configuration Change to scale in nodes, scale up, or scale down the cluster.
Node configuration information
In the upper-right corner of the Node Visualization area, click the ![]() icon to view node configurations in a list.
icon to view node configurations in a list.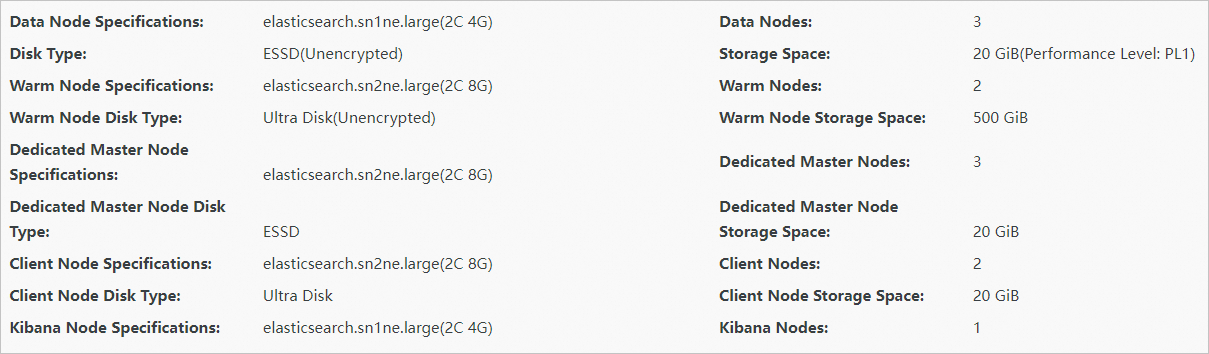
Each parameter is described in node configurations of an Elasticsearch instance.
Change records
After you change the configuration, restart the cluster, or scale an Elasticsearch instance out or in, you can track the progress and status of these changes on the Change Records page. This page also provides a history of all changes made to the instance within the last 30 days.
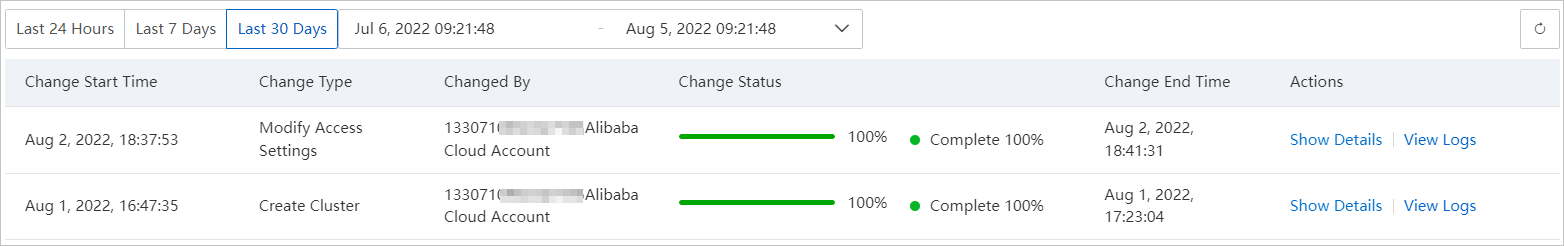
By default, the page shows change records from the last 24 hours. You can also choose to view records from the last 7 days, last 30 days, or a custom time range. The maximum history available is 30 days.
|
Parameter |
Description |
|
Change Start Time |
The time when a user-initiated change to the instance began. |
|
Change Type |
The type of change made to the cluster, such as creating an instance, restarting an instance, or changing the cluster configuration. |
|
Changed By |
The ID of the Alibaba Cloud account or RAM user that initiated the change. |
|
Change Status |
In progress: The change is being applied. Please wait. Completed: The change was successfully applied. Pause Change: The change is paused. If you did not manually pause the change, click View Logs to find the cause. |
|
Change End Time |
An end time is displayed only for changes with the status of Change Status. |
|
Actions |
|