Elasticsearch X-Pack Watcher monitors infrastructure, index data, and cluster health metrics with built-in alerting. You can use it alongside the Kibana console to track cross-cluster replication (CCR) status and send alerts when read request latency or checkpoint lag exceeds a specified threshold.
How it works
X-Pack Watcher has four components: a trigger that defines how often the watch runs, an input that retrieves monitoring data from the cluster, a condition that determines whether the alert threshold is met, and actions that specify what happens when the condition is met, such as sending a webhook.
Prerequisites
You have created an Alibaba Cloud Elasticsearch instance. For more information, see Create an Alibaba Cloud Elasticsearch instance.
NoteFor the old network architecture, X-Pack Watcher supports only single-availability-zone Elasticsearch instances. Multi-availability-zone instances are not supported.
For the new network architecture, you must configure a PrivateLink connection for the instance to bypass network restrictions. For more information, see Configure a PrivateLink connection for an instance.
For more information about network architectures, see [Notice] Network architecture adjustment.
You have enabled X-Pack Watcher for your Elasticsearch instance. For more information, see Configure YML parameters.
You have created an ECS instance in your virtual private cloud (VPC). For more information, see Create an instance by using custom settings.
NoteX-Pack Watcher in Alibaba Cloud Elasticsearch cannot access the public internet directly. It communicates through the private endpoint of your instance within a VPC. Therefore, the ECS instance in your VPC must have public internet access, either by assigning an elastic IP address (EIP) or by configuring source network address translation (SNAT). For more information, see Associate an EIP or Configure SNAT.
Procedure
Step 1: Create and configure a DingTalk bot
Create a DingTalk group to receive alerts.
In the upper-right corner of the group, click the
 icon. In the Group Settings panel, click Bot.
In the Robot Management dialog box, click Add Robot, select Custom, and then click Add.
Enter a Robot Name, select Custom Keywords, and then enter your keywords.
ImportantThe keywords must be included in the alert message that you configure.
Select I have read and agree to the "Custom Robot Service and Disclaimer Terms", and click Complete.
Next to Webhook, click Copy to copy the bot's webhook URL.
Keep the webhook URL secure. Sharing it on external websites creates a security risk.
Step 2: Configure NGINX proxy and ECS security group
Configure the NGINX proxy on your ECS instance.
X-Pack Watcher sends alerts to an NGINX proxy on your ECS instance, which then forwards them to DingTalk or WeCom.
Install NGINX on the ECS instance.
Configure the nginx.conf file.
Replace the
serversection in the nginx.conf file with the following configuration.server { listen 8080;# Listener port server_name localhost;# Domain name index index.html index.htm index.php; root /usr/local/webserver/nginx/html;# Site directory location ~ .*\.(php|php5)?$ { #fastcgi_pass unix:/tmp/php-cgi.sock; fastcgi_pass 127.0.0.1:9000; fastcgi_index index.php; include fastcgi.conf; } location ~ .*\.(gif|jpg|jpeg|png|bmp|swf|ico)$ { expires 30d; # access_log off; } location / { proxy_pass <Webhook URL>; } location ~ .*\.(js|css)?$ { expires 15d; # access_log off; } access_log off; }Replace <Webhook URL> with the webhook URL of the DingTalk bot that you copied in Step 1.
Reload the configuration file and restart NGINX.
/usr/local/webserver/nginx/sbin/nginx -s reload            # Reload the configuration file
/usr/local/webserver/nginx/sbin/nginx -s reopen            # Restart NGINX
Configure the ECS security group.
Allow inbound traffic from your Alibaba Cloud Elasticsearch instance to the NGINX proxy on the ECS instance.
Log on to the Alibaba Cloud ECS console.
In the left-side navigation pane, choose .
On the Cluster page, click the name of the target instance.
Click the Security Group tab.
On the Security Groups tab, click the name of the target security group.
On the Inbound tab, click Add Rule.
Configure the parameters.
Parameter
Description
Action
Select Permitted.
Priority
Keep the default value.
Protocol
Select Custom TCP.
Access Source
Enter the IP addresses of all nodes in your Alibaba Cloud Elasticsearch instance.
NoteTo get the IP addresses of the nodes, see View basic information about nodes.
Destination
Enter the port that NGINX is configured to listen on. This topic uses port 8080 as an example.
Description
Enter a description for the rule.
Click OK.
Step 3: Configure the watch
Log on to the Kibana console of your Elasticsearch cluster.
For instructions, see Log on to the Kibana console.
NoteExamples here use Elasticsearch V6.7.0. Operations may vary slightly for other versions.
In the left navigation menu, choose .
-
In the Console, run the following command to create a watch.
PUT _watcher/watch/ccr_watcher
{
  "trigger": {
    "schedule": {
      "interval": "10s"
    }
  },
  "input": {
    "search": {
      "request": {
        "indices": [
          ".monitoring-es*"
        ],
        "body": {
          "size": 0,
          "sort": [
            {
              "timestamp": {
                "order": "desc"
              }
            }
          ],
          "query": {
            "bool": {
              "must": [
                {
                  "range": {
                    "timestamp": {
                      "gte": "now-10m"
                    }
                  }
                },
                {
                  "term": {
                    "type": {
                      "value": "ccr_stats"
                    }
                  }
                },
                {
                  "bool": {
                    "should": [
                      {
                        "range": {
                          "ccr_stats.time_since_last_read_millis": {
                            "gte": 600000
                          }
                        }
                      },
                      {
                        "script": {
                          "script": "long gap = doc['ccr_stats.leader_global_checkpoint'].value - doc['ccr_stats.follower_global_checkpoint'].value;\n            return gap>1000;"


                        }
                      }
                    ]
                  }
                }
              ]
            }
          },
          "aggs": {
            "NAME": {
              "terms": {
                "field": "ccr_stats.follower_index",
                "size": 1000
              }
            }
          }
        }
      }
    }
  },
  "condition": {
    "compare": {
      "ctx.payload.hits.total": {
        "gt": 0
      }
    }
  },
  "transform": {
    "script": """
    StringBuilder message = new StringBuilder();
for (def bucket : ctx.payload.aggregations.NAME.buckets) {
  message.append(bucket.key).append('  ')
}
    return [ 'delay_indices' : message.toString().trim()  ]
"""
  },
  "actions" : {
     "add_index": {
      "index": {
        "index": "ccr_delay_indices",
        "doc_type": "doc"
      }
    },
     "my_webhook": {
     "webhook" : {
        "method" : "POST",
        "url" : "http://<yourAddress>:8080",
        "body" : "{\"msgtype\": \"text\", \"text\": { \"content\": \"Please note: {{ctx.payload}}\"}}"
      }
    }
  }

}
The following table describes the key parameters.
Parameter
Description
trigger
The watch trigger interval. In this example, the interval is 10 seconds. Adjust this value as needed.
input.search.request.indices
The target indexes to query. The .monitoring-es* indexes store all monitoring metrics for the cluster, including CCR metrics.
input.search.request.body
The query body. This example queries CCR status from the last 10 minutes. The watch proceeds if either of the following conditions is met:
-
ccr_stats.time_since_last_read_millis > 600000 ms (10 minutes): More than 10 minutes have elapsed since the last read operation from the leader cluster. Adjust this threshold as needed.
-
The difference between ccr_stats.leader_global_checkpoint and ccr_stats.follower_global_checkpoint is greater than 1,000. This means the follower checkpoint is more than 1,000 operations behind the leader checkpoint. Adjust this threshold as needed.
condition
The alert trigger condition. In this example, the alert triggers if the conditions in input.search.request.body are met and the query returns more than zero matching documents.
transform
A preprocessing step. This example iterates through the bucket keys and extracts the names of lagging indexes.
actions
The actions to execute if the condition is true. This example specifies two actions:
-
add_index: Writes the results to an index, which is useful for debugging the watch configuration. -
my_webhook: Sends an alert by using a webhook.
<yourAddress>
The address of the server that receives alerts:
-
For clusters that use the new network architecture, set this parameter to the endpoint of the private connection. For more information about how to obtain the endpoint, see Configure a private connection for an Elasticsearch cluster.
-
For clusters that use the original network architecture, set this parameter to one of the following addresses:
-
The IP address of the NGINX proxy. The NGINX proxy forwards requests from within the VPC to the internet.
-
The webhook URL of the DingTalk chatbot.
-
body
Configure this value according to the security settings of the DingTalk chatbot.
For example, if you select Custom Keywords as the Security Settings and add note as a keyword in Step 1: Create and configure a DingTalk chatbot, the content field in the body must contain the word note for the chatbot to process the alert.
NoteIf you see the error
No handler found for uri [/_xpack/watcher/watch/log_error_watch_2] and method [PUT]when you run the command, X-Pack Watcher is not enabled for your Alibaba Cloud Elasticsearch instance. You must enable it and then run the command again. For more information, see Configure YML parameters. -
Step 4: View the alert
If the CCR status meets the alert condition configured in Step 3: Configure the watch, you receive an alert in your DingTalk group.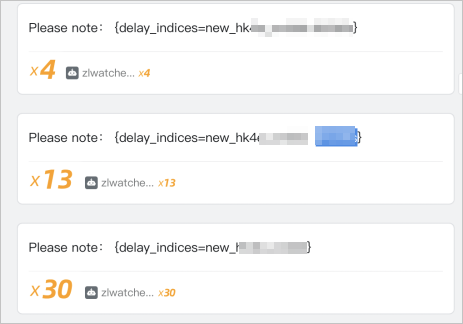
If you no longer need the watch, run the following command to delete it.
DELETE _watcher/watch/ccr_watcher