Metricbeat collects system metrics from a machine and sends them to an Alibaba Cloud Elasticsearch instance for search, analysis, and visualization in Kibana. This topic uses macOS as an example.
Prerequisites
-
You have created an Alibaba Cloud Elasticsearch instance.
For more information, see Create an Alibaba Cloud Elasticsearch instance.
NoteIf you need to access the Alibaba Cloud Elasticsearch instance over its internal endpoint, you must also have an ECS instance. The ECS instance must be in the same region, availability zone, and VPC as your Elasticsearch instance. For more information, see Create an instance by using a custom configuration.
-
Download Metricbeat:
Background
Beats is a platform of lightweight, single-purpose data shippers that send data from hundreds or thousands of machines to Logstash or Elasticsearch.
Metricbeat is a lightweight shipper that collects system and service metrics — from CPU and memory usage to Redis and Nginx statistics — with minimal overhead.
Procedure
-
Note
You can also use these steps to collect metrics from computers that run Linux or Windows and send them to your Alibaba Cloud Elasticsearch instance.
Configure Alibaba Cloud Elasticsearch
Log on to the Alibaba Cloud Elasticsearch console.
In the left navigation menu, choose Elasticsearch Clusters.
Navigate to the target cluster.
In the top navigation bar, select the resource group to which the cluster belongs and the region where the cluster resides.
On the Elasticsearch Clusters page, find the cluster and click its ID.
-
In the left-side navigation pane, click Security.
-
Turn on the Public Network Access switch. After the configuration takes effect, click Public IP Whitelist next to Edit and add your computer's public IP address to the whitelist.
ImportantIf your computer connects to the internet through a shared network like Wi-Fi, you must add the IP address of the network's bastion host. If you cannot obtain this IP address, you can add
0.0.0.0/1,128.0.0.0/1as a temporary solution. Be aware that this configuration exposes your Alibaba Cloud Elasticsearch instance to the public internet. Assess the risks before proceeding. -
In the left-side navigation pane, click Basic Information. In the Basic Information section, find and copy the instance's Public Address, which you will need later.
-
In the left-side navigation pane, click Cluster Configuration. In the YML File Configuration section, click Modify Configuration, and set Auto Indexing to Enable.
WarningThis action requires an instance restart, which will cause a temporary service interruption. Proceed only if it is safe to do so.
-
Select the This operation will restart the cluster. Continue? checkbox, and then click OK.
You can monitor the restart progress on the Task List page. After the instance restarts, the configuration is complete.
Configure Metricbeat
-
Decompress the downloaded Metricbeat package and navigate to the Metricbeat directory.
$ cd metricbeat-6.3.1-darwin-x86_64 $ ls LICENSE.txt data logs metricbeat.yml NOTICE.txt fields.yml metricbeat modules.d README.md kibana metricbeat.reference.yml $ -
Open the metricbeat.yml file, locate the
Elasticsearch outputsection, and uncomment the relevant lines.#================================ Outputs ===================================== # Configure what output to use when sending the data collected by the beat. #-------------------------- Elasticsearch output ------------------------------ output.elasticsearch: # Array of hosts to connect to. hosts: ["es-cn-xxx.public.elasticsearch.aliyuncs.com:9200"] # Optional protocol and basic auth credentials. protocol: "http" username: "xxx" password: "xxx"Parameter
Description
hosts
The public or internal endpoint of your Elasticsearch instance. This topic uses a public endpoint.
protocol
Set to http.
username
The default username is elastic.
password
The password for the specified username. The password for the
elasticuser is set when you create the instance. If you have forgotten it, you can reset it. For more information, see Reset the access password of an instance. -
Run the following command to start Metricbeat.
./metricbeat -e -c metricbeat.ymlOnce started, Metricbeat sends data to your Elasticsearch instance.
View dashboards in Kibana
-
Log on to the Kibana console of your target Elasticsearch instance.
For more information, see Log on to the Kibana console.
-
(Optional) In the left menu bar, click Management and create an index pattern:
NoteIf you have already created an index pattern, skip this step.
-
In the Kibana section, click Index Patterns.
-
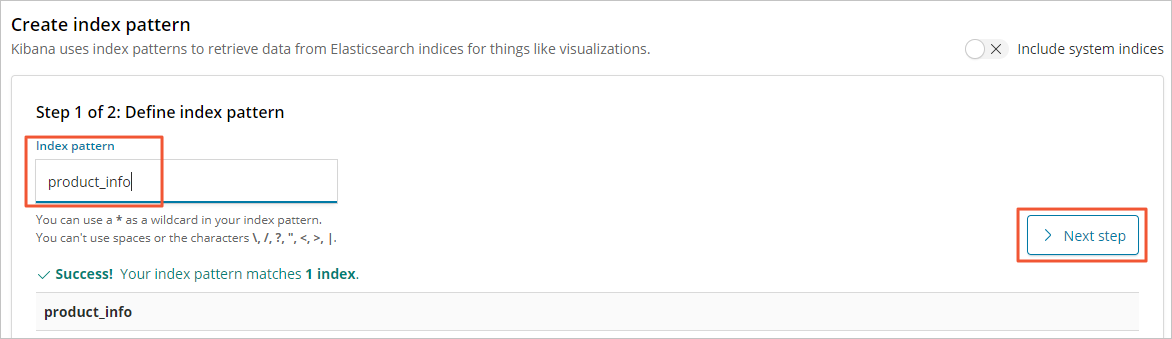
On the Create index pattern page, enter a name for the index pattern. This is the name of the index that you want to query.
-
Click Next step.
-
Click Create index pattern.
-
-
In the left-side navigation pane, click Dashboard.
-
On the Dashboard page, view the collected data.
-
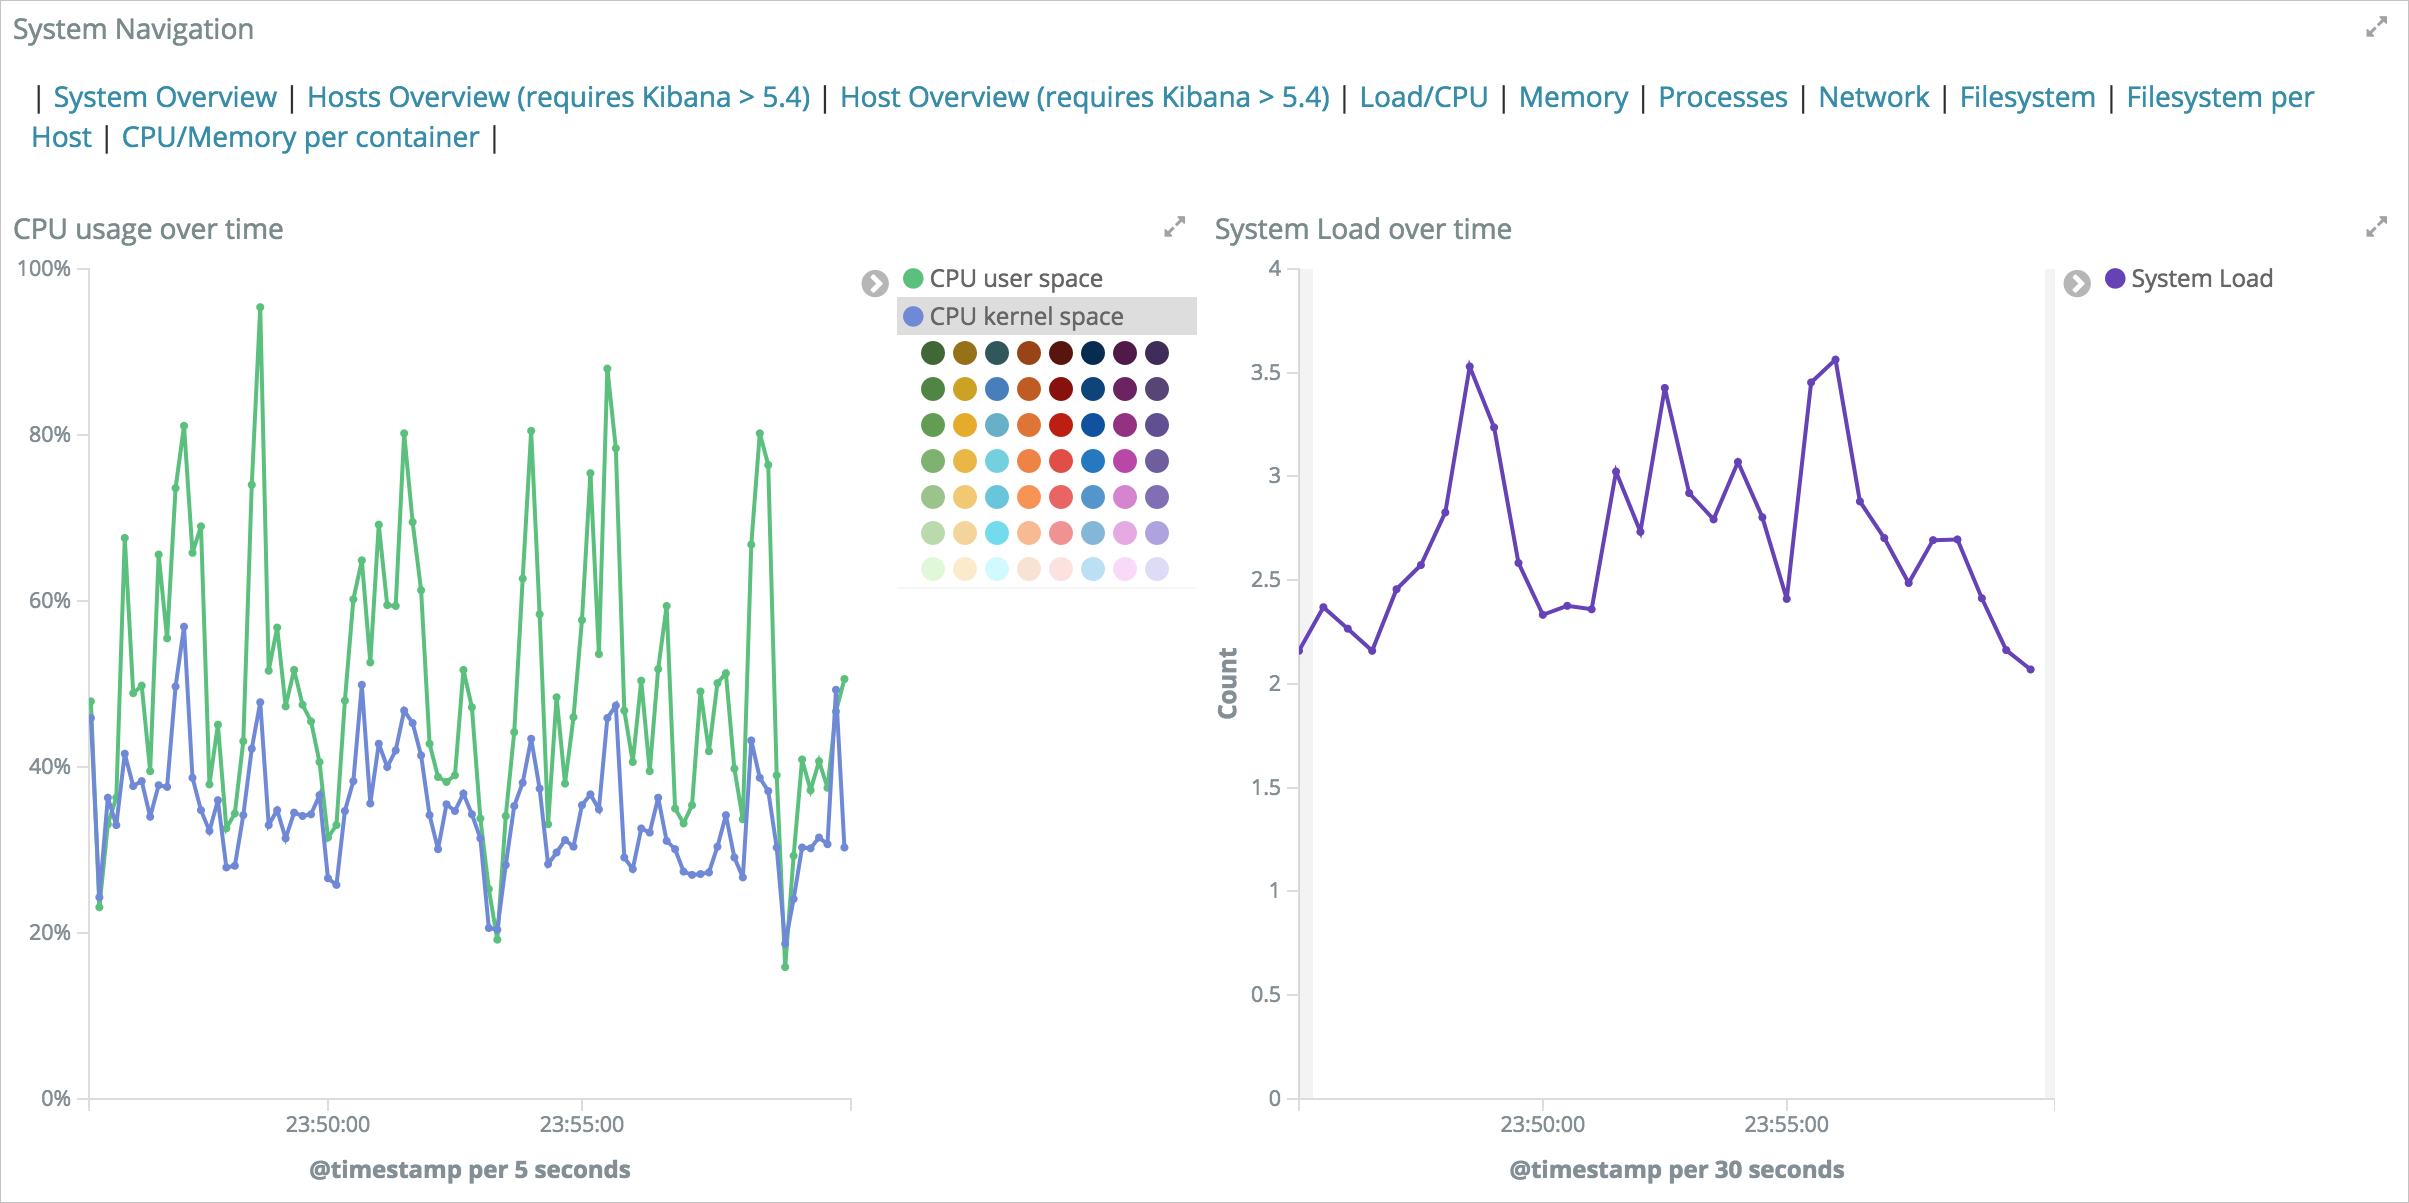
A list of available metric dashboards appears.
-
Click Metricbeat-cpu to view CPU metric details.
 Note
NoteYou can set the data refresh interval to 5 seconds, generate reports, and configure a webhook for alert notifications.
-