You can use an Alibaba Cloud Logstash pipeline to sync data from Azure Event Hubs to an Alibaba Cloud Elasticsearch instance.
Procedure
Step 1: Prepare the environment and instances
- Create an Alibaba Cloud Elasticsearch instance and enable automatic index creation. This example uses a version 7.10 instance.
For more information, see Create an Alibaba Cloud Elasticsearch instance and Configure YML parameters.
- Create an Alibaba Cloud Logstash instance and configure a NAT Gateway for public network access. This example uses a version 7.4 instance.
For more information, see Create an Alibaba Cloud Logstash instance.Alibaba Cloud Logstash instances are deployed in a VPC. To allow Logstash to communicate with Azure Event Hubs over the public internet, configure a NAT Gateway for the VPC. For more information, see Configure public network access by using a NAT Gateway.Note For a self-managed Logstash installation, purchase an ECS instance in the same VPC as your Alibaba Cloud Elasticsearch instance and assign an Elastic IP Address to it. You do not need to purchase a new ECS instance if you already have one that meets the requirements.
- Prepare your Azure Event Hubs environment.
For more information, see the official Azure Event Hubs documentation.
Step 2: Create and configure a Logstash pipeline
Go to the Logstash Clusters page.
Navigate to the target cluster.
In the top navigation bar, select the region where the cluster resides.
On the Logstash Clusters page, find the cluster and click its ID.
-
In the left-side navigation pane, click Pipelines.
-
Click Create Pipeline.
- On the Create page, enter a Pipeline ID and configure the pipeline.
The following pipeline configuration is used in this example.
input {
  azure_event_hubs {
     event_hub_connections => ["Endpoint=sb://abc-****.****.cn/;SharedAccessKeyName=gem-****-es-consumer;SharedAccessKey=******;EntityPath=xxxxxx"]
     initial_position => "beginning"
     threads => 2
     decorate_events => true
     consumer_group => "group-kl"
     storage_connection => "DefaultEndpointsProtocol=https;AccountName=xxxxx;AccountKey=*******;EndpointSuffix=core.****.cn"
     storage_container => "lettie_container"
   }
}
filter {

}
output {
  elasticsearch {
    hosts => ["es-cn-tl****5r50005adob.elasticsearch.aliyuncs.com:9200"]
    index => "test-log"
    password => "xxxxxx"
    user => "elastic"
  }
}
Table 1. Input parameters Parameter Description event_hub_connections A list of connection strings for the event hubs to read from. The connection string includes the EntityPathof the event hub. For more information, see event_hub_connections.Note Each event hub requires a separate event_hub_connections parameter. The other parameters apply to all event hubs.initial_position The position in the event hub from which to start reading data. Valid values: beginning(default),end, andlook_back. For more information, see initial position .threads The total number of threads for event processing. For more information, see threads. decorate_events Specifies whether to include event hub metadata in the synchronized data, such as the event hub name, consumer group, processor host, partition, offset, sequence, timestamp, and event size. For more information, see decorate events. consumer_group The consumer group used to read data from the event hub. Create a dedicated consumer group for Logstash and ensure that all Logstash nodes use it to coordinate their work. For more information, see consumer group. storage_connection The connection string for the Azure Blob Storage account. This storage persists the offset across restarts, allowing multiple Logstash nodes to process different partitions. If this parameter is set, Logstash resumes processing from where it stopped after a restart. If not set, it resumes from the position specified by initial_position. For more information, see storage connection. storage_container The name of the storage container used to persist offsets and coordinate work among multiple Logstash nodes. For more information, see storage container. Note To avoid overwriting offsets, use a unique storage_container name for each pipeline. If you write the same data to multiple services, specify a different name for each pipeline.Table 2. Output parameters Parameter Description hosts The endpoint of your Alibaba Cloud Elasticsearch instance. The format is http://<Your Alibaba Cloud Elasticsearch instance ID>.elasticsearch.aliyuncs.com:9200.index The name of the destination index. user The username for accessing the Elasticsearch instance. Default value: elastic.password The password for the specified user. You set the password for the elasticuser when you create the Elasticsearch instance. If you forget the password, you can reset it. For more information, see Reset the access password of an instance.For more information about pipeline configuration, see Logstash Configuration Files.
-
Click Next step and configure the pipeline parameters.
Parameter
Description
Pipeline Workers
Number of worker threads for the filter and output stages. Increase this value if events are backlogged or CPU is underutilized. Default: the number of CPU cores.
Pipeline Batch Size
Maximum events a worker collects before executing filters and outputs. Larger batches increase memory usage and may require a larger JVM heap size (LS_HEAP_SIZE). Default: 125.
Pipeline Batch Delay
Wait time in milliseconds before dispatching an undersized batch to a worker thread. Default: 50 ms.
Queue Type
Internal queuing model for event buffering. Valid values:
-
MEMORY: Default. Uses an in-memory queue.
-
PERSISTED: A disk-based persistent queue.
Queue Max Bytes
The maximum amount of data the queue can store, in
MB. The value must be an integer from1to253-1. Default value:1024.NoteMake sure that this value is less than your total disk capacity.
Queue Checkpoint Writes
Maximum events written before a checkpoint is forced (persistent queue only). 0 means no limit. Default: 1024.
WarningSaving and deploying triggers an instance restart. Proceed only if this will not impact your business.
-
-
Click Save or Save and Deploy.
-
Save: Saves the pipeline configuration but does not apply it. After saving, you are returned to the Pipelines page. In the Pipelines section, you can click Deploy Now in the Actions column to restart the instance and apply the configuration.
-
Save and Deploy: Saves and deploys the configuration, restarting the instance to apply the changes.
-
Step 3: Verify the results
Log on to the Kibana console of your Elasticsearch cluster and go to the Kibana homepage.
In the left navigation menu, click Dev tools.
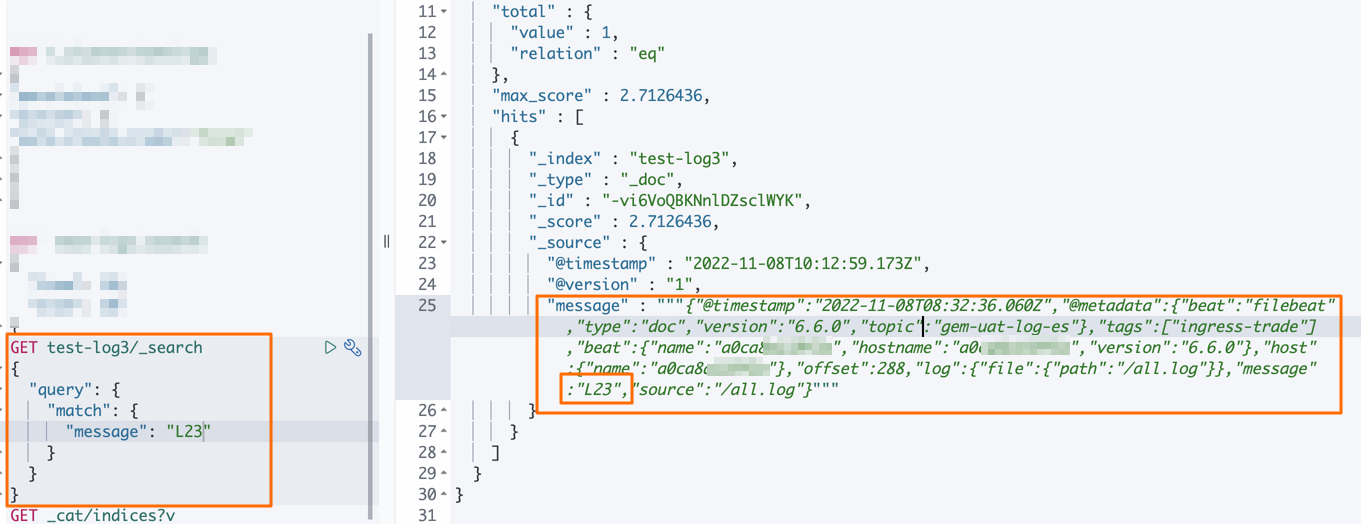
- In the Console, run the following command to check the synchronized data.
GET test-log3/_search
{
  "query":{
    "match":{
      "message":"L23"
     }
   }
}
Expected output: