Use Filebeat to ship Apache HTTP server logs to an Alibaba Cloud Elasticsearch instance for analysis. The pipeline works as follows: Filebeat runs on an Elastic Compute Service (ECS) instance and tails the Apache access log, forwards log events to Alibaba Cloud Logstash for filtering, and then Logstash writes the processed data to Elasticsearch. Kibana lets you query and visualize the results.
Prerequisites
Before you begin, ensure that you have:
An Alibaba Cloud Elasticsearch instance and an Alibaba Cloud Logstash instance in the same version and the same virtual private cloud (VPC). Logstash receives data from Filebeat and forwards it to Elasticsearch, so all three components must share the same network
An Alibaba Cloud ECS instance in the same VPC and region as the Elasticsearch and Logstash instances. Filebeat only collects logs from ECS instances in the same region and VPC — Internet-based collection is not supported
ImportantBeats supports only Alibaba Cloud Linux, Red Hat, and CentOS operating systems.
Automatic index creation enabled for your Elasticsearch instance. Beats requires this feature to create indexes automatically. By default, Alibaba Cloud Elasticsearch disables automatic index creation for security reasons. For instructions, see Configure YML parameters
An Apache httpd service running on the ECS instance, with logs formatted as JSON. See Step 1: Set up the Apache httpd service for the required configuration
Cloud Assistant and Docker installed on the ECS instance. For Cloud Assistant, see Install the Cloud Assistant Agent. For Docker, see Install and use Docker and Docker Compose
To create the required instances, follow the instructions in these topics: Create an Alibaba Cloud Elasticsearch instance, Create an Alibaba Cloud Logstash instance, and Create an ECS instance using the wizard.
Step 1: Set up the Apache httpd service
Configure Apache to write access logs in JSON format. JSON-formatted logs let Logstash parse each field individually without a custom grok pattern, which simplifies the pipeline configuration.
In httpd.conf, add the following LogFormat directive and update CustomLog to use it:
LogFormat "{\"@timestamp\":\"%{%Y-%m-%dT%H:%M:%S%z}t\",\"client_ip\":\"%{X-Forwa rded-For}i\",\"direct_ip\": \"%a\",\"request_time\":%T,\"status\":%>s,\"url\":\"%U%q\",\"method\":\"%m\",\"http_host\":\"%{Host}i\",\"server_ip\":\"%A\",\"http_referer\":\"%{Referer}i\",\"http_user_agent\":\"%{User-agent}i\",\"body_bytes_sent\":\"%B\",\"total_bytes_sent\":\"%O\"}"  access_log_json
# Comment out the original CustomLog line, then add:
CustomLog "logs/access_log" access_log_json
This configuration captures the following fields in each log entry: @timestamp, client_ip, direct_ip, request_time, status, url, method, http_host, server_ip, http_referer, http_user_agent, body_bytes_sent, and total_bytes_sent.
For reference, see Manually build a Magento 2 e-commerce website (Ubuntu).
Step 2: Configure and install the Filebeat collector
Log on to the Alibaba Cloud Elasticsearch console.
In the top navigation bar, select a region. In the left-side navigation pane, click Beats Data Shippers.
If this is the first time you access the Beats Data Shippers page, click OK in the authorization prompt to let the system create a service-linked role for your account.
ImportantDo not delete the service-linked role. Beats depends on it and the rules specified for it. For more information, see Elasticsearch service-linked roles.
In the Create Shipper area, click ECS Logs.
Configure the collector. For configuration details, see Collect ECS service logs. For a full list of YML options, see Collector YML configuration. Use the following settings:
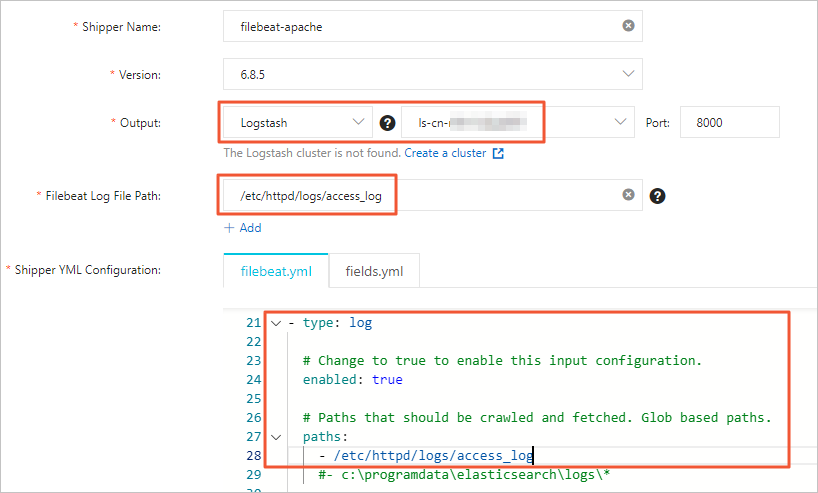 Note
NoteSet the collector Output to the instance ID of your Logstash instance — not the Elasticsearch instance. Do not specify the Output parameter again in the YML configuration. For the Filebeat file directory, enter the path to the Apache log directory and enable log data collection in the YML configuration.
Click Next.
In the Install Shipper wizard, select the ECS instance you configured in Step 1.
Click Start to start the collector.
After the Start Shipper dialog box appears, click Back to Beats Shippers to return to the Beats Data Shippers page.
In the Manage Shippers section, wait for the Shipper Status to change to Enabled, then click View Instances in the Actions column.
On the View Instances page, confirm that Installed Shippers shows a status of Normal Heartbeat. This confirms that the collector is installed and running.
Step 3: Configure a Logstash pipeline
In the left-side navigation pane of the Elasticsearch console, click Logstash Clusters.
In the Actions column of your Logstash instance, click Manage Pipeline.
On the Pipelines page, click Create Pipeline.
Configure the pipeline with the following settings. For detailed instructions, see Manage pipelines with configuration files.
input {
  beats {
    port => 8000
  }
}
filter {
  json {
    source => "message"
    remove_field => "@version"
    remove_field => "prospector"
    remove_field => "beat"
    remove_field => "source"
    remove_field => "input"
    remove_field => "offset"
    remove_field => "fields"
    remove_field => "host"
    remove_field => "message"
  }
}
output {
  elasticsearch {
    hosts => ["http://es-cn-mp91cbxsm00******.elasticsearch.aliyuncs.com:9200"]
    user => "elastic"
    password => "<YOUR_PASSWORD>"
    index => "<YOUR_INDEX>"
  }
}
Replace the placeholders with your actual values:
Placeholder Description http://es-cn-mp91cbxsm00******.elasticsearch.aliyuncs.com:9200Endpoint of your Elasticsearch instance. Find it on the Basic Information page of the instance. For more information, see View the basic information of an instance. <YOUR_PASSWORD>Password for your Elasticsearch instance <YOUR_INDEX>Name of the Elasticsearch index to write to The pipeline sections work as follows:
Section What it does inputListens on port 8000 for data forwarded by Beats filterApplies the JSON plugin to parse the messagefield, then removes metadata fields that are not needed for analysis (@version,prospector,beat,source,input,offset,fields,host,message)outputWrites processed events to the specified Elasticsearch index NoteThe
filterconfiguration above is for this example scenario. Adjust theremove_fieldlist and add other filter plugins as needed for your use case. For available filter plugins, see Filter plugins.
Step 4: Verify data collection
Log on to the Kibana console of your Elasticsearch cluster. For instructions, see Log on to the Kibana console.
NoteThis example uses Elasticsearch V6.7.0. Steps may differ for other versions.
In the left-side navigation pane, click Dev Tools.
In the Console, run the following query to confirm that log data is being written to your index:
GET <YOUR_INDEX>/_searchReplace
<YOUR_INDEX>with the index name you specified in the Logstash pipelineoutputsection.In the left-side navigation pane, click Discover. Select a time range to browse the collected log events.
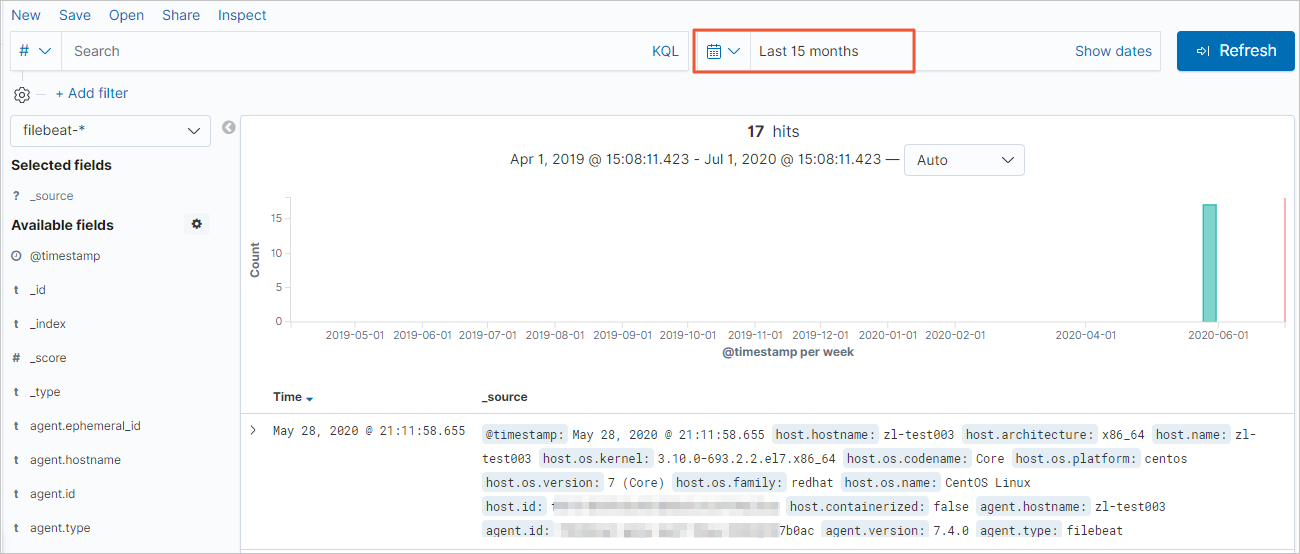 Note
NoteIf no data appears, try extending the time range — by default, Kibana shows only the last 15 minutes. Also confirm that you have created an index pattern for
<YOUR_INDEX>(Kibana > Management > Kibana > Index Patterns > Create Index Pattern).
What's next
After verifying that Apache log data is flowing into Elasticsearch, you can:
Build Kibana dashboards and visualizations to monitor traffic, error rates, and response times.
Refine the Logstash
filtersection to extract additional fields or enrich log events with geographic data using the GeoIP plugin.Review the Collector YML configuration to add more log paths or adjust multiline handling.