Prometheus local storage is not clustered or replicated — it cannot scale out, has no data replicas, no data backup capability, and does not support hot and cold data separation, making it unsuitable for production workloads that require durability. Alibaba Cloud Elasticsearch solves this through TimeStream, a time series engine that exposes a Prometheus-compatible remote_write endpoint and PromQL query API. Your existing Prometheus configuration works without modification: point remote_write at Elasticsearch, then use the same PromQL queries in Grafana to visualize metrics stored in a distributed, highly available cluster.
This guide shows how to configure Alibaba Cloud Elasticsearch as a Prometheus remote storage backend and visualize metrics in Grafana.
How the components connect
| Component | Role |
|---|---|
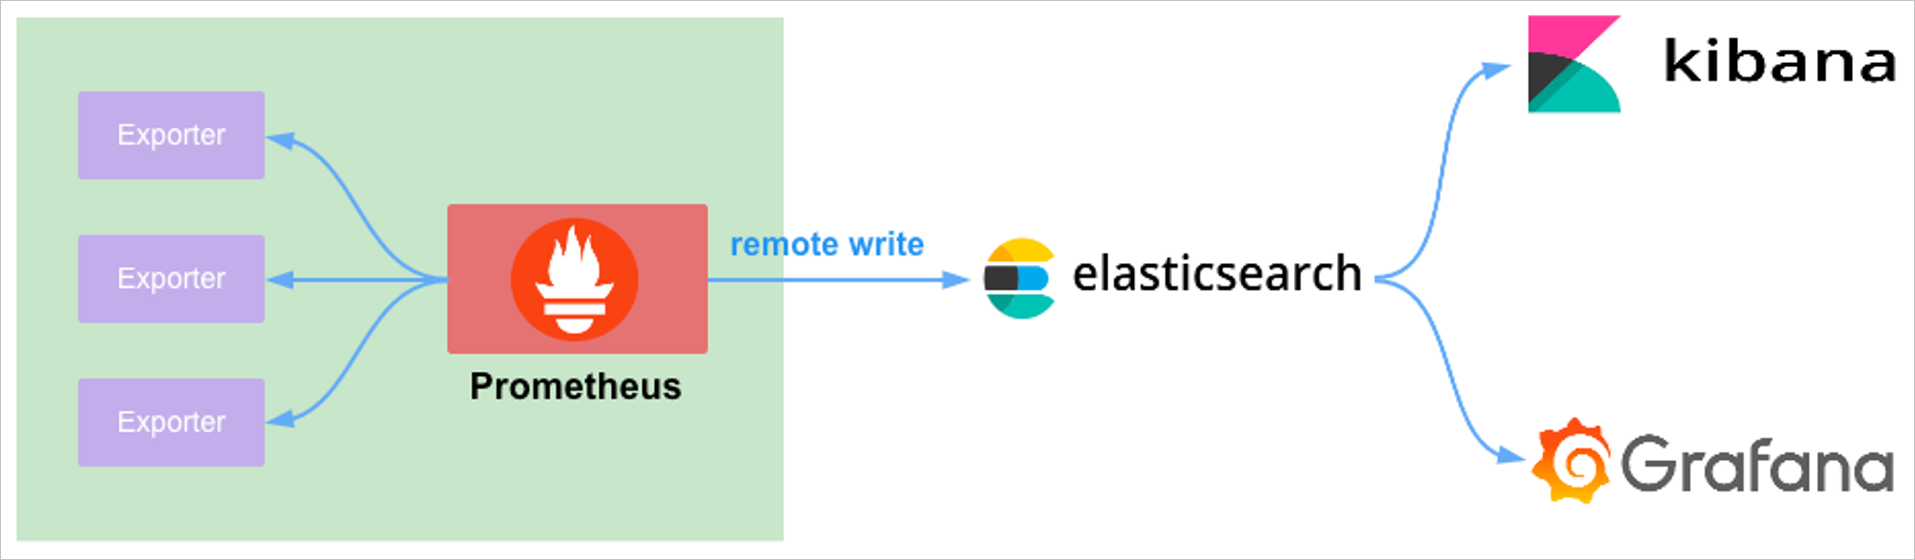
| Prometheus | Scrapes metrics from exporters, then forwards data to Elasticsearch via remote_write |
| Elasticsearch (TimeStream) | Stores and indexes time series metrics; exposes a Prometheus-compatible query API |
| Grafana | Visualizes data from the Elasticsearch TimeStream index using the Prometheus data source and PromQL |
| Kibana | Provides an alternative interface for viewing data synced from Prometheus to Elasticsearch |
The following diagram shows the full integration:
When querying Elasticsearch data in Grafana, use either the native Elasticsearch data source or the Prometheus data source with PromQL.
Prerequisites
Before you begin, make sure you have:
-
An Alibaba Cloud Elasticsearch cluster that meets one of the following version requirements: For details, see Create an Alibaba Cloud Elasticsearch cluster.
-
Version V7.10, kernel version V1.8.0 or later
-
Version V7.16 or later, kernel version V1.7.0 or later
-
Set up the monitoring stack
The setup consists of four steps: prepare the environment, install and start node_exporter, configure Prometheus remote storage, and connect Grafana.
Step 1: Prepare the environment
-
Create an Alibaba Cloud Elasticsearch instance of the General Business Edition V7.16. For details, see Create an Alibaba Cloud Elasticsearch instance.
-
Create an Elastic Compute Service (ECS) instance in the same virtual private cloud (VPC) as the Elasticsearch instance, running Linux. This ECS instance hosts Prometheus and Grafana, and accesses the Elasticsearch cluster over the internal network. For details, see Customize instance purchase.
-
Create a TimeStream index to receive Prometheus data.
-
Log on to the Kibana console of your Elasticsearch instance. For details, see Log on to the Kibana console.
-
In the left navigation pane, click the
 icon, then select Management > Developer Tools.
 -
Run the following command to create a TimeStream index named
prom_index: ``PUT _time_stream/prom_index``
-
Step 2: Download and start node_exporter
The Prometheus Node Exporter exposes hardware- and kernel-related metrics for Prometheus to scrape. For more information, see node_exporter.
This guide uses regular user permissions as an example.
-
Connect to the ECS instance. For details, see Log on to a Linux instance using a password or an SSH key pair.
-
Download the node_exporter installation package. This example uses node_exporter V1.3.1.
wget https://github.com/prometheus/node_exporter/releases/download/v1.3.1/node_exporter-1.3.1.linux-amd64.tar.gz -
Extract the package and start node_exporter.
tar xvfz node_exporter-1.3.1.linux-amd64.tar.gz
cd node_exporter-1.3.1.linux-amd64
./node_exporter
node_exporter listens on port 9100 by default.
Step 3: Download, configure, and start Prometheus
-
Connect to the ECS instance. For details, see Log on to a Linux instance using a password or key.
-
Download the Prometheus installation package to the root directory. This example uses Prometheus V2.36.2.
cd ~ wget https://github.com/prometheus/prometheus/releases/download/v2.36.2/prometheus-2.36.2.linux-amd64.tar.gz -
Extract the Prometheus installation package.
tar xvfz prometheus-2.36.2.linux-amd64.tar.gz -
Open
prometheus.ymland configure node_exporter andremote_write.For advanced
remote_writeparameters, see remote_write configuration.Placeholder Description <endpoint>Public or internal endpoint of the Elasticsearch instance. Obtain it from the Basic information page. If the ECS instance and Elasticsearch instance are in the same VPC, use the internal endpoint (recommended). Otherwise, use the public endpoint and configure a public access whitelist — see Configure a public or internal-facing access whitelist for an instance. prom_indexThe TimeStream index name. This example uses prom_index, created in Step 1.elasticThe username for the Elasticsearch instance. The default is the elasticadministrator account. To use a custom account, make sure it has permissions to access and manage the TimeStream index — see Control user permissions by using Elasticsearch X-Pack role management.<password>The password for the elasticaccount, set when you created the instance. To reset it, see Reset the access password for an instance.cd prometheus-2.36.2.linux-amd64 vim prometheus.ymlReplace the contents with the following configuration:
scrape_configs:
  - job_name: 'prometheus'
    static_configs:
    - targets: ['localhost:9090']

  # Scrape node metrics from node_exporter
  - job_name: "node"
    static_configs:
    - targets: ["127.0.0.1:9100"]   # node_exporter default port

# Forward metrics to Elasticsearch via TimeStream
remote_write:
  - url: "http://<endpoint>:9200/_time_stream/prom_write/prom_index"
    basic_auth:
      username: elastic
      password: <password>
Replace the placeholders:
-
Start Prometheus.
./prometheus -
Verify that Prometheus data is syncing to the Elasticsearch TimeStream index. In the Kibana console, run the following commands:
-
Check that the
prom_indexindex contains data: ``GET _cat/indices/prom_index?v&s=i`Expected output (key fields):`health status index docs.count store.size green open prom_index <N> <size>`Confirm thatdocs.count` is greater than 0. -
Query and view the data: ``
GET prom_index/_search`Expected output: a JSON response withhits.total.valuegreater than 0, and metric documents in thehits.hits` array.
-
Step 4: Download, start, and configure the Grafana dashboard
-
Connect to the ECS instance. For details, see Log on to a Linux instance using a password or SSH key pair.
-
Download the Grafana installation package to the root directory. This example uses Grafana Enterprise V9.0.2.
cd ~ wget https://dl.grafana.com/enterprise/release/grafana-enterprise-9.0.2.linux-amd64.tar.gz -
Extract the package and start Grafana.
tar xvfz grafana-enterprise-9.0.2.linux-amd64.tar.gz cd grafana-9.0.2 ./bin/grafana-server -
Open
http://<public IP of ECS instance>:3000in a browser to access the Grafana sign-in page.-
The first login uses the default credentials: username
admin, passwordadmin. The system prompts you to change the password immediately after. -
To find the public IP address, go to the ECS console and check the IP address column.
-
Port 3000 must be open. Add an inbound security group rule with destination port 3000 and source set to your client IP. For details, see Add a security group rule.
-
-
Add a Prometheus data source in Grafana.
-
In the left navigation pane, click the
 icon, then select Data sources.
 -
On the Data sources tab, click Add data source.
-
Under Time series databases, click Prometheus.
-
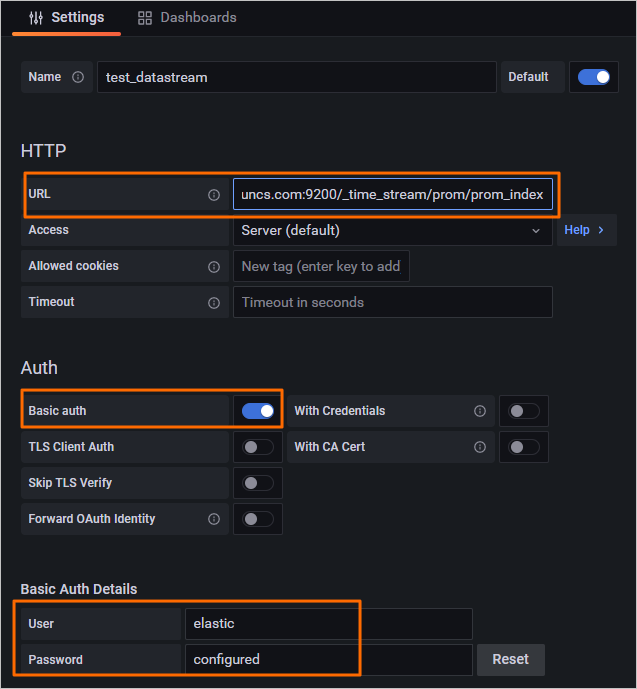
On the Settings tab, configure the data source:
Parameter
Description
URL
The TimeStream query endpoint. Format:
http://<endpoint>:9200/_time_stream/prom/<yourTimeStreamIndex>. Use the same endpoint rules as theremote_writeURL in Step 3 — internal endpoint if in the same VPC, public endpoint otherwise.Basic auth
Enable to authenticate with the Elasticsearch instance.
User
The username for the Elasticsearch instance. Defaults to
elastic. For custom accounts, make sure they have the required permissions — see Control user permissions by using Elasticsearch X-Pack role management.Password
The password for the user account. To reset the
elasticpassword, see Reset instance access password.NoteThe
remote_writeURL uses the path/_time_stream/prom_write/<index>, while the Grafana data source URL uses/_time_stream/prom/<index>. Use the correct path for each. -
Click Save & test. After successful configuration, the page displays Data source is working.
-
-
Create a dashboard to visualize Prometheus metrics.
-
In the left navigation pane, click the
 icon, then select New dashboard.
 -
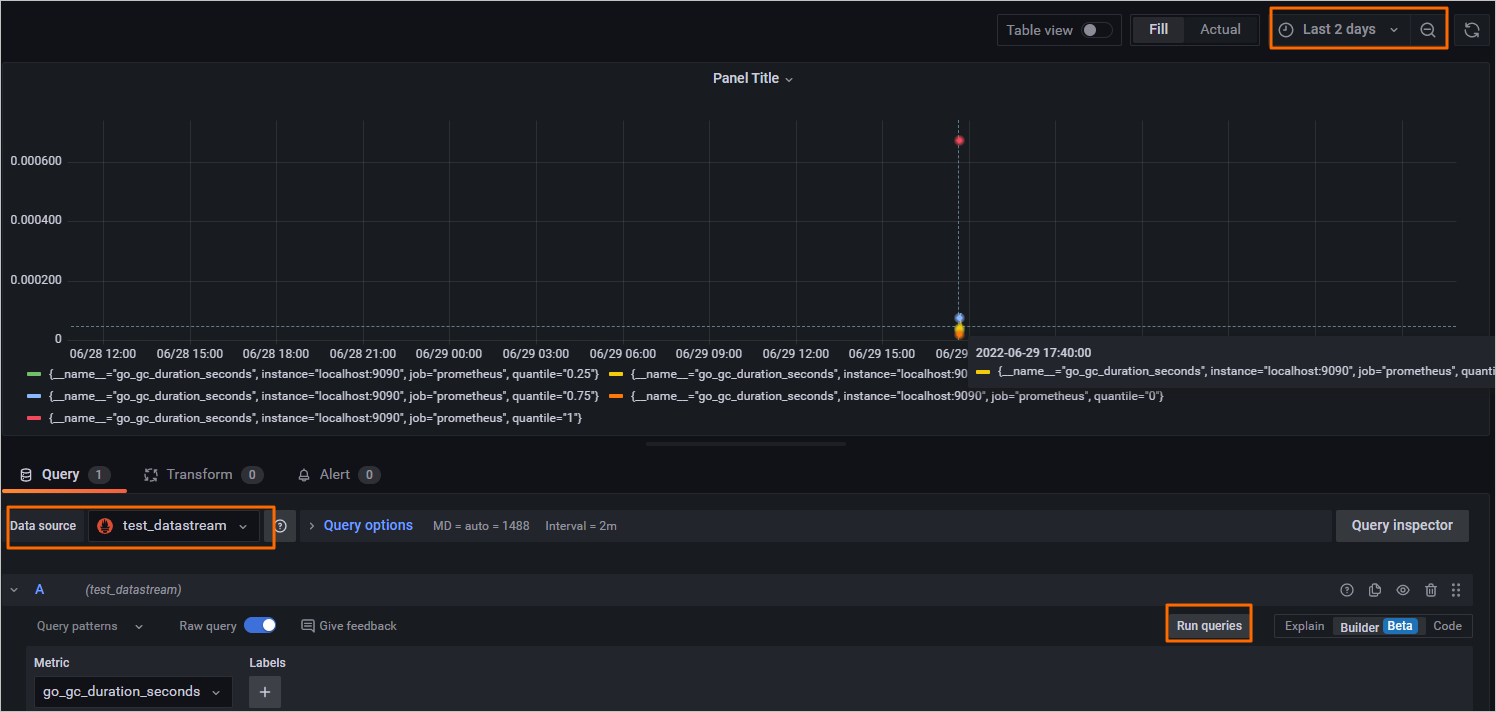
Click Add a new panel.
-
Select the Data source and a time range, then click Run queries to query the data.
-
Click Save in the upper-right corner to save the dashboard.
-
-
Import the built-in node_exporter dashboard from Grafana.
-
In the left navigation pane, click the
icon, then select Import. -
In the Import via grafana.com field, enter the dashboard ID or URL for node_exporter:
1860orhttps://grafana.com/grafana/dashboards/1860.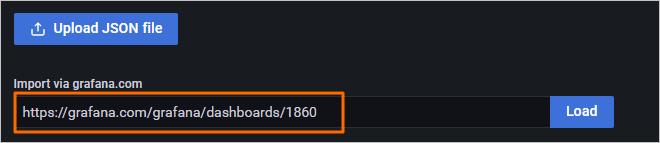
-
Click Load.
-
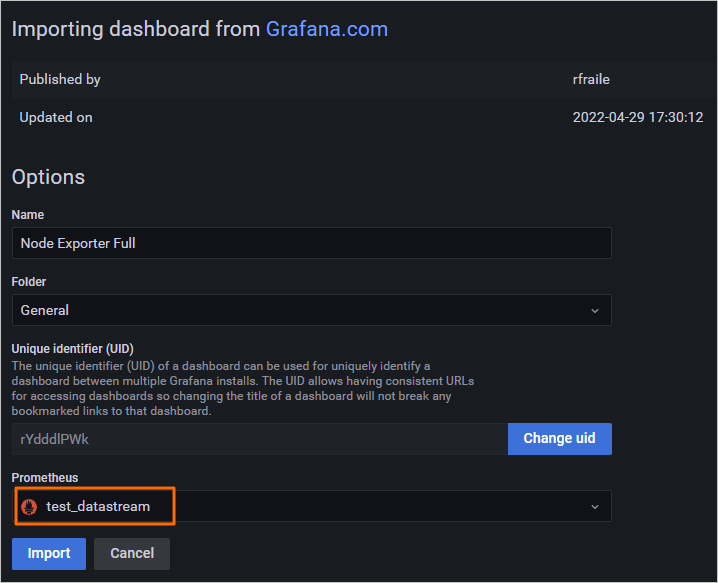
On the configuration page, select the Prometheus data source you created in the previous step.
-
Click Import.
-
In the upper-right corner of the dashboard, select a time range to view metric data for that period.
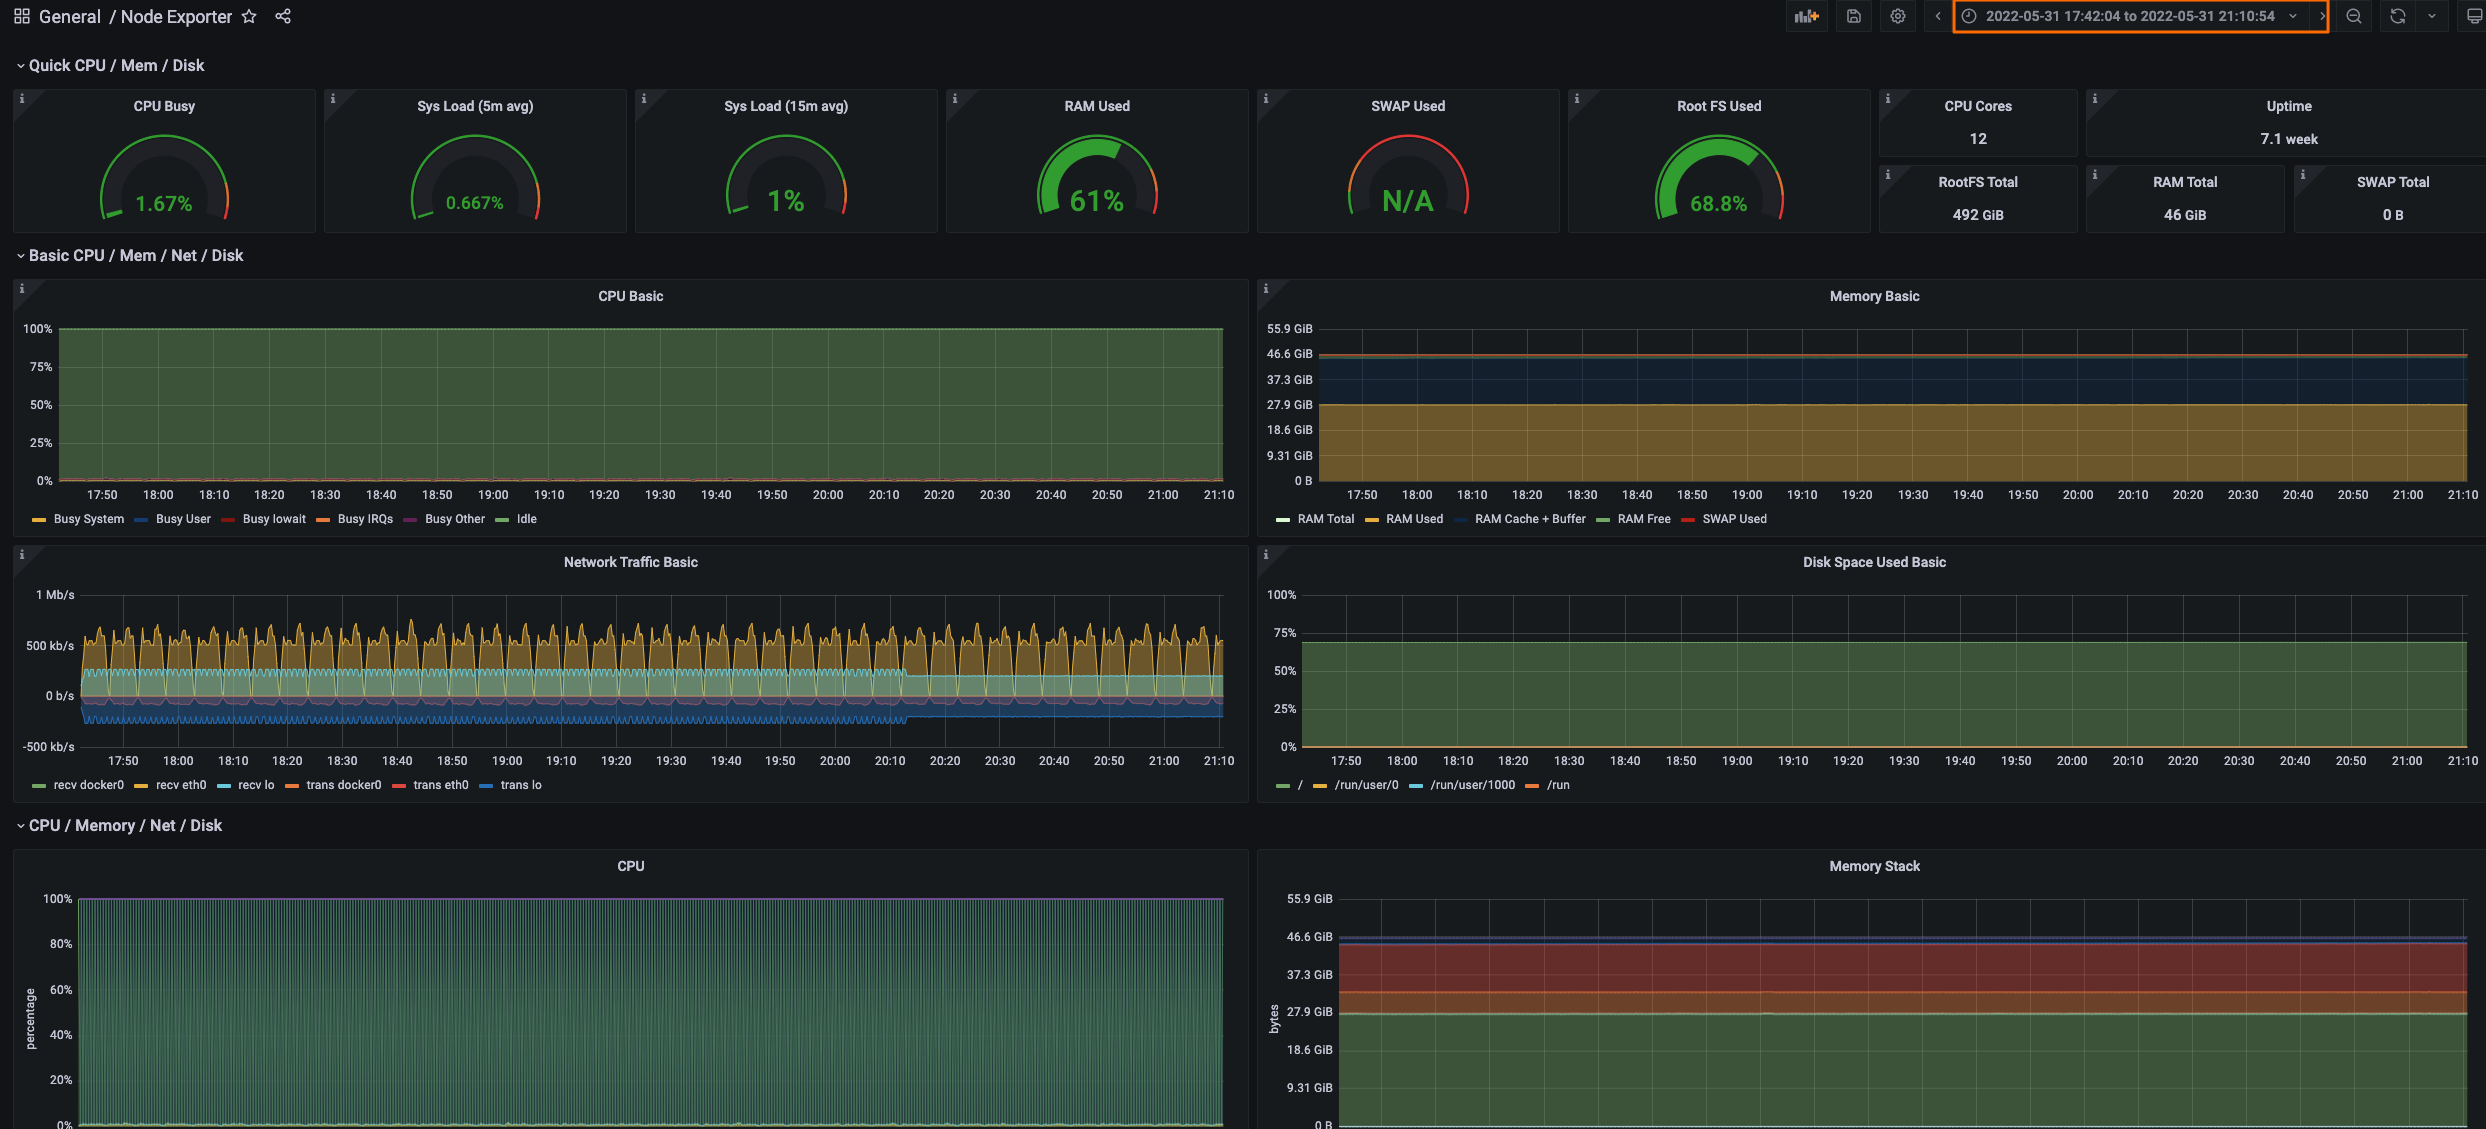 For more information, see the Grafana documentation.
-